Association of tobacco retailer count with smoking population versus vaping population in California (2019)
←
→
Page content transcription
If your browser does not render page correctly, please read the page content below
Purushothaman et al. Archives of Public Health                (2022) 80:42
https://doi.org/10.1186/s13690-022-00799-1

 RESEARCH                                                                                                                                              Open Access

Association of tobacco retailer count with
smoking population versus vaping
population in California (2019)
Vidya Purushothaman1,2, Raphael E. Cuomo1,2, Jiawei Li2,3, Matthew Nali1,2,3 and Tim K. Mackey2,3,4*

  Abstract
  Background: Access to tobacco products, including vape products, from local brick-and-mortar stores influences
  the exposure, uptake, and use of these products in local communities.
  Methods: Licensed tobacco retailers in California were classified as specialized tobacco/vape stores or non-
  specialized stores by obtaining categories published on Yelp. California smoking and vaping prevalence data were
  obtained from the 500 cities project and ESRI community analyst tool respectively. A series of simple linear
  regression tests were performed, at the zip code level, between the retailer count in each store category and
  smoking/vaping population. The Getis-Ord Gi* and Anselin Local Moran’s I statistics were used for characterization
  of tobacco retail density hotspots and cold spots.
  Results: The association between CA smoking/vaping population and number of tobacco retailers was statistically
  significant for all store categories. Variability in smoking population was best explained by variability in non-
  specialized storefronts(R2=0.84). Spatial variability in tobacco-only storefronts explained the least proportion of
  variability in the overall smoking population. Similar results were obtained specific to vaping population, although
  the proportion of population explained by variability in the number of non-specialized storefronts was
  comparatively lower(R2=0.80).
  Conclusions: Localities with greater numbers of non-specialized tobacco retailers had higher rates of smoking/
  vaping populations, and this association was much stronger for localities with greater numbers of specialized
  retailers. Non-specialized storefronts may represent convenient access points for nicotine products, while specialized
  storefronts may represent critical access points for initiation. Hence, regulations that address the entirety of the
  tobacco/vaping retail environment by limiting widespread access from non-specialized stores and reducing appeal
  generated by specialized retailers should be incorporated in future tobacco regulatory science and policymaking.
  Keywords: Tobacco, Vaping, Smoking prevalence, Tobacco Retail, Ecological study

* Correspondence: tkmackey@ucsd.edu
2
 Global Health Policy and Data Institute, San Diego, CA, USA
3
 S-3 Research LLC, San Diego, CA, USA
Full list of author information is available at the end of the article

                                           © The Author(s). 2022 Open Access This article is licensed under a Creative Commons Attribution 4.0 International License,
                                           which permits use, sharing, adaptation, distribution and reproduction in any medium or format, as long as you give
                                           appropriate credit to the original author(s) and the source, provide a link to the Creative Commons licence, and indicate if
                                           changes were made. The images or other third party material in this article are included in the article's Creative Commons
                                           licence, unless indicated otherwise in a credit line to the material. If material is not included in the article's Creative Commons
                                           licence and your intended use is not permitted by statutory regulation or exceeds the permitted use, you will need to obtain
                                           permission directly from the copyright holder. To view a copy of this licence, visit http://creativecommons.org/licenses/by/4.0/.
                                           The Creative Commons Public Domain Dedication waiver (http://creativecommons.org/publicdomain/zero/1.0/) applies to the
                                           data made available in this article, unless otherwise stated in a credit line to the data.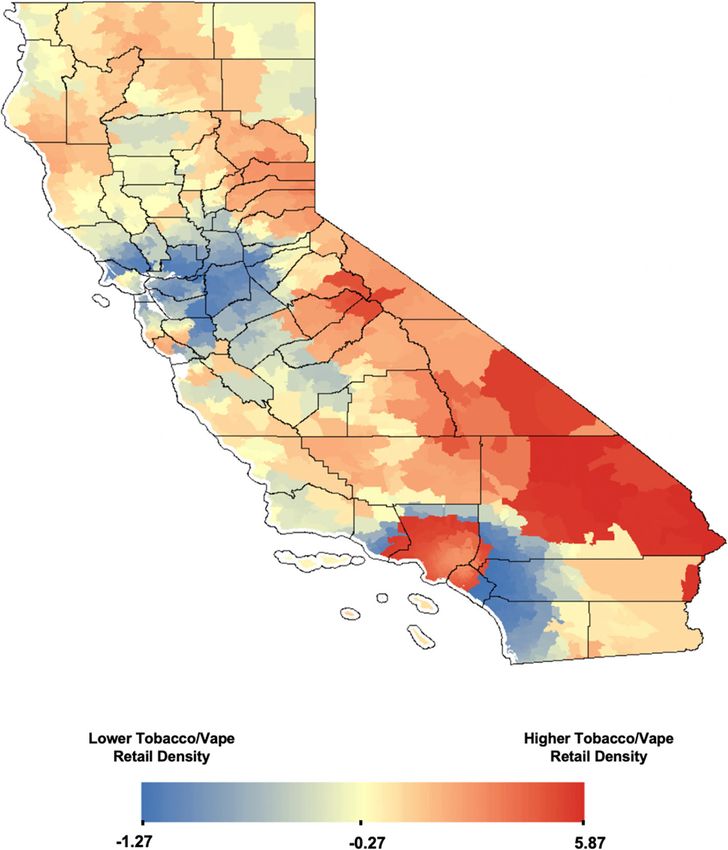
Purushothaman et al. Archives of Public Health   (2022) 80:42                                                     Page 2 of 9

Background                                                      require a license to sell tobacco products direct-to-
National and state-specific growth in the number of re-         consumer [14]. In California, every retailer who sells cig-
tail outlets for the tobacco industry enables easier access     arettes or tobacco products is required to obtain a re-
to conventional (e.g., cigarettes, cigars, little cigars, and   tailer’s license from the California Department of Tax
cigarillos) and emerging tobacco products (E-cigarettes,        and Fee Administration (CDTFA) and renew it annually
IQOS) especially among youth and young adults [1].              (in accordance with the California Cigarette and To-
Furthermore, the tobacco retail landscape is constantly         bacco Products Licensing Act of 2003). In June 2016,
evolving, with the number of access points now expand-          CA state law expanded the definition of tobacco prod-
ing to include specialty stores that exclusively focus on       ucts to specifically include electronic smoking or vaping
the distribution, marketing, and sale of popular vaping         devices that deliver nicotine or other vaporized liquids,
products along with generating demand for other                 resulting in all vaping retailers being required to obtain
alternative and emerging tobacco products (e.g., JUUL,          a license from the CDTFA. Although the CDTFA listing
Heat-Not-Burn) [2].                                             of licensed tobacco retailers is publicly available, it does
   In the United States, the proportion of youth and            not distinguish between specialized tobacco and/or vape
young adults now using vaping products has increased            stores and non-specialized stores (e.g., general retailers,
considerably [3], leading to greater demand and in-             convenience stores, gas stations, etc.).
creased diversity of retailers specializing and exclusively        Yelp is a popular crowd-sourced business listing web-
catering to the vaping community. Also, 58.8% of e-             site that provides business information, location, store
cigarette users were also current cigarette smokers in          ratings and reviews, service/product availability and cat-
the United States [4]. While 12% of California adults           egory for the store’s primary business line. For tobacco
(about 3.6 million) reported current use of one or more         retailers, Yelp may categorize stores as vape shops or to-
tobacco products, cigarette was the most reported to-           bacco shops, but also as a grocery store, convenience
bacco product used, followed by e-cigarettes [5]. The           store, gas station, or other general retailer. Therefore,
rapid growth in vaping popularity over the past decade          using Yelp labelled categories, specialized tobacco and/
[6] has also led to renewed concerns about nicotine             or vape shops can be distinguished from non-specialized
addiction, poisoning, and associated adverse events             retailers that are licensed to sell tobacco products by the
(including the 2019 e-cigarette, or vaping, product use-        CDTFA.
associated lung injury outbreak) [7], drawing greater              Past research has examined the association between
public scrutiny to increased vaping product marketing           tobacco retail density with state-level smoking rates [10]
and accessibility. Specifically, market access to new and       and county-level daily smoking odds [15]. Additionally,
diverse vaping products can lead to never smokers initiat-      small area estimates are used to better understand health
ing, current users transitioning, and also possible dual        behavior related variables in place-based research [16].
product use (i.e., both cigarettes and vape products) [8, 9].   Prior studies have used small area estimates to observe
   Prior studies have suggested that geographic proximity       the place-based inequities in smoking prevalence in the
to a tobacco retailer is associated with higher smoking         largest cities in the United States [17], explore the
prevalence and lower cessation attempts [10]. Smoking           association between vape shop locations and young adult
prevalence is also higher among certain demographic             tobacco use [18], and describe the age disparities in to-
and socioeconomic groups, such as those below poverty           bacco retail density of specialized and non-specialized
line, individuals with lower educational attainment, and        storefronts [19]. However, less is known about the im-
minority groups such as American Indian/Alaska                  pact of tobacco retail exposure on small area estimates
Natives [11] leading to tobacco and health-related dis-         of smoking and vaping prevalence when stratified specif-
parities [12]. This is further worsened through aggressive      ically for specialized tobacco and/or vape stores com-
point-of-sale advertisements, where in 2018 alone, the          pared to non-specialized storefronts. To address this
tobacco industry spent over 7.2 billion dollars on retail       research gap, this exploratory ecological study analyzes
marketing and promotion of their products [13]. In              variations in the association between California tobacco
addition, while the vaping population has increased,            retail store categories and retailer count with levels of
research conducted by the U.S. Centers for Disease              smoking and vaping population at the zip code level.
Control and Prevention (CDC) found that most vape
users were not successful in quitting and instead transi-       Methods
tioned to dual use [4], further aggravating health out-         Data Collection
comes for vaping initiating populations.                        A list of licensed tobacco retailers was obtained from the
   In the United States, requiring tobacco retailers to         California Department of Tax and Fee Administration.
apply for licenses has been used as a form of regulation        The list contains detailed information on retailers who
by state and local governments. As of 2019, 38 states           are currently licensed to sell tobacco and/or vaping
Purushothaman et al. Archives of Public Health   (2022) 80:42                                                    Page 3 of 9

products within the State of California and was collected       Data Analysis
in May 2019. Information from this list includes: (a)           A total of 22,131 retailer licenses were obtained from
license number; (b) owner name; (c) doing business as           the CDTFA, out of which 15,270 (69%) were automatic-
(“DBA”) name; (d) retailer address; (e) date of license         ally categorized by cross-referencing with Yelp store
commencement; and (f) date of license expiry. The               names and addresses. The remaining retailer licenses
licenses obtained from CDTFA were cross-referenced              were manually categorized by using the Yelp search
using Yelp in order to identify tobacco store categories.       function. ArcGIS v10.7.1 (Esri: Redlands, CA) was used
Custom programming scripts were written in the com-             to plot the point coordinates (latitude and longitude) of
puter programming language Python and were used to              each retailer store on a California base map. These point
scrape publicly available store categories linked to Yelp       coordinates were then aggregated to obtain the total
business listings matched for CDTFA store names and             number of retailers within each zip code, for each store
addresses.                                                      category. Aggregated estimates of retailer count by zip
   Businesses on Yelp are automatically assigned different      code were exported to conduct further statistical analysis
business categories based on input from Yelp users or           as better gradient and variation in distribution was ob-
based on categorization from the platform’s data cur-           tained on analyzing the zip code retailer count as a con-
ation teams. Based on existing Yelp categories, the web         tinuous variable.
scraper was used to classify tobacco retailers into the fol-      A series of simple linear regression tests were per-
lowing categories: (i) specialized stores (categorized on       formed to test the association between tobacco and/or
Yelp as “Tobacco Shops” and/or “Vape Shops”) and (ii)           vape store retailer count and smoking population. The
non-specialized stores (i.e., convenience/grocery stores        following categories of retailer count were used as the
etc., that are licensed to sell tobacco and/or vape prod-       dependent variable in regression analysis: (a) specialized
ucts). Specialized stores were further categorized as (i)       stores (number of stores specializing in the sale of to-
tobacco and vape stores (categorized on Yelp as “To-            bacco products, vape products, or both); (b) tobacco-
bacco Shops” and “Vape Shops”); (ii) vape-specific stores       specific stores (number of stores specializing in the sale
(categorized on Yelp as “Vape Shops” only); and (iii)           of tobacco products); (c) vape-specific stores (number of
tobacco-specific stores (categorized on Yelp as “Tobacco        stores specializing in the sale of vape products and other
Shops” only). Using the Microsoft Bing API (Application         emerging and alternative products); (d) tobacco and vape
Programming Interface), the latitude and longitude for          stores (number of stores specializing in the sale of both
each of the retailer addresses was obtained for purposes        tobacco and vape products); and (e) non-specialized
of geolocation.                                                 stores (number of non-specialized retail stores [e.g., con-
   In order to test possible associations between retailer      venience stores, grocery stores] that are licensed to sell
count and store category, smoking prevalence data (i.e.,        tobacco and/or vape products). Regression analyses with
which includes prevalence for smoking and vaping nico-          these dependent variables were then replicated for the
tine) for the year 2019 were obtained from the 500 Cities       vaping population. Population normalized tobacco retail
project available from the CDC, a dataset that provides es-     density was used for further geospatial analysis. Spatial
timates for chronic disease risk factors, health outcomes,      clusters of high values (hot spots) and low values (cold
and clinical preventive services [20]. Additionally, data       spots) for all tobacco and/or vape retailer storefronts
specific to vaping (nicotine) prevalence was obtained from      were mapped before and after normalization using
the Esri Market Potential dataset using Esri’s Community        optimized hot spot analysis tool in ArcGIS v10.7.1
Analyst tool [21]. Esri’s Market Potential data provides de-    (Esri: Redlands, CA). This tool calculates the Getis-
tails about the products and services used by consumers         Ord Gi* statistic and allows for the mapping of re-
and the database is based on survey data which provides         lated z-scores. Spatial autocorrelation was assessed
the expected number of consumers and a Market Poten-            using Anselin Local Moran’s I tool which classifies
tial Index (MPI). The vaping prevalence data was obtained       the retail density areas into hotspots (high–high clus-
at the zip code level for California. Also, retailer count at   ter), cold spots (low–low cluster), spatial outliers
zip code level had better gradient than at the census tract     (high–low or low–high cluster), and non-significant
level. Hence, the smoking prevalence data obtained from         areas. Visualizations using Anselin Local Moran’s I
CDC at the census tract level was aggregated to the zip         tool convey autocorrelation, thereby reflecting how
code level for further analysis. Data for California state      values for a zip code are similar to adjacent zip
population was obtained from the American Community             codes, whereas visualizations using Getis Ord Gi* tool
Survey at the zip code level [22] and was multiplied by         convey spatial clustering, thereby reflecting aggrega-
smoking prevalence and vaping prevalence data to obtain         tions of high or low values. All statistical analyses
smoking population and vaping population respectively at        were conducted using SPSS version 27. A p-value less
the zip code level.                                             than 0.05 was considered statistically significant.
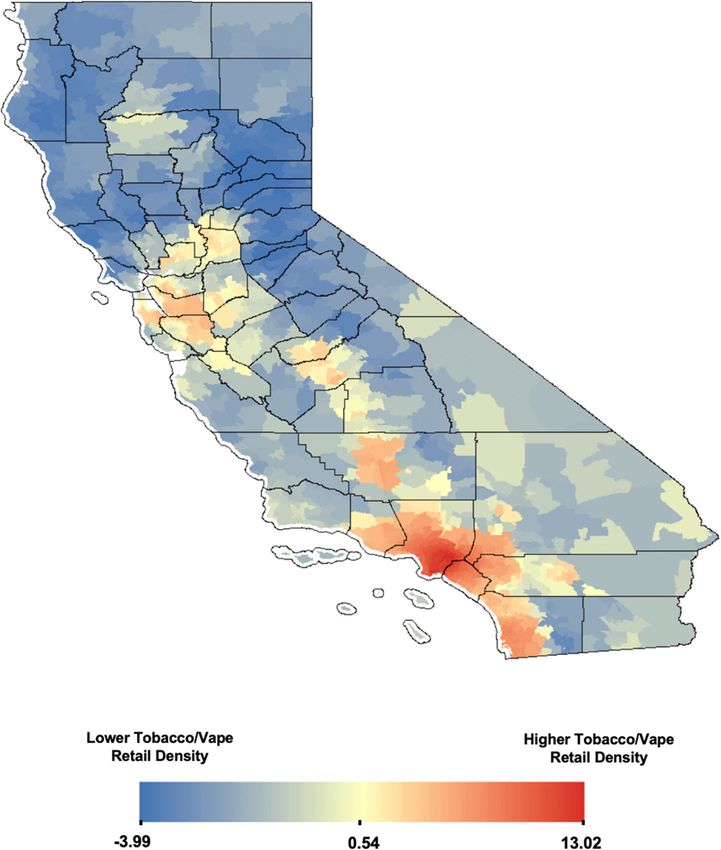
Purushothaman et al. Archives of Public Health       (2022) 80:42                                                           Page 4 of 9

Results                                                                      spots) after population normalization was observed in
A total of 22,131 retail storefronts licensed to sell to-                    Los Angeles County, but not in San Diego County (see
bacco products were cross-referenced using Yelp. Of                          Fig. 2). The Anselin Local Moran’s I showed statistically
these, 90.57% (n=20,044) stores were non-specialized re-                     significant hotspot clustering of tobacco retail store-
tailers, 3.71% (n=820) were tobacco-specific stores,                         fronts in 2019 in Los Angeles County, Orange County,
3.83% (n=848) were vape-specific stores, and 1.89% (n=                       and San Diego County (see Fig. 3).
419) were stores that specialized in selling both tobacco                      Other zip codes with over 100 licensed tobacco
and vape products. Visualization of z-scores across                          and/or vape storefronts were located in San Diego
California revealed clustering of high z-scores (hot spots)                  County (92109, 92110), Orange County (92683,
in densely populated counties such as Los Angeles                            92801, 92804, 92626, 92705), Santa Clara County
County, Orange County, and San Diego County before                           (95110, 95112), San Bernardino County (91730,
normalization (see Fig. 1). Twenty-six zip codes had                         91761, 91764, 92335), and Kern County (93304,
more than 100 licensed tobacco and/or vape storefronts.                      93307). No licensed tobacco and/or vape storefront
The highest retailer count (n=138) was observed for zip                      was located in 794 zip codes. Three-hundred-ninety-
code 92101 in San Diego County with 124 non-                                 four zip codes had between 1 and 25 stores, 291 zip
specialized storefronts and 14 specialized tobacco and/or                    codes had 26-50 stores, 198 zip codes had 51-75
vape storefronts. The clustering of high z-scores (hot                       stores and 66 zip codes had 76-100 stores.

 Fig. 1 Non-normalized Z-scores for spatial hotpots of tobacco retailer count in California (2019)
Purushothaman et al. Archives of Public Health        (2022) 80:42                                                            Page 5 of 9

 Fig. 2 Population normalized Z-scores for spatial hotpots of tobacco retail density in California (2019)

  All linear regression tests found statistically significant                 of non-specialized storefronts licensed to sell tobacco
positive associations between smoking population and                          and/or vape products had the highest effect estimate
retailer count of tobacco and/or vape storefronts at the                      (β = 12.24). The proportion of variability explained by
zip code level (p < 0.001) (see Table 1). The association                     vaping population was highest for the non-specialized
between smoking population and retailer count of non-                         store category (R2= 0.80) and lowest for storefronts spe-
specialized storefronts licensed to sell tobacco and/or                       cialized in selling both tobacco and vape products (R2=
vape products had the highest effect estimate (β = 4.02).                     0.35). While R2 values were comparable between models
The proportion of variability in retailer count that was                      based on smoking population and those based on vaping
explained by smoking population was highest for stores                        population, vaping population explained a slightly lower
in the non-specialized category (R2= 0.84) and lowest for                     proportion of variability in the distribution of non-
storefronts specialized in selling both tobacco and vape                      specialized storefronts while generally explaining a
products (R2= 0.35).                                                          slightly higher proportion of variability in the distribu-
  Similarly, all associations between vaping population                       tion of specialized storefronts.
and retailer count of specialized and non-specialized to-
bacco and/or vape storefronts at the zip code level were                      Discussion
statistically significant (p < 0.001) (see Table 2). The as-                  This study focused on exploring the potential associations
sociation between vaping population and retailer count                        between smoking and vaping population and retailer
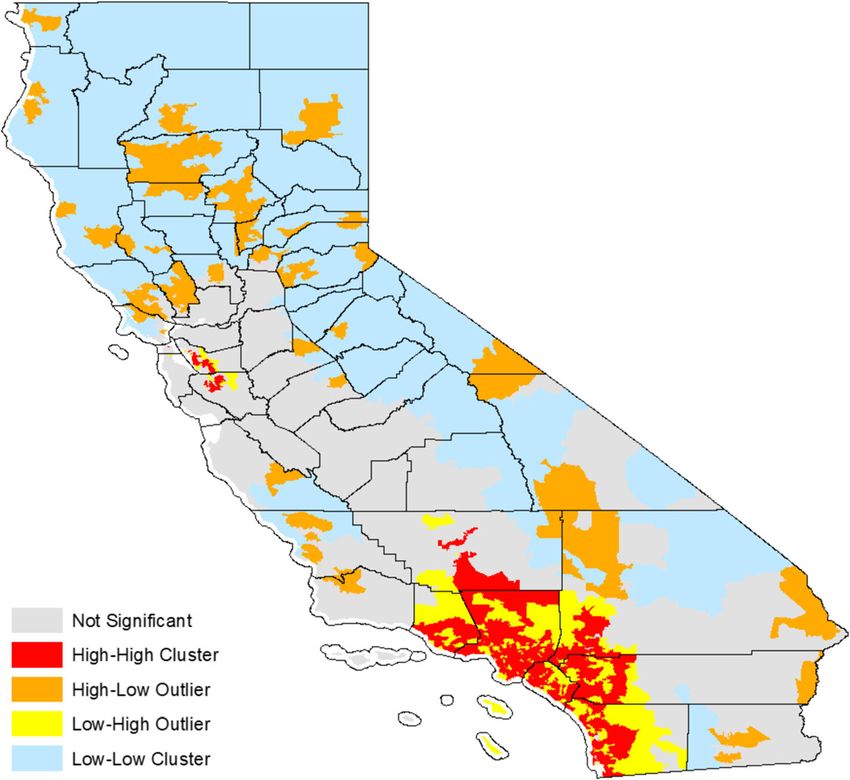
Purushothaman et al. Archives of Public Health        (2022) 80:42                                                               Page 6 of 9

 Fig. 3 Tobacco retail density clusters and outliers by county based on Anselin Local Moran’s I statistic in California (2019)

count of specialized tobacco and/or vape stores in com-                       advertisements at point-of-sale in tobacco retail environ-
parison with non-specialized storefronts that are licensed                    ments for both specialized and non-specialized store-
to sell tobacco products in the state of California. While                    fronts [23]. For example, according to a recent study on
the association was significant for all store categories, the                 convenience store behaviors among youth and young
proportion of variability in the retailer count of non-                       adults, one-third of the participants purchased tobacco
specialized storefronts explained by smoking/vaping                           when visiting a gas station, suggesting that non-
population was substantially higher compared to that of                       specialized retailers serve as critical access points in the
specialized tobacco and/or vape shops. Modeling also sug-                     acquisition and initiation of tobacco products [24]. How-
gested that specialized storefronts may have a slightly                       ever, variability in marketing strategies and advertise-
closer relationship with vaping than with smoking since                       ments in gas stations and other convenience stores may
vaping population explained a higher proportion of vari-                      moderate these associations [25].
ability in the distribution of specialized storefronts.                         Prior research has also observed that prohibiting issu-
  Existing research provides evidence on positive associ-                     ance of permits to any new tobacco retailer to operate
ations between smoking and exposure to promotional                            within 1000 feet of a K–12 school or within 500 feet of

Table 1 Smoking population in association with tobacco retailer count by store type, California, 2019
Retailer count                                     Smoking Population Estimate (SE)                                p-value              R2
Specialized stores                                 0.39 (0.009)                                                    < 0.001              0.52
Tobacco and vape stores                            0.09 (0.003)                                                    < 0.001              0.35
Tobacco-specific stores                            0.18 (0.005)                                                    < 0.001              0.40
Vape-specific stores                               0.19 (0.005)                                                    < 0.001              0.45
Non-specialized stores                             4.02 (0.04)                                                     < 0.001              0.84
Purushothaman et al. Archives of Public Health      (2022) 80:42                                                          Page 7 of 9

Table 2 Vaping population in association with tobacco retailer count by store type, California, 2019
Retailer count                                   Vaping Population Estimate (SE)                    p-value                      R2
Specialized                                      1.30 (0.03)                                        < 0.001                      0.59
Tobacco and vape stores                          0.30 (0.01)                                        < 0.001                      0.35
Tobacco-specific stores                          0.60 (0.02)                                        < 0.001                      0.47
Vape-specific stores                             0.62 (0.02)                                        < 0.001                      0.49
Non-specialized stores                           12.24 (0.15)                                       < 0.001                      0.80

another tobacco retailer reduced tobacco retail density                 available as of this date. Hence, the study may have not
in Santa Clara County [26]. Also, a case study in San                   captured the list of retailers who obtained a license dur-
Francisco observed that setting a cap on the maximum                    ing the year after the data collection, leading to possible
number of licenses can help reduce the disproportionate                 incomplete licensure data for the year. However, the
density of outlets in socioeconomically disadvantaged                   study included 22,131 licenses tobacco retail outlets,
neighborhoods [27]. These prior studies point to the                    which is representative of the complete licensure data
need for evidence-based tobacco control policies that                   for the year and thereby reduced the likelihood of inad-
can identify opportunities to reduce tobacco retail activ-              equate validity. Also, this study did not include any il-
ity and in turn smoking prevalence [28]. Further sup-                   legal tobacco and/or vape storefronts operating without
porting this conclusion, the association of tobacco retail              a license from CDTFA and did not quantify the number
density with smoking among adults has been observed                     of retail stores selling tobacco products without a li-
regardless of exposure measure in a recent systematic                   cense. Each retailer from the CDTFA listing was catego-
review [29] and a significant positive association was                  rized based on Yelp data and ability for businesses to
observed between tobacco outlet density and smoking                     self-classify [31] which may lead to misclassification bias.
behavior among adolescents in a meta-analysis of studies                Also, the store categorization based on Yelp was not
examining tobacco outlet density around homes and                       cross validated through fieldwork or phone call verifica-
schools [30].                                                           tion. Further, the analyses were not adjusted for socio-
   Hence, these findings, along with results from this                  economic and other environmental factors which may
study, may suggest that more aggressive regulation using                be associated with tobacco retailer landscape and
city zoning and licensing policies that restrict growth of              smoking behaviors. The data on vaping prevalence was
tobacco retail outlets, particularly in areas where there is            obtained from Esri’s market potential data which is a
existing or trending high tobacco retail store count or                 survey-based database on consumer use of various prod-
density, may have a positive impact on reducing tobacco                 ucts including e-cigarettes. The study did not ascertain
and vaping prevalence, though more research is needed                   the validation of this measure or the correlation between
that is small area and community specific. Identifying                  vaping prevalence and CDC’s smoking prevalence data.
potential variations in the association between geo-                    The study focused on testing the associations between
graphic retail density of specialized tobacco and/or vape               tobacco retailer count and smoking/vaping population
shops and non-specialized tobacco vendors can also help                 and should be considered hypothesis generating. Future
optimize regulatory measures aimed at reducing vaping-                  research should focus on conducting neighborhood or
related harms in communities with exceedingly high                      community specific observational studies using resolute
density relative to smoking and non-smoking population                  data differentiating vaping and smoking prevalence and
size.                                                                   individual tobacco retailer data including those selling
                                                                        without licenses taking into consideration sociodemo-
Limitations                                                             graphic factors influencing the tobacco retail landscape.
This is an ecological study exploring the association be-
tween smoking/vaping population and tobacco retailer                    Conclusions
count for different store types and hence the results can-              Though exploratory, results from this study can help in
not be attributed to individuals. This study used the                   formulating evidence-based tobacco control policies fo-
publicly available CDTFA listing of licensed tobacco re-                cused on scrutinizing and ultimately reducing tobacco
tailers and did not include individuals (sole proprietors,              retail activity on the basis of tobacco-related health
husband and wife co-owners, and domestic partners)                      harms in communities that have high retail density and
who are registered with, or hold licenses or permits                    tobacco/vape product availability and use. Findings can
issued by the CDTFA, per Civil Code Sect. 1798.69(a) of                 also extend to assessing the potential utility of more
the Information Practices Act. The data was collected in                progressive retail restriction policies, including possibly
May 2019 and included licensed tobacco retailers                        extending permitting restrictions in high-risk areas (e.g.,
Purushothaman et al. Archives of Public Health (2022) 80:42 Page 8 of 9
further prohibiting licenses/permits near schools, parks, - United States, 2011-2018. MMWR Morb Mortal Wkly Rep [Internet]. 2019
colleges/universities, etc.) or ensuring that retail density Feb 15 [cited 2020 Mar 7];68(6):157–64. Available from: http://www.ncbi.nlm.
nih.gov/pubmed/30763302.
and availability does not exceed a certain threshold. To- 4. QuickStats. Cigarette Smoking Status* Among Current Adult E-cigarette
bacco regulatory science should also take into account if Users,† by Age Group — National Health Interview Survey,§ United States,
different licensure schemes are appropriate for different 2015. MMWR Morb Mortal Wkly Rep [Internet]. 2016 Oct 28 [cited 2021 Mar
31];65(42):1177. Available from: http://www.cdc.gov/mmwr/volumes/65/wr/
retail outlet categories, including experimenting with mm6542a7.htm.
measures to reduce appeal and uptake generated by spe- 5. Department of Public Health C. Tobacco Control Program C. California
cialized stores and limiting convenience and access from Tobacco Facts and Fig. 2021. [cited 2021 Dec 21]; Available from: https://
www.cdph.ca.gov/tobacco.
non-specialized stores. 6. Cantrell J, Huang J, Greenberg M, Willett J, Hair E, Vallone D. History and
Current Trends in the Electronic Cigarette Retail Marketplace in the United
Abbreviations
States: 2010-2016. Nicotine Tob Res [Internet]. 2021 Jan 1 [cited 2021 Mar
API: Application Programming Interface; CDC: Centers for Disease Control
31];22(5):843–7. Available from: https://pubmed.ncbi.nlm.nih.gov/30312465/.
and Prevention; CDTFA: California Department of Tax and Fee
7. Moritz ED, Zapata LB, Lekiachvili A, Glidden E, Annor FB, Werner AK, et al.
Administration; DBA: Doing Business As; MPI: Market Potential Index
Update: Characteristics of Patients in a National Outbreak of E-cigarette, or
Vaping, Product Use–Associated Lung Injuries — United States, October
Acknowledgements
2019. MMWR Morb Mortal Wkly Rep [Internet]. 2019 Nov 1 [cited 2020 Jul
Not applicable.
29];68(43):985–9. Available from: https://www.ncbi.nlm.nih.gov/pmc/articles/
PMC6822806/.
Authors’ contributions
8. Miech R, Johnston L, O’Malley PM, Bachman JG, Patrick ME. Trends in
VP, RC, and TKM jointly conceived the study. VP, JL, and MN conducted data
Adolescent Vaping, 2017–2019. N Engl J Med. 2019;381(15):1490–1491
collection and data analyses. VP, RC, and TKM jointly wrote the manuscript.
9. McCarthy WJ, Mistry R, Lu Y, Patel M, Zheng H, Dietsch B. Density of
The author(s) read and approved the final manuscript.
tobacco retailers near schools: Effects on tobacco use among students. Am
J Public Health [Internet]. 2009 Nov 1 [cited 2021 Apr 1];99(11):2006–13.
Funding
Available from: /pmc/articles/PMC2759807/.
This research was supported by the Tobacco-Related Disease Research Pro-
10. Chuang YC, Cubbin C, Ahn D, Winkleby MA. Effects of neighbourhood
gram (Awards #T29IP0465 and #T29IP0384).
socioeconomic status and convenience store concentration on individual
level smoking. J Epidemiol Community Health [Internet]. 2005;59(7):568–73.
Availability of data and materials
cited 2020 Nov 10 ;Available from: www.jech.com.
The data that support the findings of this study are available upon request
and certain data will be available freely from the website www.ghpolicy.org. 11. Current Cigarette Smoking Among Adults in the United States. | CDC
[Internet]. [cited 2021 Mar 31]. Available from: https://www.cdc.gov/toba
Declarations cco/data_statistics/fact_sheets/adult_data/cig_smoking/index.htm.
12. Yu D, Peterson NA, Sheffer MA, Reid RJ, Schnieder JE. Tobacco outlet
Ethics approval and consent to participate density and demographics: Analysing the relationships with a spatial
Not applicable. regression approach. Public Health [Internet]. 2010 Jul [cited 2020 Nov 11];
124(7):412–6. Available from: https://pubmed.ncbi.nlm.nih.gov/20541232/.
Consent for publication 13. FTC Releases Reports on Cigarette and Smokeless Tobacco Sales. and
Not applicable. Marketing Expenditures for 2018 | Federal Trade Commission [Internet]. [cited
2021 Mar 31]. Available from: https://www.ftc.gov/news-events/press-relea
Competing interests ses/2019/12/ftc-releases-reports-cigarette-smokeless-tobacco-sales-marketing.
TKM, JL, and MN are employees of the startup company S-3 Research LLC. S- 14. Map of States with Laws Requiring Licenses for Over-the-counter Sales of
3 Research is a startup funded and currently supported by the National Insti- Cigarettes (CDC STATE System Tobacco Legislation. - Licensure) | Chronic
tutes of Health – National Institute on Drug Abuse through a Small Business Disease and Health Promotion Data & Indicators [Internet]. [cited 2021 Mar
Innovation and Research contract for opioid-related social media research 31]. Available from: https://chronicdata.cdc.gov/Legislation/Map-of-States-
and technology commercialization. Author reports no other conflict of inter- with-Laws-Requiring-Licenses-for-Ove/w27g-mubb.
est associated with this manuscript. 15. Kong AY, Gottfredson NC, Ribisl KM, Baggett CD, Delamater PL, Golden SD.
Associations of County Tobacco Retailer Availability With U.S. Adult
Author details Smoking Behaviors, 2014–2015. Am J Prev Med [Internet]. 2021 Sep 1 [cited
1
Department of Anesthesiology, San Diego School of Medicine, University of 2021 Dec 21];61(3):e139–47. Available from: http://www.ajpmonline.org/a
California, La Jolla, CA, USA. 2Global Health Policy and Data Institute, San rticle/S0749379721002282/fulltext.
Diego, CA, USA. 3S-3 Research LLC, San Diego, CA, USA. 4Global Health 16. Kong AY, Zhang X. The Use of Small Area Estimates in Place-Based Health
Program, Department of Anthropology, University of California, San Diego, La Research. Am J Public Health [Internet]. 2020 Jun 1 [cited 2021 Dec 21];
Jolla, CA, USA. 110(6):829–32. Available from: https://pubmed.ncbi.nlm.nih.gov/32298183/.
17. Leas EC, Schleicher NC, Prochaska JJ, Henriksen L. Place-Based Inequity in
Received: 16 June 2021 Accepted: 12 January 2022 Smoking Prevalence in the Largest Cities in the United States. JAMA Intern
Med [Internet]. 2019 Mar 1 [cited 2021 Dec 21];179(3):442. Available from:
/pmc/articles/PMC6439705/.
References 18. King JL, Wagoner KG, Suerken CK, Song EY, Reboussin BA, Spangler J, et al.
1. Wakefield M, Germain D, Durkin S, Henriksen L. An experimental study of Are Waterpipe Café, Vape Shop, and Traditional Tobacco Retailer Locations
effects on schoolchildren of exposure to point-of-sale cigarette advertising Associated with Community Composition and Young Adult Tobacco Use in
and pack displays. In: Health Education Research [Internet]. Health Educ Res; North Carolina and Virginia? Subst Use Misuse [Internet]. 2020 Sep 23 [cited
2006 [cited 2020 Nov 10]. p. 338–47. Available from: https://pubmed.ncbi. 2021 Dec 21];55(14):2395–402. Available from: https://pubmed.ncbi.nlm.nih.
nlm.nih.gov/16702196/. gov/32969275/.
2. Ali FRM. E-cigarette Unit Sales, by Product and Flavor Type — United States, 19. Cuomo R, Yang J, Purushothaman V, Nali M, Li J, Mackey T. A geospatial
2014–2020. MMWR Morb Mortal Wkly Rep [Internet]. 2020 Sep 18 [cited analysis of age disparities in resolute localities of tobacco and vaping-
2021 Sep 28];69(37):1313–8. Available from: https://www.cdc.gov/mmwr/ specific storefronts in California. Tob Prev Cessat [Internet]. 2021 May 13
volumes/69/wr/mm6937e2.htm. [cited 2021 Jun 9];7(May):1–10. Available from: /pmc/articles/PMC8114581/.
3. Gentzke AS, Creamer ML, Cullen KA, Ambrose BK, Willis G, Jamal A, et al.
Vital Signs: Tobacco Product Use Among Middle and High School StudentsPurushothaman et al. Archives of Public Health (2022) 80:42 Page 9 of 9
20. 500 Cities Project. 2016 to 2019 | PLACES: Local Data for Better Health | CDC
[Internet]. [cited 2021 Mar 31]. Available from: https://www.cdc.gov/places/a
bout/500-cities-2016-2019/index.html.
21. Market Potential—Esri Demographics. | Documentation [Internet]. [cited
2021 Mar 31]. Available from: https://doc.arcgis.com/en/esri-demographics/
data/market-potential.htm#ESRI_SECTION1_85E3
FA50DEB04C96A58CC64674248448.
22. Census - Table Results [Internet]. [cited 2021 Mar 31]. Available from: https://
data.census.gov/cedsci/table?q=population&tid=ACSDP1Y2019.DP05.
23. Robertson L, McGee R, Marsh L, Hoek J. A Systematic Review on the Impact
of Point-of-Sale Tobacco Promotion on Smoking. Nicotine Tob Res
[Internet]. 2015 Jan 1 [cited 2021 Apr 1];17(1):2–17. Available from: https://a
cademic.oup.com/ntr/article-lookup/doi/https://doi.org/10.1093/ntr/ntu168.
24. King JL, Wagoner KG, Reboussin BA, Sutfin EL. Youth. and Young Adult
Convenience Store Behaviors: Findings from Intercept Surveys. Nicotine Tob
Res [Internet]. 2020 Nov 1 [cited 2021 Apr 1];22(11):2092–7. Available from:
https://pubmed.ncbi.nlm.nih.gov/32484515/.
25. Henriksen L, Schleicher NC, Feighery EC, Fortmann SP. A longitudinal study
of exposure to retail cigarette advertising and smoking initiation. Pediatrics
[Internet]. 2010 Aug 1 [cited 2021 Apr 1];126(2):232–8. Available from: www.
https://doi.org/10.1542/peds.2009-3021.
26. Coxe N, Webber W, Burkhart J, Broderick B, Yeager K, Jones L, et al.
Use of tobacco retail permitting to reduce youth access and exposure
to tobacco in Santa Clara County, California. Prev Med (Baltim). 2014
Oct 1;67(S1):S46–50.
27. Reducing Tobacco Retail Density in San Francisco. (2016) | San Francisco
Tobacco-Free [Internet]. [cited 2021 Dec 21]. Available from: https://sanfra
nciscotobaccofreeproject.org/case-studies/reducing-tobacco-retail-density-
in-san-francisco/.
28. Luke DA, Sorg AA, Combs T, Robichaux CB, Moreland-Russell S, Ribis KM,
et al. Tobacco retail policy landscape: A longitudinal survey of US states.
Tob Control [Internet]. 2016 Oct 1 [cited 2021 Apr 1];25(Suppl 1):i44–51.
Available from: http://tobaccocontrol.bmj.com/.
29. Valiente R, Escobar F, Urtasun M, Franco M, Shortt NK, Sureda X. Tobacco
Retail Environment and Smoking: A Systematic Review of Geographic
Exposure Measures and Implications for Future Studies. Nicotine Tob Res
[Internet]. 2021 Aug 4 [cited 2021 Dec 21];23(8):1263–73. Available from:
https://pubmed.ncbi.nlm.nih.gov/33155040/.
30. Finan LJ, Lipperman-Kreda S, Abadi M, Grube JW, Kaner E, Balassone A, et al.
Tobacco outlet density and adolescents’ cigarette smoking: A meta-analysis.
Tob Control. 2019 Jan 1;28(1):27–33.
31. Giovenco DP. Smoke Shop Misclassification May Cloud Studies on Vape
Shop Density. Nicotine Tob Res [Internet]. 2018 Jul 9 [cited 2021 Nov 26];
20(8):1025. Available from: /pmc/articles/PMC6037100/.
Publisher’s Note
Springer Nature remains neutral with regard to jurisdictional claims in
published maps and institutional affiliations.You can also read