Investor Presentation - September 2021 - Parkland Corporation
←
→
Page content transcription
If your browser does not render page correctly, please read the page content below

Investor Presentation
September 2021          1

Forward Looking Statement & Note on Non-GAAP Measures
Certain statements contained herein constitute forward-looking information and statements (collectively, "forward-looking statements"). When used the words "expect", "will", "could", "would", "believe", "continue", "pursue" and similar expressions are
intended to identify forward-looking statements. In particular, this presentation contains forward-looking statements with respect to among other things: business strategies and objectives; Parkland's value proposition and business model; Parkland’s
2021 outlook and guidance, including 2021 Adjusted EBITDA and capital expenditure guidance and H2 2021 COVID-19 recovery; Parkland's ambition to generate $2 billion of run-rate Adjusted EBITDA by the end of 2025; organic growth opportunities,
including future new-to-industry retail locations, non-fuel organic growth, including On the Run rebrands, retrofits and pilots, the JOURNIETM Rewards program, digital initiatives and growth with respect to renewable fuels, energy transition and EV
charging stations; Parkland’s focus on driving per share growth while maintaining financial flexibility; integration capabilities and potential synergies and other benefits from completed transactions (including timing to realization thereof); Parkland’s
commitment to integrating ESG across operations and strategic decision making; Parkland’s plans with respect to strategic ESG focus areas including climate change, safety and emergency preparedness, product transportation and storage, diversity
and inclusion, and governance and ethics; expectation to meet emerging customer needs in EV market; continued volume recovery; potential M&A opportunities, including with respect to geographic areas and product lines; Parkland’s U.S.
consolidation opportunity and strategy; expansion of supply infrastructure; Parkland's low carbon strategy; Parkland's capital allocation policy; and availability of capital to fund Parkland's growth ambitions.

Parkland believes the expectations reflected in such forward-looking statements are reasonable, but no assurance can be given that these expectations will prove to be correct and such forward looking statements should not be unduly relied upon.
The forward-looking statements contained herein are based upon certain assumptions and factors including, without limitation: historical trends, current and future economic and financial conditions, and expected future developments.

Parkland believes such assumptions and factors are reasonably accurate at the time of preparing this presentation. However, forward-looking statements are not guarantees of future performance and involve a number of risks and uncertainties some
of which are described in Parkland’s annual information form and other continuous disclosure documents. Such forward-looking statements necessarily involve known and unknown risks and uncertainties and other factors, which may cause
Parkland’s actual performance and financial results in future periods to differ materially from any projections of future performance or results expressed or implied by such forward looking statements. Such factors include, but are not limited to, risks
associated with: general economic, market and business conditions and the extent and duration COVID-19 pandemic and its effects on such economic, market and business conditions; Parkland's ability to execute its business strategies and achieve its
growth ambitions, including without limitation, Parkland's ability to consistently identify accretive acquisition targets and successfully integrate them, successfully implement organic growth initiatives and to finance such acquisitions and initiatives on
reasonable terms; change in demand for Parkland’s products; the ability of suppliers and other counterparties to meet commitments; the operations of Parkland businesses, including compliance with all necessary regulations; competitive action by
other companies; the ability of management to maintain the assets within the forecasted budget for capital expenditures; failure to meet financial, operational and strategic objectives and plans; failure to meet market expectations; failure to realize
anticipated synergies, accretion, growth and value creation Parkland’s acquisitions; competitive action by other companies; the ability of suppliers to meet commitments; actions by governmental authorities and other regulators including increases in
taxes; changes and developments in environmental and other regulations; ability to secure sources of funding for its anticipated acquisitions, if necessary, on terms acceptable to Parkland; failure to retain key management personnel; Parkland’s
inexperience in any of the jurisdictions in which it expands into, and the political and regulatory risks associated with certain of those jurisdictions; foreign exchange and inflation rate exposures; environmental liabilities associated with Parkland’s
business; supply economics in the jurisdictions in which Parklands operates its business; Parkland’s ability repay its indebtedness; and other factors, many of which are beyond the control of Parkland. See also the risks and uncertainties described in
"Forward-Looking Information" and "Risk Factors" included in Parkland's Annual Information Form dated March 5, 2021, in "Forward-Looking Information" and "Risk Factors" in the Q4 2020 Management’s Discussion and Analysis (“Q4 2020 MD&A”), and
in "Forward-Looking Information" in the Q2 2021 Management's Discussion and Analysis ("Q2 2021 MD&A"), each as filed on SEDAR and available on the Parkland website at www.parkland.ca.

Financial Measures

This presentation refers to certain non-GAAP financial measures that are not determined in accordance with International Financial Reporting Standards ("IFRS"). Adjusted EBITDA, total funded debt to credit facility EBITDA ratio (TTM) and net debt are
not measures recognized under IFRS and do not have a standardized meaning prescribed by IFRS and may not be comparable to similar measures presented by other issuers. See the endnotes of this presentation for a description of Adjusted EBITDA,
total funded debt to credit facility EBITDA ratio and net debt. Parkland views Adjusted EBITDA as the key measure for the underlying core operating performance of business segment activities at an operational level. Adjusted EBITDA is used by
management to set targets for Parkland (including annual guidance and variable compensation targets) and is used to determine Parkland's ability to service debt, finance capital expenditures and provide for dividend payments to shareholders.
Management uses total funded debt to credit facility EBIDTA ratio to demonstrate compliance with debt covenants and to provide users with an indication of Parkland's ability to repay debt. See Section 14 of the Q4 2020 MD&A and Q2 2021 MD&A for
a discussion of non-GAAP measures and their reconciliation to the nearest IFRS measures. Investors are cautioned that these measures should not be construed as an alternative to net earnings determined in accordance with IFRS as an indication of
Parkland's performance.

Market data and other statistical information used throughout this presentation are based on internal company research, independent industry publications, government publications, reports by market research firms or other published independent
sources. Industry surveys, publications, consultant surveys and forecasts generally state that the information contained therein has been obtained from sources believed to be reliable. Although Parkland believes such information is accurate and
reliable, Parkland has not independently verified any of the data from third-party sources cited or used for management's industry estimates, nor has Parkland ascertained the underlying economic assumptions relied upon therein. While Parkland
believes internal company estimates are reliable, such estimates have not been verified by any independent sources, and Parkland does not make any representations as to the accuracy of such estimates. Statements as to our position relative to our
competitors or as to market share refer to the most recent available data.

                                                                                                                                                                                                                                                              2
Company Snapshot Select Canadian brands
A leading fuel & convenience marketer
Enterprise value $10.5 billion
Annual Dividend $1.235/share, 3.3% yield
Fuel volume (TTM) 22 billion litres
Credit rating BB (4 agencies)
Key Operating Assets Canada USA Int’l Total
Retail Company &
2,000 525 661 3,186
Dealer sites
Select USA brands
Locally relevant
Cardlock sites 154 44 - 198 retail and
+ commercial fuel
Net refining interest brands
55 - 5 60
(mmbls/d)
Terminals, bulk plants
✓ ✓ ✓ ✓
& transloaders
Marine / Aviation ✓ ✓ ✓ ✓
Diverse geographic and product
platform across 25 countries
Retail
Commercial
Leading Canadian and International
Select Int’l brands
market share position with growing
U.S. presence
See End notes for further information TSX: PKI 3
Energy – Refining & Marketing
Our value proposition
Ambition for $2 billion of run-rate Adjusted EBITDA by the end of 2025
Annualized total shareholder return (2011 – August 31, 2021)
20% 17%
Proven track record of growth
15% Parkland
S&P 500
Multi-channel marketing capability with
difficult to replicate assets 10%
S&P TSX
Diversified and resilient business model 5%
S&P TSX
Energy
Deep pipeline of organic opportunities 0%
Established acquisition & integration -5%
capabilities Annualized dividend history ($/share) 3.3%
dividend yield
1.25
Opportunities in the energy transition 1.20 Consistent and measured
dividend growth through
Significant financial flexibility and 1.15 various market cycles
(9 consecutive annual increases)
prudent capital allocation 1.10
1.05
1.00
0.95
2011 2021
See End notes for further information 0.90 4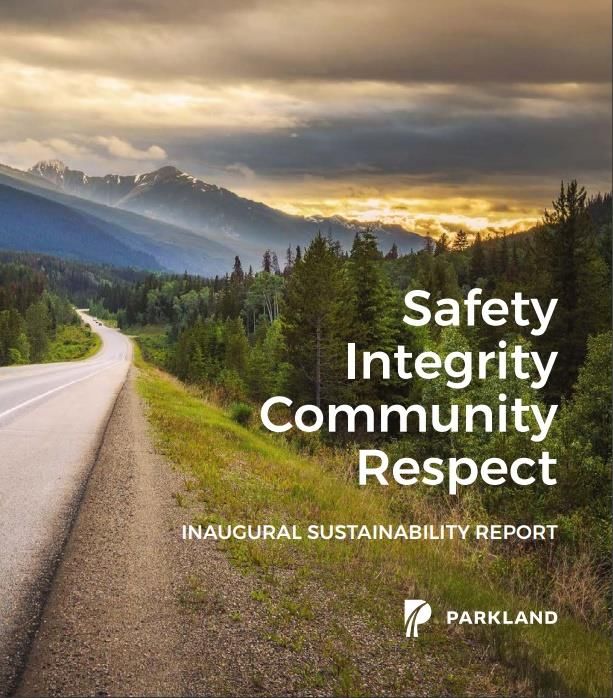
Multi-channel marketing capability
Capturing economics across the value chain and coming to market through retail, commercial & wholesale channels

   Manufacture and purchase                         Source the most                     Optimize internal and external
       refined products                            economic product                            customer base
  Enhance margins by leveraging scale               through market insight,          Supply our own network and drive incremental
        and product diversity                 transportation and storage capacity       economics through wholesale channel

              Make/Buy                                   Move/Store                                      Sell

                                                       Truck            Ship                   Wholesale        Commercial

           Refined Product

                                                        Rail            Store
                                                                                                           Retail

                                                                                                                                    5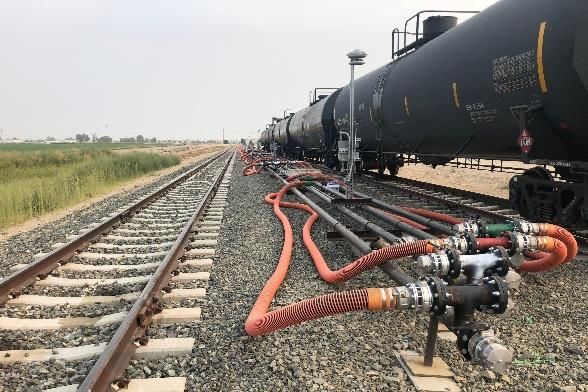
Track record of significant growth
A regional consolidator of the Americas with a robust set of opportunities to increase our size and scale

Adjusted EBITDA, $ millions
                                                                                                          Ambition for
    2,000                                                                                                 $2 billion of
                                                                                                       run-rate Adjusted
                                                                                                         EBITDA by the
                                                                                                          end of 2025

     1,500

     1,000

                   Our strategy has iterative benefits:
                Lock-in demand organically and through
                   acquisitions, then optimize supply                                                       $1.25
      500                                                                                                  billion
                                                                                                           +/- 5%
                                                                                          Impacted
                                                                                         by COVID-19       Expect
                                                                                          and 2020         H2 2021
                                                                                           refinery       COVID-19
                                                                                         turnaround       recovery
         0
                2014            2015                 2016           2017   2018   2019     2020           2021              2025
                                                                                                        Guidance           Ambition
                            See End notes for further information                                                                     6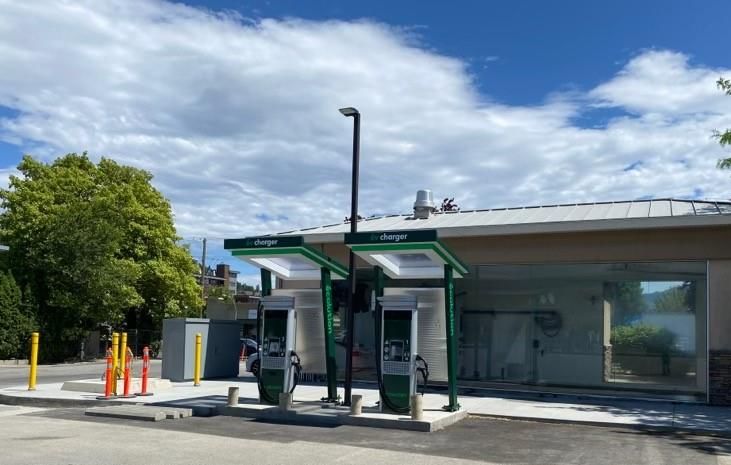
A consistent, disciplined and focused strategy
Focus areas

             Grow organically                                           Strong supply advantage     Acquire prudently and integrate

  • New-to-industry retail locations                               • Renewable fuel development   • Progress long-term growth
                                                                     (co-processing)                ambition
  • On the Run rebrands and retrofits
                                                                   • Midwest LPG                  • Synergy capture (Sol and U.S.)
  • JOURNIE™ Rewards
                                                                                                  • PNW expansion opportunities
  • National accounts                                              • Biodiesel blending
                                                                                                  • International (LPG, aviation, new
  • Digital initiatives                                            • Environmental compliance       markets)
  • LPG, branded low carbon fuel                                     products marketing
    & EV pilots
                                                                   • Eastern Canada marine
                                                                     and rail import

                           See End notes for further information                                                                        7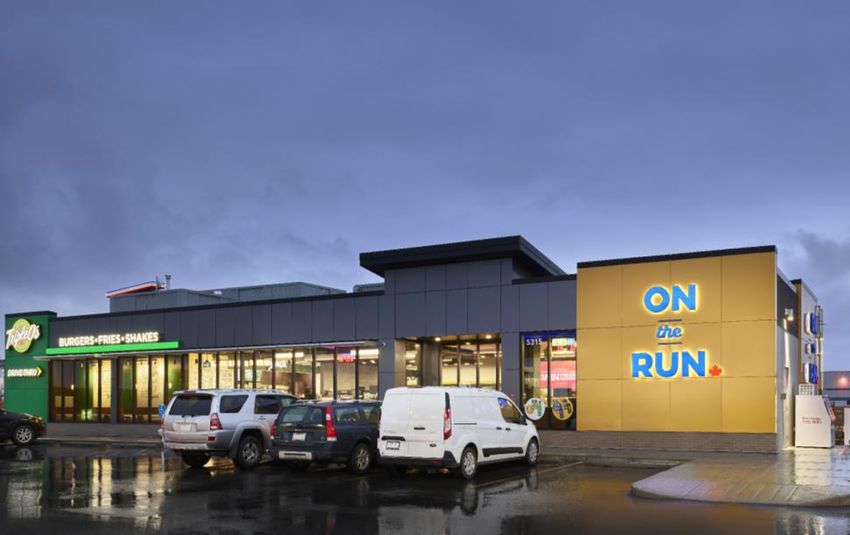
Proven track record of acquisitions and integration
Depth of high-quality consolidation opportunities across all our geographies

Entry into the U.S.                              C-store brand                                     Doubled U.S. run-rate                          Growing through COVID-19

2014                  2015                       2016                    2017                      2018                    2019                   2020                 2021+

                      Ontario Expansion                                  Quebec & B.C. expansion                           Caribbean & S.E. U.S                         Disciplined and
                                                                                                                                                                        strategic acquisitions

                                 See End notes for further information                                                                                                                     8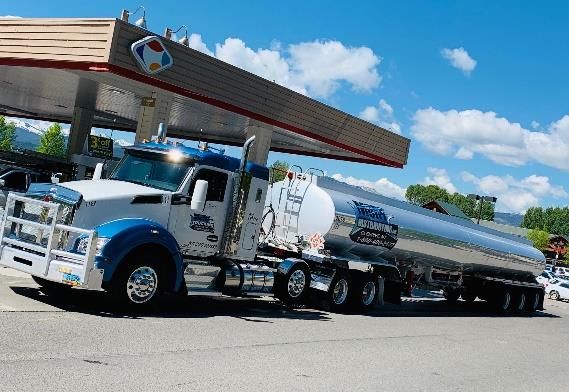
Adding incremental value to acquired assets
Disciplined approach; buying complex portfolios in supply-inefficient markets

Our expertise provides unique opportunities                                    Proven framework for synergy realization
                                                                               (Stated acquisition multiple versus multiple post synergy capture)

                                                              PKI Sweet Spot

                                                                                                Purchase                                            ~7.0x
                                                                                 Average
                                                                                 for below      After Synergy Capture               ~5.0x
                                                                                 transactions

                                                                                                Purchase

                                                                                                After Expected Synergy Capture

                                                                                                Purchase

                                                                                                After Synergy Capture
           Simple portfolios    Complex portfolios
  Supply inefficient markets    Supply inefficient markets
                                                                                                Purchase
          Simple portfolios     Complex portfolios                                              After Synergy Capture
   Supply efficient markets     Supply efficient markets

                               See End notes for further information                                                                                    9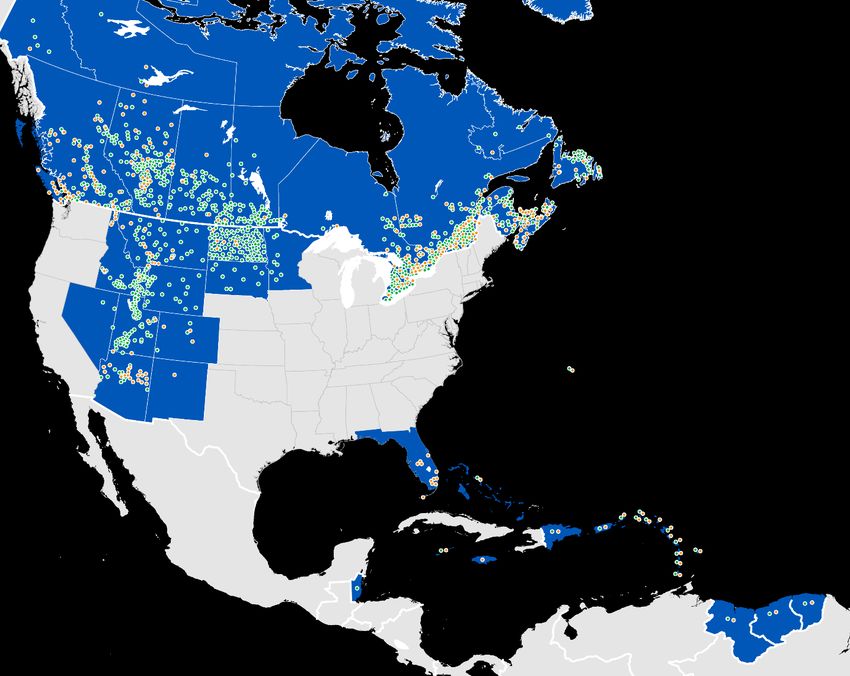
Realizing our growth ambition, one acquisition at a time
Focused on driving per share growth while maintaining financial flexibility
Acquisition history Active acquisition pipeline since Q3 2020
($ millions)
$3,000
Immediately accretive to distributable cash flow
$2,500 per share; expected to be approximately 8
$2,000
Approx. $800 percent accretive post-synergies
$1,500 million of
acquisitions
$1,000 announced
Acquisition In-line with our stated strategy
$500
1 Sevier Valley Oil Company Inc. Expands retail presence in southern Utah
$0
2016 2017 2018 2019 Q1-Q3 Since Q3 2 Carter Oil Company Inc. Complements existing Utah and Arizona operations
2020 2020 3 Story Distributing Company Retail scale and density to Northern Tier ROC
Total Funded Debt to Credit Facility EBITDA 4 Midwest U.S. LPG Terminals Expand integrated logistics business
4.0x 5 St. Maarten LPG Supports International LPG growth
3.0 6 Conrad & Bischoff Inc. Establishes new ROC in the PNW; retail and supply
3.0x
7 Puerto Rico Aviation Expands presence in busy Caribbean airports
2.0x
8 St. Maarten fuel marketer Integrated business with core retail and aviation assets
9 Isla Dominicana de Petroleo Corp. Creates the largest retail network in the DR
1.0x 10 Petroles Crevier Inc. Expands QC retail presence & strengthens supply advantage
11 Master Petroleum Expands commercial business in Rockies ROC
0.0x
Q3 Q4 Q1 Q2 Q3 Q4 Q1 Q2
12 Red Carpet Carwash Quality retail & carwash business in Northern Tier ROC
2019 2019 2020 2020 2020 2020 2021 2021
See End notes for further information 10Maintaining our strong balance sheet to fund growth
Significant financial flexibility
Credit Facility and Senior Notes Maturity Ladder
($ millions)
Capital allocation policy
$1,800 Canadian Bonds US Bonds Credit Facility
Fundamental
Primary Secondary
expectation
$1,500 Resilient asset base Organic growth & Deleveraging and
and balance sheet acquisitions distribution growth
$1,200
Q2 2021
$900 Total Funded Debt to
3.0x
Credit Facility EBITDA Ratio
Corporate Credit Rating BB Stable
$600
No senior note
Liquidity $1.8 Billion
maturities until 2026
$300
Cash generated from operating activities $322 million
$0
2021 2022 2023 2024 2025 2026 2027 2028 2029
See End notes for further information 11Our sustainability journey
Committed to integrating ESG across our operations
and in our strategic decision making
Established a Board-level Environmental, Social &
Governance ("ESG") committee and executive-led
Sustainability Task Force in 2019
Inaugural report published September 30, 2020
• Incorporates Sustainability Accounting Standards
Board (SASB), Global Reporting Index (GRI) and Task
Force on Climate-related FinancialOperating
Disclosures (TCFD)
methodologies Costs
Committed to integrating ESG across our operations and in
our strategic decision making
“At Parkland, sustainability means providing our customers
with safe, reliable energy and products they need today, while
making strategic decisions and innovative investments that
contribute to a lower carbon future.”
- Bob Espey, President & CEO
12Inaugural report: 5 key strategic ESG focus areas
Engaged with third-party experts and stakeholders across our business in developing our materiality assessment
Product
Safety & Emergency Diversity & Governance &
Climate Change Transportation
Preparedness Inclusion Ethics
& Storage
What we’re doing What we’re doing What we’re doing What we’re doing What we’re doing
• Low carbon leadership • Culture of safety • Spill prevention, awareness • D&I council • Anti-corruption and ethics
and response policies
• Helping our customers • Emergency response and • Policies and commitments
switch to low carbon fuels management systems • Fuel transport • Board governance
• Community representation
• Reducing our carbon • HSE & compliance training • Product storage and engagement • Sustainability governance
footprint
• Community engagement • Community support
Highlight Highlight Highlight Highlight Highlight
Equivalent of 15,000 cars Overall decline in Total Zero significant spills Initiated enterprise-wide, Formation of Board-level ESG
taken off the road through Recordable Injury Frequency executive-led Diversity & Committee to guide
the production of renewable, (TRIF) to 1.52 in 2019. Further Inclusion Council. Recently sustainability governance
low carbon fuels. 2021 co- decline in TRIF to 1.12 in formalized gender D&I
processing target is the 2020. targets for Board and Execs
equivalent of approx. 80,000
cars off the road.
These areas represent our most material topics and are important
to the long-term success of our business
13Q2 2021 Business update
Strong second quarter results and continued progress toward our long-term growth ambitions
Strong performance & volume recovery Growth program on track BC’s largest ultra-fast EV network
• Q2 2021 Adjusted EBITDA up 69 • $800 million of acquisitions since • A natural extension of our energy
percent from Q2 2020 Q3 2020, organic growth continues transition leadership in British
Columbia
• Continued volume recovery and • Acquisitions are accretive to
organic growth across our portfolio distributable cash flow per share • Positioned to serve customer
• Increased 2021 Adjusted EBITDA • Underpinned by balance sheet demand in emerging B.C. EV market
Guidance range strength
Kelowna, BC
14Q2 2021 financial results summary
Three and six months ended June 30, 2021
Adjusted EBITDA attributable to Parkland Recovering Canadian volumes
$ millions Canada Retail fuel and petroleum product volume (litres, millions)
Strong execution, robust margins 700
and increasing volumes $661
$636
97 percent Burnaby composite
utilization; 2020 included a 600
scheduled turnaround
Improving macroeconomic Supply 500
backdrop
$382 400
$346
$322 Start of
COVID
2019
300
Closing the gap to 2019 2020
Supply
levels as volumes recover 2021
$191 200
Marketing
100
Marketing
-
Q2 2019 Q2 2020 Q2 2021 Q2 YTD Q2 YTD Q2 YTD Jan Feb Mar Apr May Jun Jul Aug Sep Oct Nov Dec
2019 2020 2021
See End notes for further information 15Creating food and convenience destinations
Data and analytics driving increased value from merchandise offer
Development of data and analytics
capabilities are fundamental in how we
manage and improve performance
Proven retail capabilities and execution
paired with a compelling customer value
proposition
Canada convenience store gross profit
($ millions)
+21%
70
60
50
+26%
40
30
20
10
0
Q2 2020 Q2 2021 Q2 YTD Q2 YTD
2020 2021
See End notes for further information 16Opportunity in the energy transition
Advancing our sustainability journey
Preliminary 25 sites stretching from Vancouver Island
to Calgary, with up to 100 charging ports
• Anchored on high-quality locations with established
traffic patterns
B.C. leads Canada in EV penetration
• Our network is well-suited to meet emerging
customer needs
Primary objectives: learn, refine, scale
• Our network is well-suited to meet emerging
customer needs
See End notes for further information 17Strong performance, volume recovery & confidence in H2
Updates to 2021 guidance
Increased 2021 Adjusted EBITDA Guidance range
by $50 million; now at $1.25 Billion +/- 5%.
Reduced 2021 capital expenditure guidance
range by $50 million; now at $350 – $500 million.
Advancing strategy through consistent execution,
strengthening our supply advantage and
disciplined, accretive acquisitions.
See End notes for further information 18Appendix
Segment
overview
19Canada – diverse portfolio of fuel, convenience & cardlock
Large network of gas stations & convenience
stores, over the road and delivered diesel, propane,
heating oil and lubricants
Approx. 85 percent of the population lives within a
15-minute drive of our retail sites
Multi-brand retail and commercial forecourt
strategy with a unified backcourt offer
Approximately 8.7 billion litres fuel and petroleum
product volume (TTM)
Key Operating Assets Canada
Company retail sites 687
Dealer retail sites 1,313
Total retail service stations 2,000
Select Canadian brands
Commercial cardlock sites 154
Net refining interest (mmbls/d) 55 Commercial branches & Cardlock network
Company Retail
Terminals, bulk plants & transloaders ✓ Dealer Retail
Marine / Aviation ✓
Pro forma transactions closed subsequent to Q2 2021
See End notes for further information 20International – a platform for future growth
Select International brands
Integrated supply chain & extensive distribution
network throughout 23 countries in the
Caribbean and South America
Retail, commercial, aviation, import terminals,
pipelines, marine berths and charter ships
45% of onshore volumes have regulated margins
Approximately 4.8 billion litres fuel and
petroleum product volume (TTM)
Key Operating Assets International
Company retail sites 360
Dealer retail sites 301
Retail service stations 661
Import terminals 34
Marine facilities 28
Aviation facilities 14
Net refining interest
5
(non-operated, mmbls/d) In Q1 2019 Parkland purchased 75% of Sol Investments Limited with a put/call option for the remaining 25% stake in
Pro forma transactions closed subsequent to Q2 2021 SOL starting in 2022. The put/call option is based on Sol's contractually-defined trailing twelve-month adjusted EBITDA,
multiplied by 8.5, and including other adjustments as defined in the Sol Business Combination Agreement.
See End notes for further information 21USA – growing portfolio of wholesale and retail
Network of retail and commercial gas/diesel stations
Delivers bulk fuel, lubricants and other related
products and services
Four regional operations centers (“ROC”) in the PNW,
Northern Tier, Rocky Mountains & Southeast
Approximately 3.7 billion litres fuel and petroleum
product volume (TTM)
Key Operating Assets USA
Company retail sites 113
Dealer retail sites 412
Retail service stations 525
Commercial cardlock sites 44
Net refining interest (mmbls/d) - Select USA brands ROC
Locally relevant Distribution
Terminals, bulk plants & transloaders ✓ retail and
+ commercial
Retail
fuel brands Commercial
Marine / Aviation ✓
Pro forma transactions closed subsequent to Q2 2021
See End notes for further information 22U.S. consolidation opportunity
Significant runway for growth in retail, commercial and wholesale
What we are looking for
Markets with strong underlying growth
Complex portfolios with integrated assets
Supply inefficient markets
U.S. convenience store composition by chain size
Approx. 80% of convenience stores sell motor fuel
Source: Goldman Sachs Global Investment Research, NACS State of the Industry Report of 2019 Data
1 -10 store
chains
65%
11 - 100 store
chains
10%
Existing operations
Select areas for potential expansion
101 - 500 store
chains
Currently have < 2% market share across 5%
existing regional operating centers (“ROC’s”)
500+ store
chains
20%
See End notes for further information 23Supply - proprietary assets, supply
flexibility, and logistics & trading
capability
Optimizes Parkland’s fuel supply and logistics
Manages supply contracts with other refiners
Rail and truck logistics including distribution storage
Includes the 55,000 bbl/d refinery in Burnaby, British Columbia
Wholesale
Truck
Ship Store Commercial
Refined Product
Rail Retail
24Overview of Parkland’s supply system
A broad set of capabilities to execute our strategy
Pre 2017 Supply Footprint Current Supply Footprint
Fort Fort St.
St. John John Inuvik LPG
Grand Grand
Prairie Prairie
Burnaby
TMPL
Refinery
Bowden Bowden
Rail to Rail to
Ontario Ontario
Montreal
Montreal
Northern Tier
PNW Terminal Northern Tier
Transloading Hamilton &
Operations Transloading
Milton
New York
LPG Harbor
Rockies
Transloading
NW Europe &
LPG Florida Mediterranean
Distribution
Product from Caribbean
USGC Arabian Gulf
See End notes for further information 25Burnaby refinery overview
Tightly integrated into Parkland’s marketing
businesses in British Columbia
55,000 bbl/d nameplate capacity (light sweet refinery)
Approximately 85% of output services Parkland’s own retail and
commercial network in British Columbia
Provides approximately 15% of Parkland’s total supply needs and
effectively all our British Columbia supply needs
Indicative refinery yield
Inputs Outputs
Motor Gasoline
Edmonton Par (MSW) (60%)
80%
Diesel
(20%)
Syncrude Jet Fuel
(20%) (20%)
See End notes for further information 26Burnaby refinery dynamics
A strategic asset within our portfolio with stable and robust refining margins well positioned for long term profitability
Indicative 5-3-1-1 Burnaby Crack Spread Pathways to compliance with B.C.’s LCFR
Indexed vs. rolling 3-year average @ 100 Able to fulfill compliance obligations more economically
250% Western U.S. West Initial Economic
Composition of
compliance inputs
Canadian Coast COVID-19 Recovery
Differential Outages impacts
widening 100%
200% HDRD HDRD
No technical blend limit
75%
150% HDRD 3x cost of diesel
Co-processing 2/3 cost of HDRD
Co-
processing
50%
100%
50% 25% Ethanol Ethanol Technical blend limit
& &
Bio diesel Bio diesel Slight premium to product cost
0% 0%
Typical Parkland
Compliance Compliance
Pathways Pathways
See End notes for further information 27End notes
Adjusted EBITDA is a non-GAAP financial measure and measure of segment profit as outline in Section 14 of the Q2 2021 MD&A Slide 18
See press release dated August 5, 2021, for additional discussion regarding our updated 2021 guidance.
TTM means “trailing-twelve-months”.
Data as of Q2 2021 unless otherwise indicated. Slide 20
Location counts for Q2 2021 pro forma includes the Crevier Transaction announced on July 6, 2021 (expected to close in Q1 2022). See press
Slide 3 releases with that date for additional details.
Enterprise value is market capitalization (as at August 31, 2021, closing price and shares outstanding as of Q2 2021) plus Net debt as at Q2 2021.
Net debt is defined as total long-term debt plus accounts payable and accrued liabilities, dividends declared and payable and income taxes Slide 21
payable, less cash and cash equivalents, income taxes receivable and accounts receivable. TTM fuel and petroleum product volume as of Q2 2021. Location counts for Q2 2021 pro forma includes the International transactions announced in Q2 2021 but closed subsequent to quarter end. See
Dividend yield is based on closing price as of August 31, 2021. press release dated August 5, 2021 for additional details. Marine facilities includes marinas and jetties.
Key operating assets as at Q2 2021 and pro forma with respect to the company retail, dealer retail, wholesale and commercial marketing assets Slide 22
acquired from the Pétroles Crevier Inc. in the transaction (the “Crevier Transaction”) announced on July 6, 2021 (expected to close in Q1 2022) and Location counts for Q2 2021 pro forma includes the U.S. transactions announced subsequent to quarter end. See press release dated August 5,
additional acquisitions announced as part of our Q2 2021 results on August 5, 2021. See press releases with these dates for additional details. 2021 for additional details.
Slide 4 Slide 23
Annualized total shareholder return per Bloomberg, shown in local currency. Annual dividend history displays the annual dividend as of Market share data based on Parkland’s annualized fuel and petroleum product volume for Q2 2021 relative to the most recent state energy
December 31 of the given year. consumption estimates available from the U.S. Energy Information Administration (EIA).
Source: https://www.eia.gov/state/seds/sep_use/notes/use_print.pdf
Slide 6
See press release dated March 4, 2021, for further details regarding our original 2021 outlook and guidance, and press release dated August 5, Population data are the annual estimates of the resident population for the United States, Regions, States, and Puerto Rico: April 1, 2010, to July 1,
2021, for further details regarding our updated 2021 guidance. See press release dated May 3, 2021, for further details regarding our ambition for 2019. Source: U.S. Census Bureau, Population Division, and Stats Canada (https://www150.statcan.gc.ca/n1/en/pub/91-215-x/91-215-x2020001-
$2 billion of run-rate Adjusted EBITDA by the end of 2025. eng.pdf?st=7BZPR7yS)
Slide 7 Map is illustrative of select potential growth opportunities of the USA segment. Expansion into such regions is dependent on several factors,
See press release dated March 4, 2021, for further details regarding our original 2021 outlook and guidance, and press release dated August 5, including, without limitation identifying suitable acquisition targets and negotiating terms with sellers acceptable to Parkland, the timing of
2021, for further details regarding our updated 2021 guidance. which in uncertain and may not occur. See Parkland’s Annual Information Form for risk factors and uncertainties with respect to acquisitions,
M&A and Parkland’s growth strategy.
Slide 8
Synergy capture for the Sol acquisition reflects our 20% target of $42 million of annual run-rate synergies by the end of 2021. Synergy capture Slide 25
figures for the Chevron and Ultramar acquisitions in 2017 reflect annual run-rate synergies delivered of $180 million, which was achieved by the Map shows a combination of owned and leased supply assets.
end of 2019.
Slide 26
Slide 9 Burnaby refinery details are approximate based on normal operating conditions. Refinery yield is illustrative in nature and can serve as a
Not an exhaustive list of our acquisition history. The Crevier Transaction was announced on July 6, 2021 and is expected to close in Q1 2022. reasonable proxy for the Burnaby refinery product yield under normal operations. Actual refinery yield may differ.
Slide 10 Slide 27
Acquisition history includes the transaction announced on May 17, 2021, whereby Sol Investments SEZC (“Sol”) will become a 50 percent indirect While not the actual crack spreads experienced by our Burnaby Refinery, the 5-3-1-1 Generic Vancouver Crack spread can serve as a reasonable
partner in Isla Dominicana de Petroleo Corp. ("Isla"). proxy for the Vancouver Crack and should provide investors with a reasonable benchmark for comparison to their own crack spread
computations. The index plots historical values against the rolling three-year average marked as 100 percent on the chart. Illustrative proxy for
Expected accretion to distributable cash flow per share also reflects Adjusted EBITDA expectations plus anticipated tax expense, maintenance generic Vancouver Crack Spread is based on Supply of 5 barrels of crude (4 barrels of Edmonton Light and 1 Barrel of Syncrude) plus
capital expenditures, additional interest expense and other adjusting items. This is calculated relative to weighted average shares outstanding in transportation costs); Products are Vancouver Rack pricing for 3 barrels of gasoline and 1 barrel of diesel plus 1 barrel of Jet fuel (L.A.). Source:
the trailing twelve-month period ending June 30, 2021, plus pending equity issuance as part of the Crevier Transaction consideration. Expected Bloomberg. Bloomberg codes: CL1 Comdty, USCREMSW Index, USCRSYNC Index, MOGPV87R Index, CRUMVNAG Index, JETFLAPL Index
accretion metrics are based on assumptions regarding business performance and synergies which are not guaranteed to occur.
Pathways to meet British Columbia Low Carbon Fuel Requirements (LCFR) have varying costs that can change at any given time. Cost of Ethanol,
Slide 11 B100, HDRD and Co-processing are illustrative in nature and use internal cost forecasts as of August 5, 2021. These are subject to change based
Senior note maturity ladder reflects the estimated principal amount of repayments in Canadian dollars. See note 6 of the Q2 2021 financial on market factors. B.C. LCFR Compliance increases every year by approximately 1.25% to achieve a targeted 20% reduction by 2030 relative to a
statements for additional detail. 2014 baseline. See Source: https://www2.gov.bc.ca/gov/content/industry/electricity-alternative-energy/transportation-energies/renewable-low-
carbon-fuels/fuel-supplier-compliance-50005 and https://www.bclaws.gov.bc.ca/civix/document/id/complete/statreg/394_2008_pit#pit18 for
Slide 15 additional details.
“Marketing” is a summation of the Canada, USA and International segments. The Corporate segment has been allocated pro rata.
Non-GAAP Financial Measures and KPIs
Slide 16 See section 14 of the Q2 2021 MD&A for more information, including for reconciliations of non-GAAP measures to the nearest GAAP measure.
Canada convenience store gross profit references convenience store non-fuel adjusted gross profit as outlined in section 14 of the Q2 2021 MD&A.
Total Funded Debt to Credit Facility EBITDA Ratio (TTM): This metric represents the total funded debt as a percentage of Credit Facility EBITDA
Slide 17 (as defined in Parkland’s credit agreements). It is calculated using the TTM results as follows: (Senior funded debt + Senior notes) / Credit Facility
Site locations are preliminary and are subject to change based on final cost assumptions and infrastructure requirements. EBITDA.
28You can also read