ASHLAND FOR ALL PHASE I HPP UPDATE - Full Plan Report
←
→
Page content transcription
If your browser does not render page correctly, please read the page content below
ASHLAND
                                                                                  FOR ALL
                                                                                       PHASE I
                                                                                     HPP UPDATE
                                                                                       Full Plan Report

                                                                                Prepared for the Town of Ashland by the
An update to the Town of Ashland’s Housing Production Plan (HPP)                Metropolitan Area Planning Council (MAPC)

Presented for adoption to the Ashland Select Board and Ashland Planning Board
on May 19, 2021.

Adopted by the Ashland Select Board and Ashland Planning Board on ####.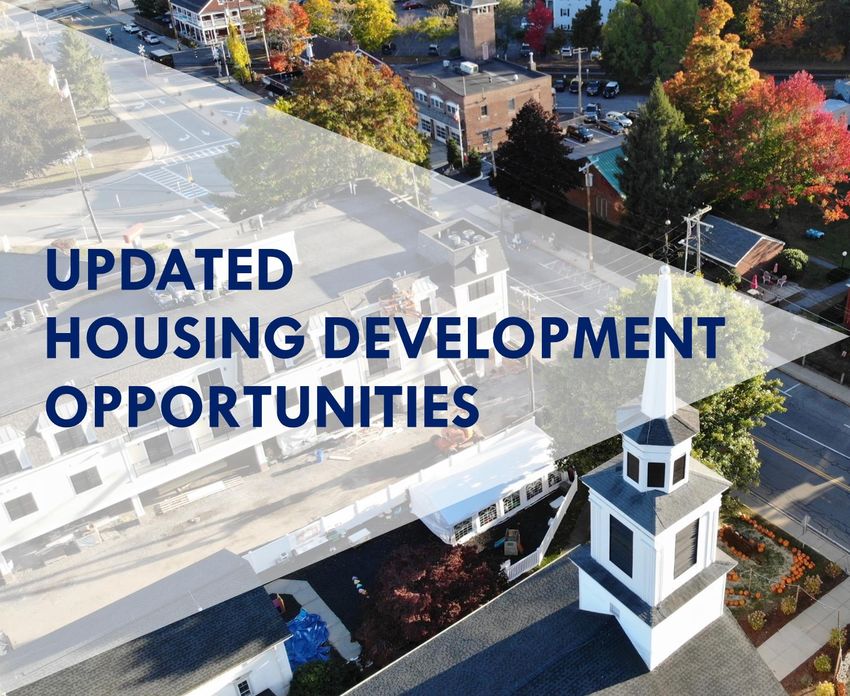
ACKNOWLEDGEMENTS
Prepared for                                            Prepared by
Town of Ashland                                         Metropolitan Area Planning Council
101 Main Street,                                        60 Temple Place
Ashland, MA 01721                                       Boston, MA 02111
https://www.ashlandmass.com/                            www.mapc.org

Contact: Peter Matchak, Town Planner/Director of Planning, Town of Ashland

This plan was created for, and in large part by, the people of Ashland. Developing the plan
would not have been possible without the support and leadership of Town Planner Peter
Matchak, Assistant Town Planner Emma Snellings, Town Manager Michael Herbert, and the
members of the Steering Committee, who contributed their time and vital knowledge of
Ashland and its housing needs:

Ashland HPP Update Steering Committee        MAPC Staff:
Members:                                     Professional support from MAPC staff was
• Ron Etskovitz, Board of Health             provided by:
• Steve Greenberg, Affordable Housing        • Alex Koppelman, AICP: Regional Housing
   Trust                                        and Land Use Planner II
• Tricia Kendall, Planning Board             • Josh Fiala, AICP: Principal Planner
• Brandi Kinsman, Select Board               • Alyssa Kogan: Regional Data Analyst
• Aaron Ladd, Community Preservation         • Christian Brandt, AICP: Planner &
   Committee                                    Community Engagement Specialist I
• David Rosenblum, Affordable Housing        • Iolando Spinola: Community Engagement
   Trust                                        Specialist
                                             • Daniel Koff: Regional Arts and Culture
Thanks also to the Ashland Select Board and     Planner
Ashland Planning Board for their input,      • Whitney Plummer: Land Use and
participation, and support in this planning     Economic Development Intern
process. Appreciation is also due to the
Ashland community, who participated in
                                             Metropolitan Area Planning Council Officers:
focus groups and public forums and provided
                                                • President: Erin Wortman, Town of
the perspective and ideas that grounded this
                                                    Stoneham
plan.
                                                • Vice President: Adam Chapdelaine,
Funding was provided by the Community               Town of Arlington
Compact Cabinet, the Town of Ashland, and       • Secretary: Sandra Hackman, Town of
the Metropolitan Area Planning Council              Bedford
(MAPC)’s District Local Technical Assistance    • Treasurer: Sam Seidel, Gubernatorial
Program (DLTA).

                                                                                          1
TABLE OF CONTENTS
1 Acknowledgements
2 Table of Contents
3 List of Figures and Tables

Introduction                          Updated Housing Development
                                      Opportunities
4 Housing Terms and Concepts
6 Introduction to the HPP Update      46 Updated Housing Development
8 Ashland Today                          Opportunities

Update Housing Needs                  Housing Best Practices
Assessment
                                      54 Housing Best Practices
10 Key Findings and Trends
                                      Appendices
Public Engagement and Plan
Input                                 57 Appendix A: Ashland Subsidized
                                         Housing Inventory
25 Public Engagement and Plan Input   58 Appendix B: SHI Targets and Safe
                                         Harbor Pathways
Updated Housing Development           60 State Bedroom Mix Policy
Constraints                           61 2015 HPP Existing Municipal Housing
                                         Strategies
26 Updated Housing Development
   Constraints

Updated HPP Recommendations
37 Updated HPP Goals
42 HPP Priority Policy Strategies

                                                                            2
LIST OF FIGURES AND TABLES
Figures
Figure 1: Percent Population by Age,                      Figure 13: Cost Burdened Households by
2010-2018 ........................................13      Age, 2018 ..........................................21
Figure 2: Population by Age, 2018 ..13                    Figure 14: Cost Burdened Households by
                                                          Income, 2015 ....................................21
Figure 3: Household Income Distribution,
2012 and 2018 ................................14          Figure 15: FY2020 Income Limits for
                                                          Affordable Housing ...........................22
Figure 4:
Race and Ethnicity (2014-2018) .....15                    Figure 16: Income-Eligible Households by
                                                          Household Type, 2015 .....................22
Figure 5: Ashland Housing Radar ....16
                                                          Figure 17: Income-Eligible Households,
Figure 6: Housing Units by Type .......16                 2015 ..................................................23
Figure 7:                                                 Figure 18: 2015 HPP Goals, Ranked by
Housing Tenure, 2012 vs. 2018 ......17                    Public Forum I Participants ..............37
Figure 8: Housing Tenure by Year of                       Figure 19: Input on Draft Priority
Building Construction .......................17           Strategies, Public Forum II ...............42
Figure 9: Median Rent, Ashland and                        Figure 20: Zoning Districts in Development
Context Communities, 2018 ............18                  Opportunity Areas 1-3 .......................46
Figure 10:                                                Figure 21: Zoning Districts in Development
Median Residential Sale Prices, Ashland                   Opportunity Area 4 ............................46
and Context Communities, 2018 .....19
                                                          Figure 22: Total Initial Parcels Evaluated
Figure 11: Median Home Sale Prices,                       for Development Opportunities ........47
2010-2019 ........................................19
                                                          Figure 23: Housing Development
Figure 12: Housing Cost Burden by                         Opportunity Types .............................49
Tenure, 2018 ....................................20

Tables
Table 1:                                                  Table 4: Development Opportunity
HPP Public Engagement Events .......25                    Analysis-Primary Parcels ...................48
Table 2:                                                  Table 5:
Principal Use Regulations.................26              Development Opportunity Types ......48
Table 3: HPP Updated Priority Policy                      Table 6: Housing Type Definitions,
Strategies ..........................................43   Characteristics, and Public Input .....51
                                                          Table 7: HPP Best Practices .............54

                                                                                                                      3
HOUSING TERMS AND CONCEPTS
This glossary briefly defines housing terms and concepts that are used in this plan to
describe Ashland’s housing need.

Cost Burden
A household is considered cost burdened when it
spends more than 30% of its income on housing.
When a household spends more than 50% of its
income on housing, its considered extremely cost
burdened.

Naturally Occurring Affordable Housing (NOAH)
Housing that tends to be affordable (30% of household income) or less expensive due to
size, age, or other characteristics. NOAH is not protected by deed restrictions or other
mechanisms, so these homes may become unaffordable at any time, depending on
                            investment, the market, and other factors.

                           Deed-restricted Affordable Housing
                           Deed-restricted Affordable Housing, often spelled with a capital
                           “A” and “H”, is legally required to cost no more than 30% of a
                           household’s income and be available to income-eligible
                           households only. The U.S. Department of Housing and Urban
                           Development (HUD) defines eligible households as households
                           earning 80% of the Area Median Income or less.

Area Median Income (AMI)
The AMI for Ashland and the Boston Cambridge-Quincy, MA-NH HUD Metro FMR Area is
$119,000 as determined by the U.S Department of Housing and Urban Development.
Eligibility for Affordable Housing is based on AMI and varies by household size. For example,
80% AMI, the typical threshold for most Affordable Housing, is $67,400 for a single-person
household in Metropolitan Boston, and $96,250 for a four-person household.

                  $119,000 AMI

                                                                                              4
Context Communities
Context communities provide a frame of reference to compare data, showing the
significance of housing trends observed in Ashland. Communities with demographic
characteristics similar to Ashland were used for context communities: Acton, Canton,
Holliston, Medway, Norfolk, Norwood, Sharon, and Walpole. MAPC’s MetroWest subregion
and the State of Massachusetts were also used to contextualize data findings and trends in
Ashland. Context communities were approved by the Ashland For All Steering Committee.

M.G.L. Chapter 40B
By state statute M.G.L. Chapter 40B, cities and towns are encouraged to provide 10% of
their total year-round housing units as deed-restricted Affordable Housing. If a municipality is
not at the 10% threshold, a developer can use a special Comprehensive Permit Process to
build developments with Affordable Housing, functioning as an alternative to local zoning
regulations. Municipalities seeking to encourage more Affordable Housing development can
also choose to use 40B regulations to facilitate development through the Local Initiative
Program, which offers state technical assistance for this development.

M.G.L. Chapter 40R
M.G.L. Chapter 40R, § 1-14, provides for smart growth overlay districts with increased
densities for residential development and multifamily housing by right (subject to site plan
review). At least 25% of the units in a Chapter 40R district must be affordable to low- or
moderate-income people. Municipalities that adopt a 40R Smart Growth Overlay District
(SGOD) can receive $10,000 to $600,000 in state funding, as well as $3,000 for every new
housing unit created in the district. Communities can also receive state assistance with
writing 40R zoning and adopting design standards.

Subsidized Housing Inventory (SHI)
In Massachusetts, the SHI is maintained by the MA Department of Housing and Community
Development (DHCD) and used to measure each municipality’s supply of Affordable Housing
for the purposes of Chapter 40B. The SHI includes all housing developed under Chapter
40B, including both Affordable Housing and market-rate units in rental developments, and
other deed-restricted Affordable Housing, such as public housing, project-based vouchers,
federal Low-Income Housing Tax Credit (LIHTC) projects, and many others.

                                                                                              5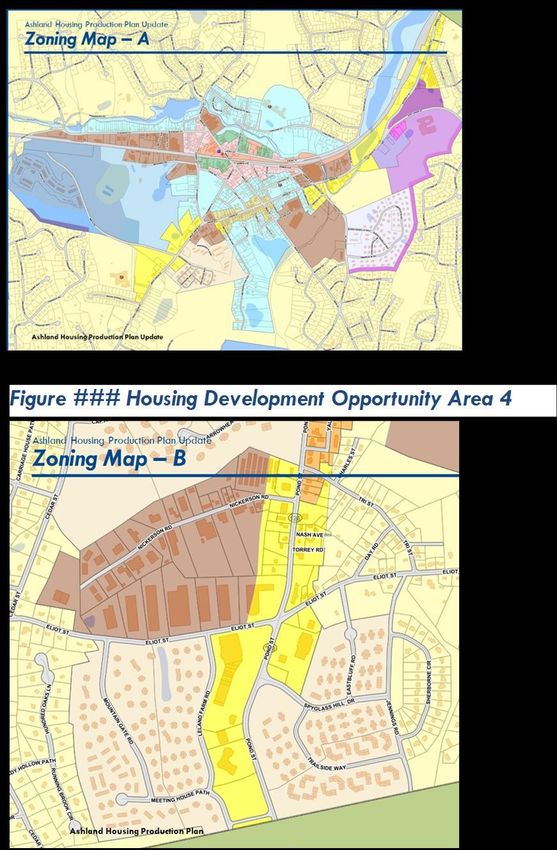
INTRODUCTION TO THE HPP UPDATE
A    shland For All is a two-part planning process to update the Town’s Housing Production
     Plan (HPP) and draft a town-wide inclusionary housing bylaw. The HPP Update is a
strategic plan for Ashland to meet local housing need and work toward creating a
community where everyone can live and thrive. Numerous housing challenges threaten to
make it difficult for Ashland’s residents to achieve their housing goals and stay in town and
restrict opportunities for others with goals to settle in Ashland. Rapidly rising home prices
and a limited supply of diverse housing options make it difficult for a range of households to
find suitable housing they can afford. Like many suburban communities throughout Greater
Boston and Boston’s Metro West, increasing home values and rents is exacerbated by land
use regulations that restrict the ability to create a range of housing options for households
of all ages and socio-economic backgrounds. The HPP Update takes a hard look at the
issues facing Ashland today and outlines strategies that the Town should prioritize as it
addresses its current and future housing needs.

The Town of Ashland has made strong efforts to expand           Steering Committee Members:
housing opportunities in last several years. In a major step
to plan for its housing needs, the Town contracted with         • Ron Etskovitz, Board of
MAPC to draft a HPP and adopted the plan in 2015. Since            Health
then, the Town has made investments in Affordable               • Steve Greenberg, Affordable
Housing and established programs to meet housing need              Housing Trust
with the leadership of the Ashland Affordable Housing Trust     • Tricia Kendall, Planning
(AHT), Ashland Select Board, Ashland Planning Board, and           Board
Ashland Community Preservation Committee.
                                                                • Brandi Kinsman, Select
Representatives from each of these bodies were appointed
                                                                   Board
by the Town to assist with this update to the 2015 plan and
served on the Ashland For All Steering Committee, which         • Aaron Ladd, Community
oversaw the HPP Update planning process. MAPC began                Preservation Committee
assisting the Town with the HPP update starting in October      • David Rosenblum,
2021 and completed the update after five steering                  Affordable Housing Trust
committee meetings, two focus group meetings, and two
public forum events—all hosted online via Zoom due to
public health safety conditions caused by the pandemic.

                                                                                             6
The project team and the HPP Steering Committee worked together to analyze the most
current quantitative data describing the Town’s demographics, housing stock, and housing
affordability and presented this information at the first public forum in December 2020
before updating the HPP goals. The feedback gathered at the first public forum indicated
continued support for the 2015 HPP goals, but also showed that the goals could be clearer
and more action-oriented (see Page 37 for forum one goal rankings). Based on this input
and the project team’s recommendation, the steering committee decided to consolidate the
seven 2015 HPP goals into five goals (See “Updated HPP Recommendations” chapter for
updated HPP goals). The 2015 HPP included over 20 recommendations, but there have
been challenges implementing so many strategies. In order to provide a HPP that can be
reasonably implemented over the next five years given the Town’s current capacity, the
update establishes nine priority strategies that will address Ashland’s most pressing housing
needs and have the greatest impact. Each priority strategy corresponds to one or more of
the HPP goals.

                                                                                           7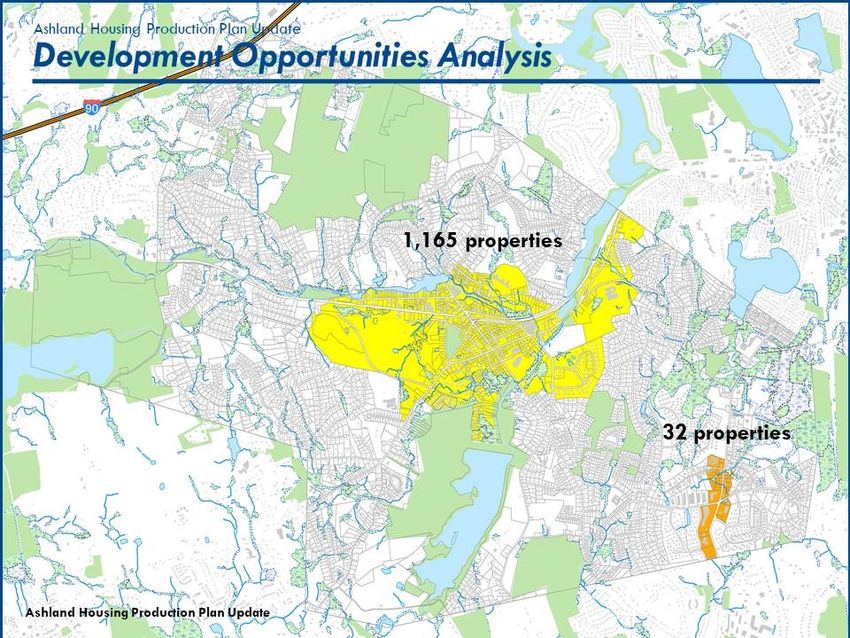
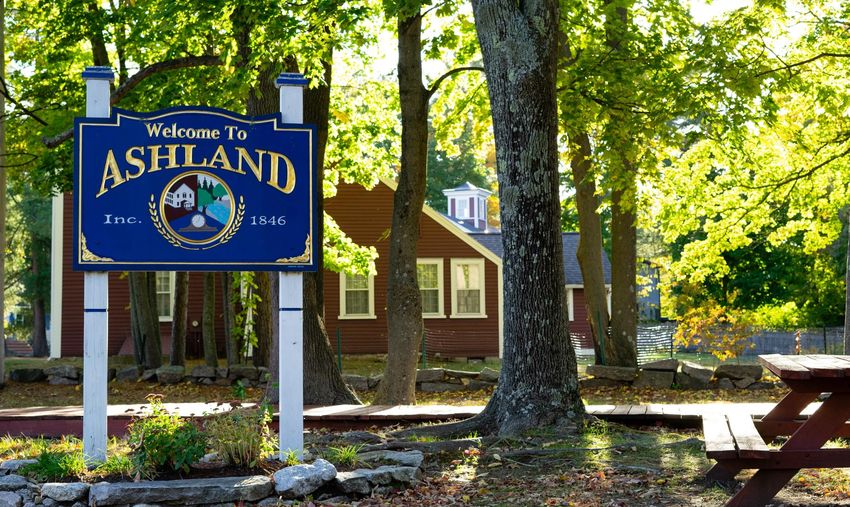
ASHLAND TODAY
                                           Ashland is 12.9 square miles and located within
                                           MAPC’s MetroWest Regional Collaborative
                                           (MWRC) subregion along with Framingham,
                                           Holliston, Marlborough, Natick, Southborough,
                                           Wayland, Wellesley, and Weston.

                                          Ashland is near several major Massachusetts
                                          highways (I-495, I-90, and I-95) and
                                          Massachusetts State Routes 9 and 85. Route 135
                                          runs through Ashland. The town has a MBTA
                                          Commuter Rail stop, Ashland Station, on the
                                          Framingham/ Worcester Line, and numerous bus
routes connect Ashland to destinations in the region.

Once a manufacturing town, Ashland has since become a popular suburb of Boston with
wonderful schools and green spaces. Ashland offers many amenities that make it a desired
destination: the Town’s school system (recently ranked 33rd best in the state) attracts
families, its location near Interstate 90 and the Commuter Rail provides access to regional
employment centers and transportation into Boston and Worcester, and its spacious parks
and historical/cultural assets provide for enriching recreational activities. But the high cost
of housing and a limited variety of available housing types makes it difficult for many to
settle and stay in town.

The majority of Ashland’s housing stock is single-family (79%). Sale prices of these homes
have increased 27% since 2015 to a median of $487,500 in 2019. Condominium prices
have increased 45% since 2015 to a median of $400,000 (The Warren Group, 2019). The
gross median rent in Ashland is also high at $2,100 (Local MLS data, 2018).

Although many Ashland households have higher incomes (57% earn more than $100,000 a
year), the remaining population has a variety of housing needs. Renters, seniors, single-
person households, and lower-income households struggle to afford housing in Ashland that
meets their needs. This has contributed to a little more than a quarter of households in
Ashland being cost-burdened, meaning they spend more than 30% of their income on
housing. This affects both renters and owners.

More than a quarter of Ashland households are also low-income, earning less than 80% of
the area median income (AMI) of $119,000 (HUD, 2020). Based on 2021 DHCD numbers,
6.3% of the town’s year-round housing units are on the state’s Subsidized Housing
Inventory. There are 415 units on the SHI for 1,885 eligible local households. These trends
are described in greater detail along with other key data takeaways in the next chapter:
Updated Housing Needs Assessment.

                                                                                                  8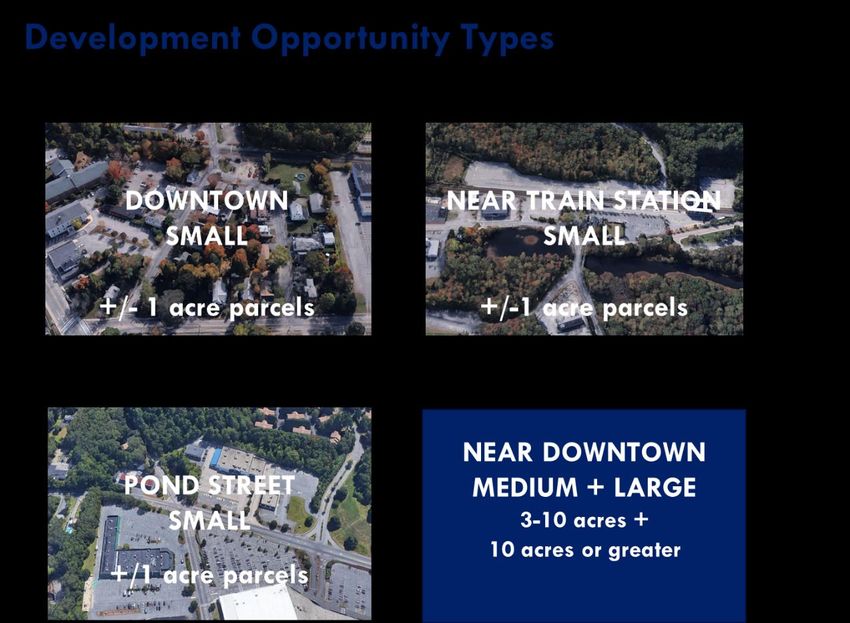
9
Key Findings and Trends
“I often joke I got the last affordable house in Ashland. And the only reason I
was able to get it was because of my partner. I could never afford to live here
as a single person.”
An Ashland resident employed by the Town describes difficulty buying a home in Ashland.
Shared at the Housing Need Focus Group Meeting on February 17, 2021. See the Public
Engagement and Plan Input chapter for a summary of input collected at this focus group
meeting and other engagement events.

T   he updated housing needs assessment was completed over the summer of 2020 and
    includes the most recent data available at that time. To support and inform the updated
HPP recommendations, the analysis of the Town’s housing needs focused on key data
findings and trends. To ground truth this quantitative data, public participants shared their
experiences and local knowledge at forums and focus group meetings. Excerpts from the
housing need focus group are included throughout this assessment where they relate to
data points. Key findings and trends regarding the Town’s demographic makeup, housing
stock, and housing affordability have been summarized below and are described in further
detail throughout this chapter.

Demographics
    1.   Ashland needs to provide housing for people of all life stages. Between 2010 and
         2018, there has been a 39% increase in the number of Ashland residents aged 35
         to 44 and a 31% increase in the number of children nine years of age or younger.
         At the same time, the number of residents 65 years or older has increased by 37%
         (Decennial Census 2010 + ACS, 2014-2018). Housing of all types is needed now
         and in the future to accommodate housing needs related to the full age range of
         Ashland residents.

    2.   Ashland needs housing for people of all incomes. Since the 2015 HPP was
         adopted, Ashland’s median household income has gone up from $95,296 to
         $121,406, an increase of 27%. Households earning over $100,000 increased by
         9% in the last five years and these households continue to make up the largest
         share of the population at 57%. Below this income bracket, household income is
         evenly distributed. However, there remains large income disparities between
         Ashland homeowners and Ashland renters. Today, the median income of an
         Ashland homeowner is $134,231 and the median income of an Ashland renter is
         $54,125, reflecting a similar income disparity as was documented in 2015.

                                                                                          10
3. Ashland has become more diverse over the last five years, and continued housing
efforts can build upon this progress. Since the last HPP was adopted, the
percentage of non-White residents rose from 11% to 22%. The share of Asian
residents in town has increased from 6.5% to 10% and Latinx residents increased
from 3% to 7%, but the share of African American residents slightly decreased, from
2.75% to 2.5% (ACS 2009-2013 and ACS 2014-2018). Today, 78% of Ashland
residents are White, showing opportunity for Ashland to work toward greater
diversity and inclusion as it considers its future housing needs.
Housing Stock
4. Since the 2015 HPP was completed, Ashland has seen a large increase in housing
units in town. From 398 units at Cirrus Apartments, to 64 units age-restricted units
at Robert Hill Way, to 93 age-restricted units at the Lanterns, Ashland has added a
significant amount of new multifamily housing and expects to continue to do so.1
5. A greater variety of housing types and tenures are needed in Ashland to facilitate
home ownership, enable downsizing, and create opportunities to rent that are more
attainable in the marketplace. Like many suburban communities in Greater Boston
and the MetroWest subregion, single-family homes make up the largest share of
the town’s housing stock (79%: 58% detached and 21% attached). Since 2016,
Ashland has permitted 728 new residential units. Roughly half of these were for
multifamily rental housing units (Town Permit Data, 2016-2021), but the town still
needs a greater variety of housing types, such as accessory dwelling units,
duplexes, townhouses, cottage housing, small-to-mid-sized multifamily housing,
and vertical mixed-use housing units.2
6. Ashland should work to make homeownership more attainable and provide more
rental opportunities for those who are unable to purchase a home in town. While
multifamily development has progressed and the overall number of housing units
has increased in the last five years, the share of renter-occupied housing units still
remains below 25%. With so few opportunities to rent, single-person households
and households without the large savings needed to purchase a home have limited
options to live in Ashland.
7. For households of various sizes and income levels to live in Ashland, lower-cost
housing that is affordable in the marketplace is needed. Many households do not
have the large savings required to purchase a home in Ashland. To put 10% down,
an individual would need upwards of $48,750 for the median priced single-family
1 There are a number of housing development projects currently in pre-permitting discussions, including 501
Pond Street, Village of the Americas – Phase VII and a possible 40R project at 10-50 Main Street. A friendly
40B began the permit process in February 2021, this project in the RTD district called Arbella at Ashland will
include 180 age-restricted units.
2 See the development opportunities chapter for definitions of these housing types and to learn how they
match up with the housing development opportunities in Ashland.
11home in Ashland ($487,500) and $40,000 for the median priced condominium
($400,000) (Warren Group, 2019).3
Housing Affordability
8. Increasing housing costs in Ashland are contributing to continued local housing
cost burdens. A household is considered housing cost burdened when residents
spend more than 30% of their income on housing costs, and severely cost
burdened when they spend more than half. This makes it difficult for these
households to afford other necessities, such as food, healthcare, and
transportation. Households with limited incomes are significantly impacted by
housing cost burden. In Ashland, 1,159 out of 6,561 households (18%) are both
low-income (income at 80% of the Area Median Income or lower) and either cost
burdened or severely cost burdened (CHAS, 2011-2015).
9. In Ashland, the range of households that are income-eligible to live in deed-
restricted Affordable Housing is distributed fairly evenly from low-income to
extremely low-income, so the Town should work to provide Affordable Housing units
that are available to this full range of households. Area Median Income ($119,900 -
HUD FY 2020) is used to determine eligibility for deed-restricted Affordable
Housing, and eligibility varies by household size. In Ashland:
• 690 households are considered low-income (50-80% AMI)
• 630 households are considered very low-income (30-50% AMI)
• 565 households are considered extremely low-income (Less than 30% AMI)
10. Among income-eligible households already living in Ashland, the housing needs of
seniors and single person households is particularly great. Of the 1,690 senior
households in Town, 58% are eligible to live in deed-restricted Affordable Housing
and of the 1,030 single or non-related householders, 28% are eligible.
11. The Town needs to expand its supply of deed-restricted Affordable Housing units
for a range of income-eligible households because the housing market in Ashland
does not serve everyone. Since the 2015 HPP was adopted, Ashland has
increased its Subsidized Housing Inventory (SHI) (see housing terms on Page 4 for
SHI definition) from 3.66% to 6.3%. The Town should be commended for this
progress, but more deed-restricted Affordable Housing units are still needed. For
the 1,885 income-eligible households in Ashland, there are 415 housing units on
the SHI—a ratio of one unit for every five eligible households (DHCD, 2021). But
since a share of SHI units developed through 40B are market-rate rentals, the
need is even greater.
3 When households put less than 20% into the down payment on a home, they are required to pay for private
mortgage insurance. This expense can amount to hundreds of dollars a month and make or break an
aspiring homeowner’s ability to afford a mortgage.
12Demographics
Ashland’s population growth exceeded projections made in 2015 and has grown from
16,593 total residents in 2010 to 17,739 today (Decennial Census 2010, ACS 2014-2018).
As the town has grown, some changes are discernible in the ages, incomes, and races of
Ashland’s residents. Other characteristics have remained the same, such as the ratio of
owners and renters in town.
Each of the demographic findings concerning the age, income, and race of Ashland
residents should be considered in relation to Ashland’s housing stock and how it determines
the ability for people of various backgrounds to live in town.
Age
As Ashland has grown, the portion of the population over 65 has increased and there has
been an influx of family aged-residents. Figure 1, below, shows an increase in residents
aged 65 and older, aged 35 to 44, and under nine years old.
Figure 1: Ashland Percent Population Change by Age (2010-2018)
Figure 2: Ashland Population by Age (2018)
Currently, Ashland’s largest age group is
aged between 35 and 54. Younger and
older age groups gradually expand from
the center in a diamond formation as seen
in Figure 2. These demographic
characteristics show the importance of
providing a range of housing options for
residents of all ages. Households of
various ages—families, seniors, singles—
all have different housing needs. Family-
oriented and intergenerational housing,
13owner-occupied units for downsizers and first-time homebuyers, and rentals are needed to
provide housing opportunities for Ashland’s population.
Figure 3: Ashland Household Income Distribution 2012 and 2018 Household Size
As with its population, the
average household size in
town has also increased from
2.59 in 2010 to 2.62 today.
This is a continued trend from
the 2015 HPP—the average
household size in Ashland in
2000 was 2.56. (Decennial
Census 2000 and 2010, and
ACS, 2014-2018). Increasing
household sizes could be
related to the number of
bedrooms per housing unit in
available housing.
Income
Over the last several years,
the median household income
in Ashland—and the share of
higher-income residents—has
increased. Income disparities
between owners and renters,
and between family and non-
family households, is evident.
Ashland’s median household income has increased by $26,110 since the 2015 HPP was
adopted, going from $95,296 to $121,406. The share of households earning over
$100,000 increased by 9% between 2012 and 2018 (2008-2012 and 2014-2018 ACS).
These high-earning households now represent a little more than half of the population. The
high number of upper-income households could be indicative of high-cost homes in Ashland
and a lack of housing for people of moderate and lower incomes (we examine housing stock
and housing affordability data in more depth later in this chapter).
Household income is distributed fairly evenly across the remaining half of the population.
These households have a wide range of housing needs and goals. Those with lower incomes
include seniors, single-person households, and renters.
As was the case in 2015, renters and non-family households earn remarkably less income
than owners and family households. Between 2012 and 2018, the median income of
homeowners in Ashland increased 20%, from $111,413 to $134,231. The median income
of renters in Ashland also went up—from $39,289 to $54,125—but renters in Ashland still
earn significantly less than owners. Some who rent in Ashland may do so by choice, but
others may represent a constituency that would like to live in town but cannot afford to buy a
14home. In either case, there are limited opportunities to rent (see housing stock subsection
on Page 16).
This income disparity is also evident in comparing median incomes for family households
(median income: $141,164) and non-family households (median income: $58,808).
Race and Ethnicity
“Being a minority, I still feel like Ashland has a ways to go… I moved out of the
city and this is my first experience with the suburbs. I can say I like it, but I also
have kids, so I feel like I’m biased. If I were a single person with no family, I
don’t know if I’d move to Ashland. I’d be hesitant being the only person like me
in the suburbs.”
Shared by an Ashland resident employed by the Town at the housing need focus group
meeting on February, 17 2021.
Over the last five years, Ashland has Figure 4: Ashland Race and Ethnicity (2014-2018)
grown more diverse. In that time, the
town’s share of non-white residents
increased by 10%, up from 11% in
2015 to 22% today.
Asian residents now make up the
largest non-White race/ethnicity: the
share of Asian residents increased
from 6.5% to 10%.
Latinx residents now make up 7% of
the population, compared to only 3%
in 2015. Slightly fewer African
Americans live in Ashland today, dropping from 2.75% to 2.5% of the population.
Racial composition in suburban communities across the United States is connected to a
history of federal, state, and local housing policies that caused segregation. One of the
biggest causes was redlining, a discriminatory practice supported by the federal government
that limited where people of color could access loans to purchase a home. The
consequences of redlining are still with us today, and the settlement patterns it created
have been perpetuated by zoning’s proliferation of single-family housing and the separation
of land uses. Race/ethnicity characteristics in Ashland are similar to other Metro West
municipalities, but Ashland is not as diverse as Middlesex County (27% non-white) or the
Commonwealth overall (28% non-white).
15The Greater Boston Housing Report Card is published by Figure 5: Ashland Housing Radar Chart
the Dukakis Center and the Boston Foundation to score
communities across the region on how their housing
conditions relate to opportunity, affordability, and racial
diversity. The scoring is represented on a radar chart (see
Figure 5) which indicates how the community is performing
in these areas.
Ashland scores high in best practices and is one of 25
communities in the Commonwealth that have adopted at
least six housing best practices. These best practices
include having an Affordable Housing Trust (AHT) and
adopting the Community Preservation Act (CPA) among
others (The Greater Housing Report Card 2019, page 91).
However, Ashland ranks low in the areas of production,
racial composition, and housing diversity.
Producing more types of housing options in Ashland will
create more opportunity for the town to continue to
improve its racial diversity and meet the broad array of
local housing needs.
Housing Stock
Ashland’s population is changing, as are the needs of its householders. To meet a wide
variety of housing needs, the Town needs to expand and diversify its housing stock.
Ashland’s zoning bylaws permit single-family housing in 78% of town and available housing
types follow suit: 79% of
the town’s housing Figure 6: Ashland Housing Units by Type
stock is single-family
homes. However, 21%
of these units are
attached townhouses or
condominiums, offering
a collection of
moderately-sized homes
to buy.
Since the 2015 HPP
was adopted, new
multifamily
development has
resulted in 728
residential permits, half
for larger multifamily
housing developments
(Town data, 2016-
162021). Still, the stock of small to Figure 7: Ashland Housing Tenure, 2012 vs. 2018
mid-sized multifamily housing—
duplexes, three- to four-unit
buildings, and five- to nine-unit
buildings—is lacking. This type of
housing is sometimes referred to
as “missing middle” housing.
Facilitating the development of
this housing can result in housing
that’s more affordable in the
marketplace, often due to smaller
size. This is referred to as
naturally-occurring affordable NOTE: ACS figures are based on sample size and lag behind permitting
data. They do not include approximately 400 new rental housing units that
housing (NOAH). Currently, there is have been built in the last two years.
little of this housing stock and rents
in town are relatively high. There could be some more naturally-affordable opportunities in
the stock of older buildings, which tend to be more affordable in the marketplace but are
sometimes in poor condition depending on their age.
Figure 8: Ashland Housing Tenure by Year of Building Construction
As described in Figure 8 above, the majority of Ashland’s housing stock was built between
1980 and 1999. Still, 35% of buildings were built prior to 1979. Older buildings vary in
condition throughout different parts of Ashland. Recent multifamily development mentioned
above has added to the stock of new rentals, but the supply of rentals is still far smaller than
the supply of owner-occupied housing.
Median rents in Ashland are in the middle of the pack in relation to the context communities
in Figure 9, but the average renter is stilling paying north of $2,000 a month. The chart
17below includes figures from the MAPC rental database, which pulls data from 2018 online
listings, as well as local MLS data provided by the Town. According to local MLS data, the
overall median cost of a rental housing unit in Ashland is $2,100. At the time the 2015 HPP
was adopted, American Community estimates had the median rent in Ashland at $1,170.
However, high rental costs are observed in virtually all communities throughout Greater
Boston.
Figure 9: Median Rent, Ashland + Context Communities, 2018
The greatest issue is the limited supply of rentals in Ashland, which may contribute to their
high cost. Rentals are the only way someone can live in town if they don’t have the large
savings required to buy a home. Although a significant share of multifamily housing units
has been permitted and developed in recent years, rental units are still limited to under a
quarter of Ashland’s housing stock. With so few opportunities to rent, single-person
households and households without the large savings needed to purchase a home have a
hard time finding a home in Ashland.
“He came to me and said, ‘Hey Dad, how much do I need to save to live in this
area?’ And it’s terrible. I look and I see he has to keep going further and
further.”
Shared on February 17, 2021 by an Ashland resident and realtor at the housing need focus
group meeting.
18Figure 10: Median Residential Sales Prices, Ashland + Context Communities, 2019
As in Metro West and the rest of Greater Boston, home purchase prices in Ashland have
increased over the last several years. From 2015 to 2019, the median price of a single-
family home in Ashland increased 27%, from $382,500 to $487,500. Although Ashland has
a moderate share of condominiums, these housing units are also expensive, and have
increased in cost at an even greater rate. The median cost of a condominium in town
increased by 45%, going from $275,000 in 2015 to $400,000 in 2019 (Warren Group,
2015-2019).
Figure 11: Ashland Median Home Sale Prices, 2010-2019
19The high median cost of a single-family home in Ashland is similar to costs for these homes
in other communities. However, Ashland has the second-highest median price for
condominiums, suggesting that newer high-cost condo developments have impacted this
number.
A greater variety of housing types is needed in Ashland to provide for more affordable
homeownership opportunities as well as opportunities to rent. Diversifying the housing stock
will better match the needs of town residents and support households struggling with a
variety of housing needs.
Housing Affordability
“We sold our Ashland house and, looking at the future, realized we couldn’t
afford to stay in town. We worked it out, but it’s sad we had to leave because
we did love the Ashland community.”
Shared by a former Ashland resident at the housing need focus group meeting on February
17, 2021.
Increasing housing costs impact current Ashland residents by making it more difficult for
them to afford other necessities, such as food, healthcare, and transportation. More than a
quarter (27%) of Ashland households are cost-burdened (ACS, 2014-2018), meaning they
spend too much on housing costs (30% of their income or more). Cost burden rates are
higher for renters, but owners experience cost burden as well. 43% of renters in town are
cost-burdened. Of these, 18% are severely cost-burdened, spending more than half of their
income on housing. 23% of owners are cost-burdened and 8% of them are severely cost-
burdened.
Figure 12: Ashland Housing Cost Burdens by Tenure, 2018
20Cost burden is occuring in Figure 13: Ashland Cost Burdened Households by Age, 2018
Ashland across households of
all ages. Reducing housing cost
burdens will benefit everyone:
more Ashland residents will be
able to accomplish their
financial goals and have more
discretionary income to support
the local economy.
Cost burden has the greatest
impact on households that
have less income to begin with.
For example, a higher-income
homeowner could spend more
than 30% of their income on
housing and not experience
any housing insecurity.
This is not the case for
Figure 14: Ashland Cost Burden by Households Income, 2015
lower-income households
that have limited
resources to expend on
housing costs.
Low to extremely low-
income households
earning between 30 and
80% of the Area Median
Income are considered at
risk of not being able to
meet their financial
obligations when
spending more than 30%
or more than 50% of their
income on housing. In
Ashland, 1,159
households are low-
income and cost burdned or severly cost burdnended. This data indicates the need for
continued housing assitance programs and the development of deed-restricted Affordable
Housing.
21Figure 15: FY 2020 Income Limits for Affordable Housing
Eligibility to live in Affordable Housing is based on the Area Median Income (AMI): $119,000.
This figure varies by household size and is $67,400 for an individual household.
Figure 16: Ashland Income-eligible Households by Household Type, 2015
Income-eliglble households in Ashland include families, but particularly elderly households
and those that live alone have the greatest need for Affordable Housing.
The range of income-eligible households in Ashland is distributed fairly evenly from
extremely low to low income, so the Town should work to provide Affordable Housing units
that are available to this full range of households. In Ashland:
• 690 households are considered low-income (50-80% AMI)
• 630 households are considered very low-income (30-50% AMI)
• 565 households are considered extremely low-income (Less than 30% AMI)
22Figure 17: Ashland Income-eligible Households, 2015
Since the 2015 HPP was adopted, Ashland has increased its Subsidized Housing Inventory
(SHI) (see housing terms on Page 2 for SHI definition) from 3.66% to 6.31%. The Town
should be commended for this progress, but more deed-restricted Affordable Housing units
are still needed. For the 1,885 income-eligible households in Ashland, there are 415
housing units on the SHI—a ratio of one unit for every five eligible households (DHCD, 2021).
But since a share of SHI units developed through 40B are market-rate rentals, the need is
even greater.
With the adoption of the HPP the Town is positioned to increase its SHI and possibly attain
periods of safe harbor depending on the progress made adding to this stock.4
4 Additional information about the Town’s SHI and pathways to safe harbor can be found in the Appendices.
2324
PUBLIC ENGAGEMENT AND PLAN INPUT

P    ublic input on housing needs and plan recommendations was a major addition to the
     HPP update. The project team presented data and recommendations for updated HPP
goals, priority strategies, best practices, and development opportunities at two public
forums. Qualitative information gathered from a housing need focus group illuminated key
data findings and helped to personalize housing issues. Additionally, insights about the
town’s land use regulations and development opportunities were gathered from local board
members and the development community during a housing development focus group
meeting. All this input strengthened the plan’s analysis and informed recommendations.
Information gathered from the public is summarized in Table 1 below and referenced
throughout the report where applicable. In general, public input supports the plan
recommendations and the Town’s efforts to expand housing opportunity.

Table 1: HPP Update Public Engagement Events

                                               Number of
 Event                    Date                              Engagement activities
                                               Participants

                          December                            Input on updated data and live polls ranking 2015
 Public Forum I                                41
                          29, 2020                            HPP goals for importance/relevance.

 Housing Need             February 17,                        Group discussion and share of personal housing
                                       10
 Focus Group              2021                                challenges and goals.
 Housing
                          March 18,                           Group discussion of the town’s housing challenges,
 Development                                   16
                          2021                                goals, and possible solutions.
 Focus Group
                                                              Main room and breakout room discussions of draft
                                                              HPP priority strategies and best practices.
                          April 29,
 Public Forum II                               36
                          2021                                Live polls ranking importance of proposed HPP
                                                              priority strategies and housing
                                                              opportunities/recommended housing types
 Five steering            October
                                                              Discussion of data, public input, and plan
 committee                2020 – May           6
                                                              recommendations.
 meetings                 2021
 TOTAL: Nine              Seven                109
 meetings                 months               participants

NOTE: Takeaways from public discussions and polling results are described throughout the report to
show how they influenced and informed the HPP update recommendations.

                                                                                                       25
26
UPDATED HOUSING DEVELOPMENT
CONSTRAINTS

T  he 2015 HPP included a detailed assessment of constraints on housing development.
   This documented natural constraints such as protected open space, wetlands and
sewer; an evaluation of the Town’s capacity to address housing needs; and a zoning audit.
Natural constraints remain the same as in 2015, but there have been some updates to the
town’s zoning bylaws and housing toolkit/capacity.

Updates to Zoning Audit
Since the 2015 HPP was published, there have been numerous changes to Ashland’s zoning
bylaws, but few of those changes affect housing development in Ashland. In the fall of 2016,
a rate-of-development bylaw was added to the Town’s zoning regulations. This bylaw
restricted the rate at which building permits could be issued to certain development
projects. The restriction included a four-year sunset clause and expired in 2020. It is difficult
to determine whether the rate-of-development bylaw dissuaded potential developers from
projects in Ashland. However, it likely did not have a negative effect on the size of
developments for those projects that went through the permitting process, as the restriction
was not on the number of units permitted but the rate at which they could be built.

In the spring of 2018, the Office Commerce district was removed, and areas that were Office
Commerce were rezoned as Residential A district. The two districts had similar use
regulations, and the only residential use difference was that assisted living facilities are now
allowed in the area. The remainder of Ashland’s zoning bylaws are the same as when they
were audited in 2015. A summary of this audit is included below.

Ashland’s Zoning Constraints
Ashland’s Zoning bylaws regulate the type and location of development within town. For the
purposes of a HPP, zoning can be considered a constraint if the bylaws significantly limit
expanding the housing supply to meet demand. A simple assessment of housing
development potential is made difficult by the unusually large number of zoning districts and
overlay districts that exist in town—29 districts and sub-districts in total. There are three
basic residential zones, but housing is also permitted in most of the commercial districts
(except for the Industrial District) and is allowed in specified sub-districts of the Ashland
Downtown District, the Pond Street Mixed Use Overlay District, the Wildwood Mixed Use
Special District, and the Rail Transit District.

A summary of residential uses permitted in the various base zones can be found in the
following table:

                                                                                              27
Table 2: Principal Use Regulations
A. RESIDENTIAL Res Res Res Comm Comm Comm Comm Industrial
USES A B Multi- High- Down- Village Neighborhood
family way town
Single-family dwelling Y Y Y Y Y Y Y N
Mobile home or N N N N N N N N
trailer
Two-family dwelling N Y Y BA Y BA Y N
Conversion of single- N Y Y BA Y BA Y N
family to two-family
dwelling
Conversion of N N N N N N BA N
single/two-family to
dwelling with not
more than four units
Multifamily dwelling N N BA N N N N N
Lodging or boarding N N N Y Y Y BA N
house
Assisted living facility Y Y N Y Y N BA N
Cluster development PB PB PB N N N N N
Planned multifamily N N N BA BA BA N N
development
Senior residential Y** Y N Y Y N N N
community
Nursing or N N N Y Y Y BA N
convalescent home
Mixed residential N N N PB* N N N N
units and
commercial uses in
the same building
Y: Permitted as-of-right
BA: Subject to special permit issued by Board of Appeals
PB: Subject to special permit issued by Planning Board
PB: Subject to special permit issued by Board of Selectmen
*Number of dwelling units permitted shall not exceed a maximum of five (5) units per acre
** According to Section 7.2 of the zoning bylaw, this use requires a special permit from the
Planning Board
28Description of Zoning Districts5
Residence A covers three-quarters of the town. It is a conventional district for single-family
home development, though Ashland also allows assisted living facilities and senior housing
by right. A conforming lot in this district requires at least 30,000 sq. ft. of land (90% upland)
and 150 feet of frontage with a 40-foot front setback. In addition, lot shape regulations
apply in RA and all other zoning districts (Section 4.1.4).
Residence B* covers approximately 400 parcels around Downtown Ashland and the north
side of Pond Street/Route 126. It allows both single-family and two-family dwellings (new or
by conversion) by right. A conforming lot in the RB district has 20,000 sq. ft. of land and 125
feet of frontage, but a two-family home requires 30,000 sq. ft. Further, Ashland imposes a
maximum floor area cap of 4,500 sq. ft. on single-family and two-family dwellings in the RB
(and other) districts for lots with less than 30,000 sq. ft. in area. The size limit applies
unless the Board of Appeals grants a waiver.
Residence Multifamily (RM)* is a district designated for multifamily housing - except that
multifamily dwellings are allowed only by special permit from the Board of Appeals and only
on parcels of five or more acres with at least 300 feet of frontage. There is a density limit of
one unit per 5,000 sq. ft. of lot area and 2,500 sq. ft. per bedroom. The design standards
clearly favor townhouses over garden-style units (and by default, homeownership
developments over rental housing, because Ashland prohibits building entrances that
provide access to more than two units and limits building heights to two stories and 28 feet.
By contrast, the maximum height for single-family and two-family homes in all zoning
districts is 2 ½ stories and 35 feet.
Highway Commerce (CH) is a commercial district where single-family dwellings, assisted
living facilities, and senior housing developments are permitted as of right. The Board of
Appeals has authority to grant special permits for two-family homes and "planned"
multifamily developments (a term undefined in the Zoning Bylaw.) Although not shown in the
Table of Principal Use Regulations, mixed uses with residential units are allowed by special
permit in the CH district, up to five units per acre (Section 7.7). There is a maximum height
of three stories for residential uses (two stories less than allowed for commercial uses.)
Downtown Commerce (CD)* is nearly identical to CH, except that two-family homes are
allowed by right and mini-storage facilities are prohibited. Dwellings must comply with the
same dimensional regulations that apply in the RB district, including maximum height of
three stories and 35 feet (again, two stories less than allowed for commercial uses.)
Village Commerce (CV)* is a small district east of Route 126 in the Southeast corner of
town. In this district, two-family homes require a special permit. The minimum lot
requirement is 15,000 sq. ft., with at least 100 feet of frontage; the minimum front setback,
20 feet; and the maximum height, four stories.
5Districts that regulate development opportunity areas (discussed in the Updated Housing Development
Opportunities Chapter) are noted with an asterisk.
29Neighborhood Commerce (CN)* is the only area in Ashland where the town allows accessory
apartments by right and the Board of Appeals can grant a special permit to convert a single-
family or two-family home to multifamily units (up to four). There is a very small minimum lot
area requirement of 5,000 sq. ft. However, there is a maximum lot coverage rule of 15%.
Ashland Downtown District (ADD)* is intended to operate as Ashland's downtown zoning. It
consists of three sub-areas, each with different use and dimensional requirements. It is the
only district to impose a maximum front setback or to regulate use intensity based on gross
floor area ratio (FAR.) Parking requirements are 75% of what would typically be required in
other districts.
SUB-AREA A provides for the highest intensity of use (FAR 2.0); it allows multifamily
dwellings and both horizontal and vertical mixed uses by right, together with retail
stores, bakeries, ice cream shops, restaurants, theatres, indoor recreation, and light
industrial uses. Single-family and two-family homes are prohibited. Multifamily
density cannot exceed 10 units per acre. Permissible building heights vary by class of
use.
Sub-Area B is similar to Sub-Area A, but single-family dwellings are allowed by special
permit.
Sub-Area C seems to encourage a more residentially-oriented mix of uses. Here, the
Town allows single-family homes by right and limits multifamily dwellings to a special
permit requirement. Buildings are limited to three stories regardless of use.
Ashland has placed many expectations on development in the ADD, and some of those
expectations imply a desire for larger-scale projects. For example, the Town requires
construction of sidewalks in front of buildings in the ADD pedestrian areas and amenities for
buildings exceeding 30,000 sq. ft., and connecting walkways with adjacent neighborhoods.
These standards would not be difficult for a large-scale project, but for existing properties
seeking to evolve toward the goals of the ADD, the cost to provide pedestrian infrastructure
could be problematic and may discourage small redevelopment projects.
Pond Street Mixed-Use Overlay District (PSMUOD)* allows horizontal and vertical mixed
uses, retail development, light industrial uses, and research and development, if a proposed
project satisfies eight criteria and five review standards. The maximum building height is five
stories, though the Planning Board can approve a height increase. PSMUOD contemplates
fairly high-density development: the district allows multifamily units up to one per 2,000 sq.
ft. of lot area (21 units per acre). Any development with 10 or more dwelling units is required
to set aside at least 10% of the units as housing affordable to low- and moderate-income
households.
Wildwood Mixed Use Special District (WMUSD)* consists of five sub-areas with a combined
total of about 150 acres. Wildwood "A" provides for more residential uses and a variety of
housing by right, whereas Wildwood "B," "D," and "E" around the intersection of Waverly, East
Union, and Union streets provide for industrial and office uses, restaurants, banks, and
nursing homes by right, and hotels by special permit. Development in the WMUSD requires a
30minimum tract of 50 acres. The maximum residential density permitted in the district varies
by sub-area and class of use. For example, senior housing requires a minimum of 4,000 sq.
ft. per unit plus 1,050 feet for two bedrooms, but multifamily units without age restrictions
require a minimum of 5,000 sq. ft. per unit and 1,000 sq. ft. per bedroom. The bylaw also
imposes limits on the percentage of developable land that can be devoted to multifamily
dwellings in Wildwood "A," and when proposed in Wildwood "D," multifamily projects have to
include a reservation of land for commercial development. As in the PSMUOD, affordable
housing is required in Wildwood "A" and "D." This district has remarkably prescriptive site
planning requirements and performance standards, and specific application procedures (in
addition to Ashland's customary site plan application requirements) that are intended to
document a project's consistency with the WMUSD bylaw.
Rail Transit District (RTD)* includes nearly 200 acres in the vicinity of the Ashland MBTA
station and the Nyanza Superfund site. The RTD concept calls for a mix of industrial,
commercial, and residential uses in a planned arrangement that takes advantage of access
to commuter rail. It consists of six sub-areas, including three that encourage many types of
residential uses and one sub-area (A) limited to age-restricted housing. Rental housing is
specifically listed as a permitted use in only one sub-area (D). The maximum allowable
density for the RTD as a whole depends on the unit type, with rental housing at a maximum
of 20 units per buildable acre (in sub-area E) and 10 units per buildable acre for age-
restricted units. A Transit Village Community (TVC) composed of "luxury" housing units and
accessory services is allowed by right with significantly reduced off-street parking
requirements, subject to site plan review by the Planning Board, in two of the RTD's sub-
areas.
Specific Zoning Issues
Mixed-Use Development
As described above, mixed use development is permitted, generally by special permit, in a
variety of zoning districts and overlay districts in Ashland.
Accessory Dwellings
Section 7.6 of the zoning bylaws permit Accessory Family Dwelling Units in single-family
homes by special permit. The bylaw limits occupancy of the accessory unit to four persons
and requires owner occupancy of the structure (either the principal or accessory unit.)
Boarders and lodgers are not permitted. The floor area of the accessory unit may not exceed
800 sq. ft., or 25% of the floor area of the principal unit, whichever is larger. Occupancy
permits for accessory units must be renewed every two years and are not transferrable upon
sale or change of occupancy.
Information collected from the housing development focus group indicated very few
accessory dwelling units are permitted each year but there’s significant public interest and
need for building them.
Conversion of Dwellings
Single-family buildings may be converted to two-family dwellings in the Residence B,
Residence Multifamily, Downtown Commerce, and Neighborhood Commerce districts as-of-
31right, and in the Highway Commerce and Village Commerce districts subject to special
permit by the Board of Appeals. Conversion to three- or four-family structures is permitted
only in the Neighborhood Commerce district by special permit from the Board of Appeals.
The zoning bylaw prohibits expansion of the principal structure or the creation of additional
entrances visible from a street. The lot must satisfy minimum lot area requirements plus
50% of the lot area requirement for each additional unit. Minimum unit size is 700 sq. ft.
Over-55 Housing Developments
Section 7.2 of the zoning bylaw sets forth requirements for “Senior Residential
Communities” in Ashland. Units must be owned/occupied by at least one person over 55
and no more than one non-handicapped person under that age, except in case of
emergency and for a limited period of time. Maximum density for such developments is five
units per acre, with no more than two bedrooms per unit. Only detached or attached single
family homes are permitted. Specific site design requirements are specified in the bylaw,
including a prohibition on through streets, a maximum lot coverage of 25%, and a 30-foot
separation distance between structures.
Parking Requirements
The zoning bylaw requires two spaces per residential unit, except in the ADD, where
requirements are reduced by 25%. Shared parking and reductions in parking requirements
are permitted by special permit in certain districts such as the Village Commerce and
Neighborhood Commerce districts.
Town Capacity
Since the 2015 HPP was adopted, the Town’s capacity has grown due to a strong
commitment to address housing needs as well as the urgency required to respond to the
impacts of the pandemic. Since 2015, both the Ashland Affordable Housing Committee and
the Ashland Affordable Housing Trust were described. Since then, the Committee has been
dissolved and merged with the Ashland Affordable Housing Trust. The Trust uses Community
Preservation Funds to preserve and increase affordable housing in Ashland.
The Ashland Affordable Housing Trust is an active member of the affordable housing scene
in Ashland and is constantly looking for new opportunities to preserve and increase
affordable housing in Ashland. Recently, the Trust committed funds to help create affordable
units in the 12 Pond Street development and oversaw the purchase and sale of existing
affordable units in Ashland.
In 2020, the Trust committed $250,000 to an Ashland COVID-19 Rental/Mortgage
Assistance Program. In response to housing issues created by the COVID-19 crisis, the Town
of Ashland and the Affordable Housing Trust worked together to create the Ashland COVID-
19 Rental/Mortgage Assistance Program. Using funds from the CARES Act and the
Affordable Housing Trust, rental/mortgage assistance has been available since July 2020
for Ashland residents that have experienced a reduction in income due to COVID-19, make
less than 80% AMI, and do not receive other state-funded housing assistance. Since its
inception, the program has committed $150,000 to Ashland residents. In addition to this
program, Ashland’s Department of Human Services has ramped up their efforts to connect
32You can also read