ASEAN Travel & Hospitality - The Great Tourism Drive - DBS Bank
←
→
Page content transcription
If your browser does not render page correctly, please read the page content below

25
 SECTOR BRIEFING
number

 DBS Asian Insights
  DBS Group Research • July 2016

                                   ASEAN Travel &
                                      Hospitality
                                     The Great Tourism Drive
DBS Asian Insights
SECTOR BRIEFING 25
 02

ASEAN Travel &
Hospitality
The Great Tourism Drive
Paul Yong CFA
Equity Analyst
DBS Group Research
paulyong@dbs.com

Mervin Song CFA
Equity Analyst
DBS Group Research
mervinsong@dbs.com

Namida Artispong
Equity Analyst
DBS Vickers Securities (Thailand)
namidaa@th.dbsvickers.com

Marvin Khor
Equity Analyst
AllianceDBS Research
marvinkhor@alliancedbs.com

Singapore Research Team
DBS Group Research
equityresearch@dbs.com

Produced by:
Asian Insights Office • DBS Group Research

  go.dbs.com/research
  @dbsinsights
  asianinsights@dbs.com

Chien Yen Goh   Editor-in-Chief
Jean Chua       Managing Editor
Geraldine Tan   Editor
Martin Tacchi   Art Director
DBS Asian Insights
                                        SECTOR BRIEFING 25
                                                             03

05   Executive Summary

06   Firm Growth of Tourism in Asia
        Tourism’s Importance to ASEAN
        ASEAN Tourism 2025
        Growing on ASEAN’s Open Skies

18   Tourism: Thailand’s Personal Goldmine

23   Singapore Hospitality: Nearing a Bottom

26   Courting the Chinese Tourist
        Making ASEAN Even More Attractive

37   What Is Standing in ASEAN Tourism’s Way?
DBS Asian Insights SECTOR BRIEFING 25 04
DBS Asian Insights
                                                              SECTOR BRIEFING 25
                                                                                            05

Executive Summary
 Travel and tourism sector is a significant contributor to ASEAN’s GDP and GDP
 growth. Travel and tourism accounted for 12.4% of ASEAN’s GDP in 2015, according
 to the World Travel & Tourism Council (WTTC), compared with an average of 8.5% in
 Asia Pacific and 9.8% globally. The ASEAN Tourism Strategic Plan (ATSP) targets tourism
 to make up 15% of ASEAN GDP by 2025 and to account for 7% of total employment,
 from 3.7%.

 Thailand to remain ASEAN’s tourism crown jewel. Tourism directly and indirectly
 accounted for over 20% of Thailand’s GDP in 2015, accompanied by a 20% year-on-
 year (y-o-y) increase in international tourists to 30 million. In the first quarter of 2016,
 international arrivals rose by more than 15% y-o-y, heralding another strong year for
 Thai tourism. Over the longer term, Thailand’s strength as a tourist destination with
 multiple cultural attractions, coupled with strong government support for the sector,
 means that it should continue to shine as a tourism play.

 Room to improve in the rest of ASEAN. With the exception of Myanmar (5.9%) and
 Brunei (7.4%), tourism accounts for at least 10% of total GDP for the other ASEAN
 nations. We believe that Malaysia, Indonesia, and the Philippines have room to boost
 tourism’s contribution to their economies, by easing visa requirements further and/or
 through increasing support, promotions, and infrastructure for tourism in their respective
 countries. Meanwhile, Singapore continues to innovate, especially on new attractions
 and events, to sustain its tourism sector.

 Chinese tourists to the fore. According to the United Nations World Tourism
 Organization (UNWTO), the number of China’s total outbound travellers rose 10% y-o-y
 to 128 million in 2015, while their spending jumped 25% y-o-y to US$292 billion. For
 the first three months of 2016, Chinese arrivals increased by 29% in Thailand, 47% in
 Singapore, and 35% in Malaysia, indicating firm growth momentum.

 Multi-pronged efforts to lure Chinese tourists. Thailand continues to be a role model
 for efforts in attracting tourists to its shores. These include a) building quality attractions
 and promoting culture, b) relaxing visa requirements, and c) improving connectivity and
 infrastructure, i.e. its open-sky approach and improved capacity at its airports. Singapore,
 meanwhile, has a strong track record of coming up with new attractions, e.g. integrated
 resorts, Jewel Changi Airport, Mandai nature hub, etc. Most ASEAN countries have
 adopted a number of such measures to attract more tourists.

 Rising number of Chinese visitors to ASEAN... We believe that the number of Chinese
 tourists visiting ASEAN will continue to grow in the medium to long term, driven by: a)
 the growing middle class in China and their propensity to travel for leisure, b) ASEAN’s
 attractiveness as a leisure destination and continued efforts by ASEAN governments to
 attract Chinese tourists to their shores, and c) the proliferation of low-cost carriers (LCCs)
 and spending on infrastructure to support tourism.
DBS Asian Insights
SECTOR BRIEFING 25
06
Firm Growth of Tourism in Asia
The Asia Pacific region is now the second most visited and fastest-growing region in the
world. Boosted by rapid economic expansion, growing affluence, and a burgeoning middle
class increasingly opting for travel as a leisure activity – most notably in China, a key source
market – the Asia Pacific region has been one of the world’s most vibrant tourism markets
over the past decade.
According to UNWTO, the number of international tourists rose 4.4% y-o-y, or by 50
million, to hit a record 1.18 billion in 2015.1 The Asia Pacific region and Americas & Europe
both reported the strongest growth of 5%, with the former attracting 13 million more
international visitors than in 2014.
Diagram 1. World tourism growth (1990-2015)
1,200
Million Visitors
1,000
800
600
400
200
0
1990 1995 2000 2005 2010 2013 2014 2015
International Tourist Arrivals (m)
Europe Asia and the Pacific Americas Africa Middle East
Source: UNWTO
The Asia Pacific region has seen tourism growing firmly at a compound annual growth
rate (CAGR) of around 6-7% since 1995. Over 2010 to 2014, the region was the fastest
growing at 6.4%, higher than the 4.5% growth reported by the global travel industry. As
a result of the sustained growth in international visitors, the Asia and the Pacific region has
also seen a 6-percentage-point increase in its market share of global international arrivals to
around 23% in 2014 (versus 17% in 2000).
The Asia Pacific region has
been one of the world’s most
vibrant tourism markets over
the past decadeDBS Asian Insights
SECTOR BRIEFING 25
07
Diagram 2. Market share of global tourism by region
MARKET SHARE (2000) MARKET SHARE (2015)
Africa Middle East Africa Middle East
4% 3% 5% 4%
Americas
19% Americas
16%
Europe
Europe 52%
57%
Asia and the
Pacific Asia and the
17% Pacific
23%
Source: UNWTO, DBS Bank
International tourism receipts grew by 4% y-o-y to US$1.245 trillion in 2014, with Asia and
the Pacific region receiving US$377 billion (up 4.5% y-o-y), or around 30% of the total.
On a per-capita basis, we note that tourists to the region are the second most generous
spenders (slightly behind visitors to the Americas).
Diagram 3. Share of international tourism receipts (2014)
Africa Middle East
3% 4%
Americas
22%
Europe
41%
Asia and the
Pacific
30% Source: UNWTO
Within the greater Asia and Pacific region, most of the growth in tourist arrivals
came from ASEAN and the Northeast. Between 2010 and 2014, international tourist
arrivals in ASEAN grew at a CAGR of 8.2%, outpacing the greater Asia and Pacific region’s
6.4% CAGR. Northeast Asia also saw a respectable CAGR of 5.1%.
Delivering more than 45% of the growth in tourist numbers for the Asia and the Pacific
region, ASEAN’s tourism sector warrants a deeper look. We will consider its key source
markets in the following segments.DBS Asian Insights
SECTOR BRIEFING 25
08
Diagram 4. Growth of tourism arrivals (2010-2014)
The 300
economic 250
9.3% CAGR
significance 3.7% CAGR
200
of travel and 8.2% CAGR
tourism to 150
the ASEAN 100
bloc is 5.1% CAGR
indisputable 50
0
2010 2011 2012 2013 2014
North-East Asia ASEAN Oceania South Asia
Source: UNWTO, DBS Bank
Travel and tourism sector plays an outsized role in ASEAN’s economy. The economic
significance of travel and tourism to the ASEAN bloc is indisputable. Based on statistics
published by the WTTC, the travel and tourism segment accounted for 12.4% of ASEAN’s
GDP in 2015 – above the global average of 9.8%.
Diagram 5. Tourism’s contribution to ASEAN and selected regions (2015)
Country Receipts (US$ bn) % of GDP
Maldives 2.6 96.5%
Macau 33.2 71.2%
ASEAN 301.8 12.4%
Hong Kong 60.6 19.5%
New Zealand 29.2 17.4%
Australia 132.2 10.8%
China 853.8 7.9%
Japan 326.1 7.9%
India 129.5 6.3%
South Korea 69.5 5.1%
Asia Pacific Average 8.5%
World Average 9.8%
Source: WTTCDBS Asian Insights
SECTOR BRIEFING 25
09
Tourism’s Importance to ASEAN
A critical growth engine. According to the WTTC, the travel and tourism sector of ASEAN
member-states generated US$301.7 billion in value-add in 2015. In real terms, contributions
from ASEAN’s travel and tourism sector have almost doubled over the last 15 years, from
US$141.1 billion in 2000 (also representing around 12.4% of regional GDP then).
For 2016, the contribution from travel and tourism is expected to grow 5.2% y-o-y to reach
US$317.3 billion, outpacing the projected 4-4.5% GDP growth for ASEAN in 2016.
Diagram 6. Tourism’s contribution to ASEAN’s GDP (2000-2016F)
350 14%
300 12%
250 10%
200 8%
150 6%
100 4%
50 2%
0 0%
Tourism Receipts (US$ bn, Real Prices) Percentage of GDP
Source: WTTC
Over the last Economic contributions from travel and tourism grew for almost all member-
15 years, nations... With the exception of Brunei, which has seen a decline in real tourism
Thailand has contributions over the last 15 years, growth for the other member-states ranged between
emerged 4.2% and 12.8% CAGR.
as the clear
Contributions from travel and tourism grew by an average of 6.5% across ASEAN countries,
leader among mainly led by developments in frontier markets Cambodia, Myanmar, Laos, and Vietnam,
ASEAN which grew at 15-year CAGRs of 12.8%, 11.2%, 8.7%, and 8.7%, respectively, as these
nations countries progressed toward more open market structures.DBS Asian Insights
SECTOR BRIEFING 25
10
...with Thailand the standout beneficiary of ASEAN’s travel boom. Over the last 15
years, Thailand has emerged as the clear leader among ASEAN nations, after registering the
highest absolute growth in travel and tourism contributions of US$44.6 billion, from just
US$37 billion in 2000 to almost US$82 billion in 2015.
On a relative basis among the ASEAN 5, Thai travel and tourism also delivered the strongest
cumulative growth of 5.4% per annum between 2000 and 2015, followed by Malaysia,
Singapore, the Philippines, and Indonesia at 5%, 4.9%, 4.7%, and 4.2%, respectively.
Diagram 7. Growth in tourism contributions (2000-2015)
Member- Contributions (US$ bn) 15-year
Rank
State 2000 2015 CAGR
1st Cambodia 0.89 5.4 12.8%
2nd Myanmar 0.77 3.8 11.2%
3rd Laos 0.49 1.7 8.7%
4th Vietnam 7.62 26.7 8.7%
5th Thailand 36.95 81.6 5.4%
6th Malaysia 18.81 38.9 5.0%
7th Singapore 14.01 28.7 4.9%
8th Philippines 15.68 31.5 4.7%
9th Indonesia 44.53 82.4 4.2%
10th Brunei 1.30 1.2 -0.7%
Source: WTTC, DBS Bank
International arrivals grew 37% between 2010 and 2014. Between 2010 and 2014,
tourist arrivals into ASEAN grew at a CAGR of 8.2%, beating the global pace of 4.5%, to
reach a record 105 million visitors.
Diagram 8. ASEAN’s tourist arrivals (2010-2014)
110
90
70
Millions
50
30
10
-10 2010 2011 2012 2013 2014
Brunei Darussalam* Cambodia Indonesia
Lao PDR Malaysia Myanmar
The Philippines Singapore Thailand
Vietnam
*adjustments made to Brunei Darussalam statistics
Source: ASEAN Tourism Statistics DatabaseDBS Asian Insights
SECTOR BRIEFING 25
11
Speed bump in 2014. According to data compiled by the ASEAN Tourism Statistics
Singapore’s Database, tourist arrivals grew around 2.8% in 2014 – a stark contrast to the annual growth
hospitality of between 9.8% and 10.1% registered in the three preceding years.2
market is The weakness was led by Singapore and Thailand, which saw international visitors drop
likely to be about 3% and 6.7%, respectively. The drop in arrivals in Thailand was mainly due to the
nearing coup in the country in May 2014, while the overall decline in visitors to ASEAN was a result
bottom of a spate of air accidents that year.
Impact of currency on arrivals. While incentives for travel to frontier markets such as
Cambodia, Laos, Myanmar, and Vietnam tend to be independent of currency movements,
we observe a distinctive relationship between demand for travel to non-frontier ASEAN
destinations and movements in their respective currencies (relative to the US dollar),
particularly for movements that are sustained over a two-year period.
Diagram 9. Correlation between currency movements and arrivals
Non-frontier member-state Correlation between international arrivals and:
1-year currency movement 2-year currency movements
Brunei 79.7% 84.7%
Indonesia 52.4% 94.6%
Malaysia 68.1% 96.5%
Philippines 59.8% 86.5%
Singapore 72.7% 72.3%
Thailand 67.0% 94.8%
Source: ASEAN Tourism Statistics Database, Bloomberg Finance L.P., DBS Bank
Contributions of the tourism industry to the GDP of ASEAN nations vary quite
widely. For instance, we observe that tourism made the single biggest sectoral contribution
to Cambodia’s economy around 30% of GDP (up from 15% in 2000), but only made up
around 6% of Myanmar’s GDP.
We believe that there is potential for tourism in Malaysia, the Philippines, and Indonesia to
further grow its share of GDP, while Singapore’s hospitality market is likely to be nearing
bottom. Thailand, ASEAN’s largest tourism market, is our preferred proxy to the region’s
tourism growth and is well positioned for continued expansion.DBS Asian Insights
SECTOR BRIEFING 25
12
Diagram 10. Contribution of tourism to GDP (2015)
Rank Member-State Receipts (US$ bn) % of GDP
1st Cambodia 5.42 29.9%
2nd Thailand 81.6 20.8%
3rd Laos 1.74 14.0%
4th Vietnam 26.68 13.9%
5th Malaysia 38.86 13.1%
6th Philippines 31.45 10.6%
7th Singapore 28.69 10.0%
8th Indonesia 82.36 9.6%
9th Brunei 1.18 7.4%
10th Myanmar 3.78 5.9%
Source: WTTC
ASEAN Tourism 2025
Tourism to remain a core component of ASEAN’s growth. Prior to 2011, the tourism
industry traditionally contributed 8-13% of ASEAN’s GDP and 2-4% of the region’s total
employment, and was thus identified as one of the priority sectors for integration by 2015
under the ASEAN Economic Community pillar.
The ASEAN Tourism Strategic Plan (ATSP) 2016 – 2025 outlined that “by 2025, ASEAN will
be a quality tourism destination offering a unique, diverse ASEAN experience, and will be
committed to responsible, sustainable, inclusive and balanced tourism development, so as
to contribute significantly to the socio-economic well-being of ASEAN people.”3
Integration efforts under the ATSP 2011-2015 have yielded good results – real contribution
surged more than 50% from US$200.4 billion in 2010 to US$301.7 billion in 2015, while
tourism’s share of total employment increased from 3.3% to 4.1% (or 30% growth in
tourism jobs from 9.5 million to 12.5 million). We believe the tourism sector will play an
increasingly important role in ASEAN’s economy.
Onward to 2025. Building on the momentum and achievements of ATSP 2011-2015, the
ATSP 2016-2025 has identified ten strategic programmes for implementation to deliver the
following core strategic objectives:DBS Asian Insights
SECTOR BRIEFING 25
13
Diagram 11. General framework of ATSP 2016-2025
Directions
Strategic
SD1: Enhance competitiveness SD2: Ensure that ASEAN
of ASEAN as a single tourism tourism is sustainable
destination and inclusive
1.1 Intensify promotion and 2.1 Upgrade local communities
marketing and public-private sector
participation in the tourism
1.2 Diversify tourism product
value chain
1.3 Attract tourism investments
Strategic Action Programmes
2.2 Ensure safety and security,
1.4 Raise capacity and capability prioritise protection and
of human capital management of heritage
sites
1.5 Implement and expand
ASEAN tourism standards 2.3 Increase responsiveness to
for facilities, services, and environmental protection
destinations and climate change
1.6 Implement and expand
connectivity and destination
infrastructure
1.7 Enhance travel facilitation
Source: ASEAN Tourism Strategic Plan 2016-2025
Goals of ATSP 2016-2025. If the identified programmes and projects are fully resourced
and implemented as planned, anticipated results by 2025 (as highlighted in the ATSP 2016-
20254) include:
(1) Contribution of tourism to GDP expected to rise to 15% from 12% in 2013
(2) Tourism’s share of total employment expected to increase to 7% from 3.7% in 2013
(3) Increase in per-capita spending by international tourists to US$1,500 from US$877 in
2013
(4) Number of accommodation units could increase to 0.60 units per 100 head of population
in ASEAN from 0.51 units in 2013
(5) Number of community-based tourism value chain project interventions could increase to
more than 300 from 43 in 2013DBS Asian Insights
SECTOR BRIEFING 25
14
Challenges lie ahead… Arriving at the milestone of US$1,500 per tourist by 2025 would
require the development of quality tourism products and destinations, which could be a
challenge for ASEAN in the near term.
Major hurdles to the competitiveness of ASEAN as a single tourism destination include the
limited availability of air, sea, and road connectivity infrastructure (existing infrastructure in
the less-developed destinations, if any, is also often poor) and lack of seamlessness in cross-
border travel between member-countries.
Arriving at
the milestone …but still a boon for local aviation and hospitality plays over the long term.
of US$1,500 Despite near-term impediments, we believe that investments in connectivity and destination
per tourist by infrastructure (i.e. airports, cruise terminals, tourist accommodation, and attractions) are
necessary to support sustainable and inclusive tourism.
2025 would
require the As the ASEAN tourism sector undergoes greater integration and pushes toward higher-
development quality tourism, we expect local aviation and hospitality sectors, especially those with
of quality exposure to secondary gateways and sub-regional points, to see higher yields.
tourism
products Growing on ASEAN’s Open Skies
and
destinations ASEAN is a key beneficiary of the emergence of LCCs in Southeast Asia. Led by
strong growth in LCC seat capacity, which quadrupled from 50.3 million seats in 2007 to
194.1 million seats in 2014 (which implies an impressive CAGR of 21.3% over seven years),
ASEAN saw a jump of around 69% in international tourist arrivals from 62 million in 2007
to 105 million in 2014.
LCCs preferred for intra-ASEAN air travel... ASEAN has benefitted from the strong
growth in intra-regional travel over the last decade, as the emergence of LCCs led much of
the improved connectivity within the region.
We observed that since 2007, LCCs have quickly gained traction to replace full-service
carriers (FSCs) as the preferred mode of air travel within ASEAN, especially to secondary or
sub-regional points, as the proportion of LCC to FSC seats peaked in 2014 at 57:43.DBS Asian Insights
SECTOR BRIEFING 25
15
Diagram 12. LCCs’ market share of intra-ASEAN routes
100%
90%
80% 46.1% 43.0% 43.6%
54.6% 52.9%
70% 63.3% 59.3% 57.0%
67.6%
60%
50%
40%
30% 53.9% 57.0% 56.4%
45.4% 47.1%
20% 36.7% 40.7% 43.0%
32.4%
10%
0%
2007 2008 2009 2010 2011 2012 2013 2014 2015
LCC Seats FSC Seats
Source: Centre for Asia Pacific Aviation
…and have been gaining market share in ex-ASEAN routes. Apart from their
stronghold in the intra-ASEAN market, LCCs have been gaining traction in mid- to long-
haul flights (ex-ASEAN routes), as evidenced by the steady growth in their market share
from 4% in 2007 to 18.6% in 2015, helped by the expansion of AirAsia X and Scoot.
Diagram 13. LCCs’ market share of ex-ASEAN routes
100%
90%
80%
70%
60%
50%
40%
30%
20%
10%
0%
2007 2008 2009 2010 2011 2012 2013 2014 2015
LCC Seats FSC Seats
Source: Centre for Asia Pacific Aviation
The push for more open skies has extended beyond the intra-ASEAN market.
Over the past decade, ASEAN’s push toward the liberalisation of the domestic aviation
market through its open-skies programme has extended beyond the intra-ASEAN region as
member-nations have also signed similar air services arrangements with dialogue partners
to enhance air connectivity.DBS Asian Insights
SECTOR BRIEFING 25
16
Most notably, the establishment of the open-skies agreement between ASEAN and China
in 2010 has led to double-digit growth in inbound seat capacity, which has in turn fuelled
Chinese tourist arrivals to ASEAN.
Spike in inbound seat capacity from China into ASEAN. Weekly seat capacity of
inbound flights from China into ASEAN has grown significantly since the establishment
of open-skies arrangements between China and selected member-nations, particularly for
Chinese carriers, whose seat capacities appear to have more than doubled from 92,000
weekly seats in June 2013 to 188,500 weekly seats in June 2016. (Based on statistics for the
weeks of June 3, 2013 and June 6, 2016, respectively.)
Unsurprisingly, China is now ASEAN’s largest single source market. Outside of intra-
ASEAN arrivals, which typically represent the bulk of ASEAN’s international arrivals (or
around 46.8% in 2014), China serves as the region’s largest single source market. In 2014,
around 12.4% of ASEAN’s tourist arrivals originated in China.
Diagram 14. ASEAN’s source markets for tourists (2010-2014)
90.0%
80.0%
70.0%
60.0%
50.0%
40.0%
30.0%
20.0%
10.0%
0.0%
2010 2011 2012 2013 2014
Intra-ASEAN China European Union 28 South Korea Japan Australia
Source: ASEAN, DBS Bank
LCCs will be the likely
beneficiaries of regional travel,
especially given the smaller
aircraft they fly and their appeal
to more budget-conscious
travellersDBS Asian Insights
SECTOR BRIEFING 25
17
ASEAN Open Skies achieves full ratification. After delays of the initial goal of the
ASEAN Single Aviation Market by end-2015, ASEAN reached a significant milestone toward
establishing an ASEAN Economic Community as it finally achieved full ratification from its
member-nations of the ASEAN Open Skies (AOS) agreements in April 2016.
But obstacles to actual implementation remain. While the ratification of AOS
agreements signifies member-nations’ commitment to a regional open-sky arrangement
to support regional economic integration, we reiterate our view that the achievement of
this milestone is more symbolic and could lack economic substance. This is because several
obstacles to true fifth freedom of the air remain:
(1) Slot restrictions
Despite air agreements translating into unlimited flights among ASEAN airlines, the
allocation of these slots is limited by the lack of slot capacity (especially in capital cities)
and subject to approval from airports.
(2) Lack of infrastructural support
Progress will take time as ongoing efforts to build critical air infrastructure and capacity
are still preliminary; but as new facilities and capacity are gradually constructed and
deployed, LCCs will be the likely beneficiaries of regional travel, especially given the
smaller aircraft they fly and their appeal to more budget-conscious travellers.DBS Asian Insights
SECTOR BRIEFING 25
18
Tourism: Thailand’s Personal
Goldmine
According to the WTTC, tourism made a remarkable 9.3% (US$36.4 billion) direct
contribution to Thailand’s GDP in 2015 (a total contribution of 20.8% to GDP and 15.4%
to total employment), outpacing the country’s economic expansion (16.2% CAGR from
2010 to 2015 compared to 7.5% growth in GDP). This, combined with a correlation factor
of 0.75, indicates tourism is a critical driver of the Thai economy.
Foreign visitor spending accounted for 75% of direct travel and tourism GDP while
domestic travellers are responsible for the remaining 25%. Meanwhile, travel and tourism
revenues are mainly fuelled by leisure travel spending from inbound and domestic travellers,
accounting for 84% of direct travel and tourism GDP in 2015.
Diagram 15. Tourism and GDP of Thailand (1996-2014)
50% US$m 50,000
40% 45,000
30% 40,000
35,000
20%
30,000
10%
25,000
0%
20,000
-10% 15,000
-20% 10,000
-30% 5,000
Tourism receipts (RHS) GDP Growth (%) Tourism receipts Growth (%)
Source: World Bank, DBS Bank
Thailand’s tourism industry is resilient. Thailand is well known for its variety of
destinations and low cost. It offers cultural, natural, and historical attractions with beautiful
beaches and mountains, as well as a unique cuisine. Its tourism industry has proven to
be resilient, having quickly recovered from several unfortunate events such as floods and
political unrest.DBS Asian Insights
SECTOR BRIEFING 25
19
Diagram 16. Thailand’s ups and downs
'000 People
Bomb at
3,500 Europe & US slowdown Erawan shrine 80%
Yellow shirt occupied
government house Red shirt Central Thailand BKK Political Protests
3,000 Rajprasong riot flooding Coup d'état 60%
Subprime
2,500 Coup d'état Declared state Airport Closure
of emergency 40%
Pattaya
2,000
Riot
20%
1,500
0%
1,000
500 -20%
0 -40%
Jan05
Jan06
Jan07
Jan08
Jan09
Jan10
Jan11
Jan12
Jan13
Jan14
Jan15
Jan16
Sep12
Sep05
Sep06
Sep07
Sep08
Sep09
Sep10
Sep11
Sep13
Sep14
Sep15
May05
May06
May07
May08
May09
May10
May11
May12
May13
May14
May15
Visitor arrivals % chg. y-o-y (RHS)
Source: Tourism Authority of Thailand, DBS Bank
Despite the Global Financial Crisis in 2008-2009 and political turmoil in 2014, international
tourist arrivals contracted in those periods by only 3.4% and 4.3%, respectively. In 2015,
international arrivals to Thailand rebounded by 20.4% y-o-y to 29.9 million, thanks to a
calmer political situation, the government’s 2015 Discover Thainess campaign, and the
country’s competitive tourism offerings.
For 2016, the government is focusing more on increasing revenue and quality tourists by
improving management, marketing, and services.
Expect tourist arrivals growth to continue. In the first four months of 2016, international
tourist arrivals to Thailand rose by 13.5% y-o-y to 11.7 million. The Department of Thailand
Tourism expects the number of visitors to reach 32 million (up 7% y-o-y) by the end of
2016.5 From 2015-2020, the Pacific Asia Travel Association estimates international tourists
will grow at a CAGR of 10.7%.6DBS Asian Insights
SECTOR BRIEFING 25
20
Diagram 17. International tourist arrivals to Thailand (2009-2016)
'000 People
3,400
3,000
2,600
2,200
1,800
1,400
1,000
600
Feb
Nov
Jan
Jun
Jul
Sep
Dec
May
Apr
Aug
Oct
Mar
2009 2010 2011 2012
2013 2014 2015 2016
Source: Bank of Thailand
Explosion of arrivals from China. Visitors from China have grown exponentially since
2010 (a CAGR of 47.9% from 2010-2015) and accounted for 26.5% of total visitors to
Thailand in 2015, up from merely 5.5% in 2009. Prospects also remain positive, given
Thailand’s historical resilience as a value-for-money leisure and business destination.
Diagram 18. China as a percentage of total visitor arrivals (1997-2015)
30% 10%
9%
25% 8%
20% 7%
6%
15% 5%
4%
10% 3%
5% 2%
1%
0% 0%
China as a % of total visitor arrivals Share of total China outbound
Source: Tourism Authority of Thailand
The new terminal at Phuket
airport will double passenger
capacity to 12.5 million per
annum and is expected to open
this yearDBS Asian Insights
SECTOR BRIEFING 25
21
Diagram 19. Sources of visitor arrivals to Thailand (2015)
South Asia Oceania Middle East Africa
5% 3% 2% 1%
Americas
4% China
26%
East Asia ex-ASEAN
ex-China 14%
Europe ASEAN
19% 26%
Source: Tourism Authority of Thailand
Visitors from ASEAN countries have also helped drive growth. In recent years,
increasing arrivals have largely come from East Asia (including China, Japan, and South
Korea) and ASEAN, which together comprised 66.5% of total visitors to Thailand in 2015,
up from only 50% in 2009. We believe that, given these trends, international visitor growth
to Thailand should continue to be powered by East and Southeast Asia. ASEAN, which has
been seeing incremental contribution to total visitors, with a CAGR of 11.8% from 2010-
2015, will be particularly important.
We note that the majority of visitors from ASEAN are from Thailand’s neighbours: Malaysia
(43.6% – a large portion of which are overland), Laos (15.3%), Singapore (11.9%), and
Vietnam (9.5%). Visitor arrivals from these countries also grew at a significant rate in 2015
– 31.9%, 15%, 11%, and 34.3%, respectively.
Accommodation, shopping, and food and beverage are major expenditures. Along
with the total average expenditure, we observe that major components such as daily
accommodation expenditures (particularly for hotels) have also been rising – from 1,190
Thai baht in 2008 to 1,473 baht in the first half of 2015.
Government policies to promote tourism. Thailand’s government has launched applicant-
friendly visa procedures to attract more international tourists. In September to November
2014, visa-free travel was granted to Chinese and Taiwanese tourists. In November 2015,
six-month visas were granted to allow tourists multiple and unlimited entries for up to 60
days per stay. Recently, visas-on-arrival were granted to citizens of 19 countries, including
China, to allow them to enter Thailand as tourists for 15 days.DBS Asian Insights
SECTOR BRIEFING 25
22
Additionally, the government is also trying to boost domestic tourism by extending a 15,000-
baht tax deduction allowance this year for those who spend on hotels, tour packages, and
travel within the country. Meanwhile, there are also special tax privileges for investments
made in tourism and services.
Expanding the airport. Major airport development plans are in the pipeline to cater to
growing tourist arrivals. The new terminal at Phuket airport will double passenger capacity
to 12.5 million per annum and is expected to open this year. Additionally, construction of
Suvarnabhumi phase 2, which will increase the airport’s capacity from 45 million per annum
to 60 million, will start in the second half of 2016.
Rising demand would easily absorb a moderate growth in hotel room supply.
As at the end of 2015, hotel supply in Bangkok stood at 42,000 keys. CBRE, an international
real estate consultant, expects the supply to grow to 48,800 rooms by 2020 (five-year CAGR
of 3%).7 Most of this supply will be luxury hotels with an average room rate of 4,500-5,500
baht. Tourist arrivals to Bangkok will continue to be strong as the city offers a range of
experiences ranging from old charm (palaces and temples) to modern shopping, nightlife,
and fine dining. As the capital city, it is also a starting point for international travellers to
explore the rest of the country. With a high occupancy rate of almost 75% currently, hotels
in Bangkok should be able to increase room rates. China is the biggest source market to
Bangkok, followed by Japan, South Korea, and India. In 2015, the number of Chinese
tourists surged 82.5%.
In Phuket, there were 18,223 hotel rooms at the end of 2015 and another 3,948 keys are
expected to be added by 2020 (five-year CAGR of 4%), according to CBRE.8 Nevertheless,
demand for hotels should continue to grow as Phuket remains a world-class resort
destination and as new retail complexes, duty-free stores, as well as a new terminal at
Phuket airport come on stream. Chinese tourists are now the top feeder market, followed
by Russians, Australians, South Koreans, and Malaysians. In 2015, Chinese travellers to
Phuket jumped 34.8% to 1.3 million, offsetting a decline in Russian tourists. Additionally,
the Tourism Authority of Thailand is promoting growth in international arrivals to Phuket by
targeting first-time visitors from Europe.DBS Asian Insights
SECTOR BRIEFING 25
23
Singapore Hospitality:
Nearing a Bottom
We expect 2016 to remain a challenging year for the Singapore hospitality market. While
we project tourist arrivals to increase in 2016 by 5% to 16 million, largely on the back of
the continued rise in Chinese visitor numbers and an increase in conferences which are held
biannually, we expect total visitor days to rise only 4% due to the shorter average length of
stay. In addition, we remain cautious on the revenue per available room (RevPAR) outlook
Corporate as new room supply remains a concern. Approximately 3,930 rooms (6% of existing supply)
demand, are due to open in 2016. In addition, corporate demand, which typically generates higher
yield per guest, remains soft. Thus, we project a 4% y-o-y drop in 2016 RevPAR to S$201.
which typically
generates Potentially more balanced market from 2017. With supply pressures easing from 2017
higher yield due to lack of new land released by the Singapore government for hotel developments over
per guest, the past two years, there are prospects for a more stable or improving RevPAR outlook.
remains Thus, we believe 2016 may be the bottom in the Singapore hospitality market following a
difficult 2014 and 2015 where RevPAR fell 1% and 5%, respectively.
soft
Diagram 20. RevPAR in Singapore (2013-2016)
y-o-y growth
10.0%
8.0% 7% 7%
7% 6%
6% 5%
6.0%
4.0% 3%4% 4%
2.0% 1%
0.0%
-2.0% -1%
-1% -2%
-4.0% -3%
-4%
-6.0% -5%
2013 2014 2015 2016F
Visitor Arrivals Visitor Days Room supply RevPAR
Source: Singapore Tourism Board, DBS Bank
Chinese tourists continue to arrive. Following an extremely weak 2014 when tourists
from China (Singapore’s second-largest source market) dropped 24% y-o-y to 1.7 million
as Chinese tour groups avoided Southeast Asia due to the MH370 incident and the political
situation in Thailand, the number of Chinese visitors recovered in 2015, rising 22% y-o-y
to 2.1 million. We expect the recovery to continue in 2016 and, given the 47% growth in
Chinese arrivals in the first quarter of 2016, we estimate a 20% y-o-y increase this year.DBS Asian Insights
SECTOR BRIEFING 25
24
Earlier-than-expected recovery in Indonesian visitors. Contrary to our earlier
expectations for a flat outlook for visitor arrivals from Indonesia (Singapore’s largest source
market) in 2016, arrivals in the first quarter of 2016 were robust, rising 11% y-o-y. This
may be due to strengthening of the Indonesian rupiah versus the Singapore dollar, despite
airline seat capacity dropping 3% y-o-y in the first quarter. While we have had a strong
start, we are cautious on being outright bullish as overall seat capacity between Indonesia
and Singapore is projected to decline 1-2% y-o-y over the second and third quarters of
2016 – according to data from the Centre for Asia Pacific Aviation (CAPA) – and the rupiah
has started to weaken again. We now project 4% y-o-y growth in tourist arrivals from
Indonesia in 2016.
Diagram 21. Sources of Singapore’s inbound arrivals
US 3%
Indonesia
Europe 10% 17%
Others 13%
China 13%
South Korea 4%
Japan 5%
Malaysia 7%
Vietnam 3%
HK 3% India 7%
Thailand 3% Australia 7%
Philippines 4%
Source: Singapore Tourism Board, DBS Bank
Greater cultural attractions and sporting events to draw new tourists. Following
the opening of the Singapore Sports Hub in 2014, the variety of sporting attractions as
well as music events and concerts on offer will continue to expand. The Rugby Sevens
will be added in 2016. Such yearly events, including the Formula 1 and Women’s Tennis
Association’s finals, should provide a steady stream of visitors each year. The push toward a
more diversified base of attractions has also seen the opening of cultural attractions including
the National Gallery Singapore. With a greater mix of sporting and cultural options adding
to well-known attractions such as Orchard Road and the Singapore Zoo, the country’s
competitive position against other markets should be enhanced.DBS Asian Insights
SECTOR BRIEFING 25
25
Overall seat capacity to Singapore points to recovery this year. Based on CAPA’s
data, seat capacity between Singapore and the rest of the world is projected to increase 4%
y-o-y in the second and third quarters. We believe this will support a sustained recovery in
Singapore arrivals; this underpins our forecast of a 5% increase for tourist arrivals in 2016,
higher than the 0-3% growth projected by the Singapore Tourism Board (STB).9 However,
given the lower “quality” of tourists coming in, i.e. tour groups which typically stay only 1-2
days in Singapore, we forecast total visitor days to rise only 4% due to the shorter average
length of stay.
Expanding airport capacity points to growth in medium term. Recent plans to grow
the tourism sector include the building of a new Terminal 5 at Changi. This, together with
the planned opening of Terminal 4 in 2017, is expected to double the current airport’s
capacity to 135 million passengers per year by 2020. We believe this points to sustained
growth in tourist arrivals into Singapore in the medium term.
Pressure from new room supply. While new supply in 2016 will be lower than the
4,237 rooms added in 2015, supply pressures should still persist with 3,930 net new rooms
added. Nevertheless, going into 2017, with only 2,727 rooms to be added, the demand and
supply situation in Singapore could potentially be more balanced.
Expansion in 2015 largely in mid-tier category with 2016 more evenly balanced. In
2015, the growth in supply was driven by the mid-tier segment, which represented 64%
of total net new supply in 2015 and 20% of existing mid-tier stock. For 2016, the new
supply of 3,930 rooms is more evenly spread across all four categories: Economy (20% of
new 2016 supply), mid-tier (41%), upscale (22%), and luxury (17%). Nevertheless, similar
to 2015, we expect the mid-tier and economy categories to face the greatest pressure on
average daily rate and occupancies.
In 2016, we expect the mid-
tier and economy categories
to face the greatest pressure
on average daily rate and
occupanciesDBS Asian Insights SECTOR BRIEFING 25 26
DBS Asian Insights
                                                              SECTOR BRIEFING 25
                                                                                                   27

Courting the Chinese Tourist
Due to the geographical proximity of member-countries, the lion’s share of arrivals into
Southeast Asia has historically originated within ASEAN itself. As such, the region was a
key beneficiary of the strong growth in intra-regional travel over the last decade, as the
emergence of LCCs drove connectivity within the bloc, especially to secondary gateways
and sub-regional points.

Apart from the arrivals from Russia, which was largely skewed by the much lower base,
Chinese arrivals into ASEAN grew rapidly at a CAGR of 24.6%, as they more than doubled
from 5.4 million in 2010 to 13.1 million in 2014. China has become ASEAN’s largest
single source market outside of intra-ASEAN arrivals. At the end of 2014, Chinese arrivals
represented 12.4% of ASEAN’s total arrivals, rising from just 7.3% in 2010.

Diagram 22. ASEAN’s visitors by market share (2010-2014)
                          2010           2011          2012            2013               2014
 Intra-ASEAN             47.5%         46.5%          44.7%           45.2%              46.8%
 China                    7.3%          9.0%          10.4%           12.4%              12.4%
 European Union 28        9.5%          9.1%          9.1%            8.5%               8.8%
 South Korea              4.5%          4.8%          4.5%            4.8%               4.8%
 Japan                    4.5%          4.5%          4.8%            4.6%               4.4%

                                                               Source: ASEAN Tourism Statistics Database

Explosive growth in Chinese tourism. Chinese outbound tourism has been growing
at a breakneck CAGR of 16.6% from 2009-2015 to 120 million and, more importantly,
expenditure by outbound tourists grew at a CAGR of 31.8% to US$229 billion. The strong
growth in Chinese outbound tourism, measured by both the number of people and
expenditure, is largely driven by China’s growing middle class, firm economic growth, and
the greater propensity to travel.

China’s fast-growing middle class. Since China joined the World Trade Organization
in December 2001 and opened up its economy, it has enjoyed tremendous economic
expansion. This has naturally led to high income growth for its population and lifted millions
of people into the middle class. In terms of gross national income per capita, as measured
by the World Bank, China has seen its per-capita income rise from US$330 in 1990 to
US$7,400 by 2014. This was close to the World Bank’s upper-middle-income benchmark
of US$7,926 in 2014.
DBS Asian Insights
SECTOR BRIEFING 25
28
According to Discover China’s Emerging Middle Class survey released by ZenithOptimedia,
China’s emerging urban middle class totalled 125 million in 2012, and the number is
expected to reach 356 million by 2020.10
Rising propensity to travel for leisure in China. It was estimated in the MasterCard
Insights 2014 first quarter report that outbound leisure trips (excluding Hong Kong and
Macau), as a percentage of total households in China, came in at 9.1% in 2014 – a figure
which is projected to rise to 18.8% in 2020. This is in comparison to 35% for Japan, 99.6%
for South Korea, and 566% for Singapore in 2014. According to the same report, the
inflection point for the propensity for international leisure travel for emerging markets is
around the US$10,000 mark (for household income), after which it continues rising rapidly
until the US$30,000 level.11
Diagram 23. Outbound travel growth versus real GDP growth
Country/
Trip Type 2011 2012 2013 2014 2020
Region
China Leisure 9.9% 11.7% 14.0% 16.3% 29.7%
China (excl. HK
Leisure 5.1% 6.3% 7.9% 9.1% 18.8%
& Macau)
India Leisure 2.2% 2.5% 2.7% 3.0% 5.8%
Japan All purpose 34.4% 37.4% 34.7% 35.0% 37.7%
South Korea All Purpose 68.9% 73.8% 80.2% 82.3% 99.6%
Singapore All purpose 548.4% 564.4% 562.3% 566.1% 696.4%
Hong Kong All purpose 283.7% 305.9% 332.5% 334.9% 427.8%
Source: MasterCard Insights First Quarter 2014
The Chinese are also spending more per tourist. Since 2010, expenditure per Chinese
tourist has grown rapidly in tandem with rising disposable income in China.
ASEAN countries among top ten destinations visited by Chinese travellers. According
to Bloomberg, the top destinations for Chinese outbound tourists in 2015 included several
ASEAN countries such as Thailand, Singapore, and Malaysia, which had shares of 5.9%,
1.6%, and 1.1%, respectively.DBS Asian Insights
SECTOR BRIEFING 25
29
Diagram 24. Top destinations for Chinese outbound tourists (2014-2015)
Tourists (in millions) 2015% 2014%
Destination Y-o-Y
2015 2014 share share
Hong Kong 45.8 47.2 -3.0% 34.4% 40.6%
Macau 20.4 21.3 -4.0% 15.3% 18.3%
Thailand 7.9 4.6 70.1% 5.9% 4.0%
South Korea 6.0 6.1 -2.3% 4.5% 5.3%
Japan 5.0 2.4 107.3% 3.7% 2.1%
Taiwan 4.2 4.0 5.0% 3.1% 3.4%
France 2.5 1.9 29.6% 1.8% 1.6%
USA 2.4 2.2 11.4% 1.8% 1.9%
Singapore 2.1 1.7 22.3% 1.6% 1.5%
Malaysia 1.5 1.6 -3.3% 1.1% 1.3%
Germany 1.4 1.0 37.7% 1.0% 0.8%
Australia 1.0 0.8 23.3% 0.8% 0.7%
Others 33.0 21.5 53.5% 24.8% 18.5%
Total 133.2 116.3 14.5% 100.0% 100.0%
Source: Bloomberg Finance L.P.
We believe that Thailand, Singapore, and Malaysia were the largest beneficiaries of the
growth in outbound Chinese tourists over the last few years as the proliferation of LCCs
and aggressive expansion by Chinese carriers improved their connectivity to Chinese cities.
Seat capacity between Thailand and China more than tripled… From June 2014
to June 2016, total seat capacity between China and Thailand has more than tripled as
Chinese carriers added seats by around 350%.
...while growth in total seat capacity was relatively less pronounced for Singapore-
China and Malaysia-China. The two country pairs show similar growth patterns in seat
capacity between June 2013 and June 2016, with sluggish growth in 2014 and 2015.
However, growth appears to be picking up in 2016, with capacities for the Singapore-China
and Malaysia-China routes growing 10.2% and 11.3% y-o-y, respectively.
Chinese carriers were the driving force for seat capacity growth in Malaysia-China routes as
their total seat capacity grew 91.2%, more than offsetting the 1.7% decline in seat capacity
of Malaysian carriers.DBS Asian Insights
SECTOR BRIEFING 25
30
Big jump in arrivals from China to Thailand. Visitor numbers from China have grown
exponentially since 2010 (a CAGR of 47.9% from 2010-2015), and accounted for 26.5%
of total visitors to Thailand in 2015, up from merely 5.5% in 2009. Prospects also remain
positive, given Thailand’s resilience as a value-for-money leisure and business destination,
as well as government efforts to promote tourism.
Singapore leverages on China’s growing outbound travel market. After creeping
up steadily from 2% in 2009 to 2.3% of total Chinese outbound travel in 2013 (based
on reports by the World Bank), Singapore’s share of China’s outbound tourists appears
to be plateauing. The country, however, remains one of the most popular destinations for
Chinese tourists.
Given the sheer size of China’s tourism market, and supported by the fast-growing middle
class, Singapore has potential to become a premier holiday destination for the Chinese.
China is the third-largest source of visitors to Malaysia, behind Singapore and
Indonesia. Visitor numbers from China to Malaysia have grown from under 800,000 in 2007
to nearly 1.7 million in 2015, representing a CAGR of 9.9% over the period. As a percentage
of total tourist arrivals into Malaysia, Chinese tourists have risen from 3.8% in 2007 to 6.5%
in 2015. In the first three months of 2016, the number of Chinese tourists into Malaysia rose
by an impressive 35% y-o-y and could rise more during the rest of the year, following the
In official launch of e-visas for Chinese tourists from March to December 2016.
Singapore,
Chinese Chinese are among the biggest spenders in Singapore... Although Indonesian tourists
are higher in numbers (17.9% of arrivals in 2015 compared to China’s 13.8%), Chinese
tourists tourists are collectively the largest single contributor to total tourism receipts – dwarfing the
spend an expenditures of Indonesians on a per-tourist basis.
astounding
Diagram 25. Singapore’s tourism receipts for first nine months of 2015 by country
45% of
their total China 16%
expenditure Others 34%
on shopping Indonesia 14%
Australia 6%
Japan 6%
Hong
Kong India 6%
UK 4%
3%
South Korea Malaysia
3% 4%
Thailand
4% Source: Singapore Tourism BoardDBS Asian Insights
SECTOR BRIEFING 25
31
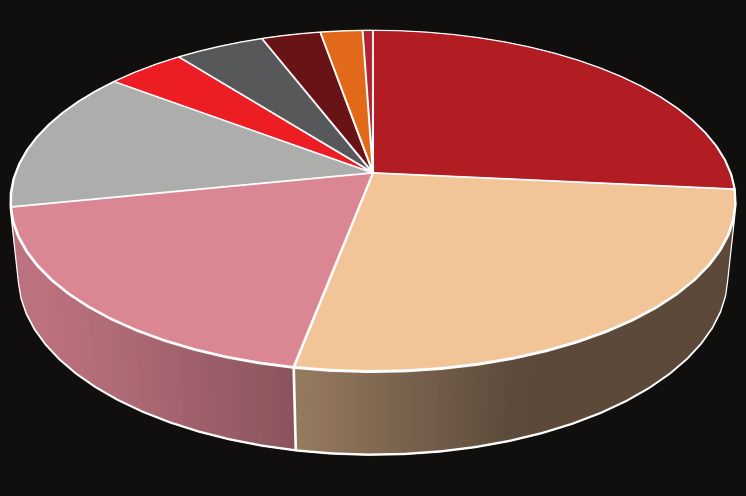
…as they splurge on shopping. In contrast to the overall average of 23% in the first nine
months of 2015, Chinese tourists spend an astounding 45% of their total expenditure on
shopping, effectively allocating a smaller proportion of their budget for accommodation
relative to peers from other regions.
Diagram 26. Tourism expenditure in Singapore by top 10 countries for first nine
months of 2015
100%
90%
80%
70%
60%
50%
40%
30%
20%
10%
0%
Accommodation Shopping Food & Beverage Others
Source: Singapore Tourism Board
Similarly for Thailand... Following the brief dip in per-capita tourism receipts observed
in 2009, the daily expenditure of visitors has been rising consistently, which implies that
Thailand has been seeing some success in its ongoing efforts to attract higher-quality
tourists (as opposed to its traditional image as a low-cost destination).
Diagram 27. Tourism receipts (Thai baht per day per capita)
6,000
5,500
5,000
4,500
4,000
3,500
2008 2009 2010 2011 2012 2013 2014 1H15
Total ASEAN China Europe
Source: Tourism Authority of ThailandDBS Asian Insights
SECTOR BRIEFING 25
32
Accommodation, shopping, and food and beverage (F&B) are major expenditures.
On average, for the first half of 2015, accommodation, shopping, and F&B accounted for
more than 70% of Chinese tourists’ expenditure. Most notably, average expenditure on
accommodation has been trending steadily upward from 1,190 baht in 2008 to 1,473 baht
in the first half of 2015, which appears favourable for Thailand’s hotel industry.
Diagram 28. Spending pattern of Chinese visitors in Thailand in the first half of 2015
Miscellaneous
Sightseeing
2%
6%
Local Transport
9% Accommodation
Entertainment 26%
12%
Food & Beverage
18% Shopping
27%
Source: Tourism Authority of Thailand
Chinese arrivals into Thailand, Singapore, and Malaysia remain strong, indicating
firm growth momentum. In the first three months of 2016, the number of Chinese
tourists visiting Malaysia rose by an impressive 35% y-o-y. Meanwhile, Singapore saw 47%
y-o-y growth in Chinese tourists. Over the same period, Chinese arrivals into Thailand also
grew by more than 29% y-o-y.DBS Asian Insights
SECTOR BRIEFING 25
33
Making ASEAN Even More Attractive
Rising consumerism – Chinese travellers a force to be reckoned with. China’s
outbound tourist numbers has grown rapidly at a 14.5% CAGR over the last decade, as
departures surged from 31 million in 2005 to 120 million by 2015.
With rising disposable incomes and changing consumer habits – especially with the growing
proportion of working-age millennials – fuelling consumption, the rise in outbound Chinese
travel shows no signs of stopping and is likely to extend its formidable growth ahead.
To capitalise on the expected growth in the lucrative Chinese tourism segment over the
long term, we have identified three critical areas of development for ASEAN:
(i) Build quality attractions and promote culture
Building on the ASEAN edge. Comprising ten member-nations, ASEAN is home to
37 UNESCO World Heritage sites – boasting a host of natural attractions such as Ha
Long Bay in Vietnam, Angkor Wat in Cambodia, and the historic city of Ayutthaya in
Thailand – and is also rich in cultural diversity. With plenty to offer, ASEAN needs to
step up marketing efforts to cohesively promote the region as a single destination for
well-heeled Chinese.DBS Asian Insights
SECTOR BRIEFING 25
34
Investing in tourism infrastructure. The availability of, and accessibility to, modern
comforts, amenities, and attractions could further cement the allure of ASEAN as a
destination. Over the last five years, some of the key attractions that were launched or
refreshed by member-countries include:
Country Attraction Launch
River Cruise MV Sentosa 2014
Brunei
Revamped Jerudong Park Playground 2014
Cambodia Grand Panorama Museum 2014
Indonesia International Convention and 2014
Indonesia Exhibition Center
Ancol Dreamland 2011
The Shore Oceanarium Meleka 2014
Malaysia
Legoland Malaysia
®
2012
Philippines City of Dreams Manila 2014
Singapore Gardens by the Bay 2012
Thailand Central Plaza Nakhon Ratchasima 2015
Vietnam Grand Ho Tram Strip 2013
Source: Various news agencies
Major upcoming tourism infrastructure planned over the next two years include:
Country Attraction Launch
Indonesia Funtasy Island Resorts 2016
Movie Animation Park Studio 2016
Malaysia
20th Century Fox World 2017
Philippines Manila Bay Resorts 2016
Singapore Changi Jewel 2016
Thailand Rama IX Super Tower 2018
Source: Various news agenciesDBS Asian Insights
SECTOR BRIEFING 25
35
(ii) Have tourism-friendly policies in place
Stimulating demand with the right policies. According to WTTC, visa policies
are among the most important policies that influence international tourism.12 Leisure
travellers see visas primarily as a formality with inherent costs – both direct and indirect
– and, when deemed to be too high, could serve as a major deterrent to prospective
visitors.
While most governments prefer to maintain the use of entry visas – which are often
useful in enhancing border security, controlling the length of stay and activities of
travellers, as well as generating revenue – we believe that there is room to improve
existing visa policies and processes, which could boost visits significantly.
Recommended visa reforms. An analysis jointly conducted by the UNWTO
and WTTC identified some important areas of opportunity for entry visas such as
improving the delivery of information, facilitating current visa processes, instituting
eVisa programmes, and establishing regional agreements.
Regional agreements would essentially allow travellers from a third country to move
freely between member-countries, once they have been admitted by one of the
participating countries. We also note that such agreements have already been ratified
for some members of the ASEAN region.
Pulling Chinese visitors through easier tourist visas. With the rising prominence of
China as a key source market, most governments have been easing visa requirements
for Chinese tourists progressively.DBS Asian Insights
SECTOR BRIEFING 25
36
Diagram 29. Visa policies for Chinese tourists visiting ASEAN
Country Visa policy Max. Duration
Visa on arrival (subject to prior
Brunei approval through travel agent 14 days
or local guarantor)
Cambodia Visa on arrival 30 days
Indonesia Visa-free 30 days
Laos Visa on arrival 30 days
Visa-free (Mar to Dec 2016 only) 15 days
Malaysia
Visa required (E-Visa available) 30 days
Myanmar Visa required (E-Visa available) 30 days
Philippines Visa required 30 days
Singapore Visa required (E-Visa available) 30 days
Thailand Visa on arrival 15 days
Vietnam Visa required (E-Visa* available) 90 days
*Note that the E-visa application process for Vietnam varies slightly
Source: Embassies and tourism agencies of respective countries
(iii) Increase connectivity
More direct flights between ASEAN and Chinese cities. In the hope of generating
higher Chinese inbound travel, the tourism boards of various ASEAN member-
countries have been working more closely with LCCs and Chinese carriers to increase
connectivity between their respective countries and Chinese cities, especially Tier 2
and 3 cities, whose growing middle class populations would have higher disposable
income and greater propensity to travel.
In 2016, AirAsia commenced new flights from Wuhan to Kota Kinabalu, while AirAsia
X shared plans to launch two more routes to China in the second half of the year.
Boosting airport infrastructure. ASEAN governments are making concerted efforts
to expand major airports to cater to growing visitor arrivals, and for some countries,
to alleviate already congested airports. These efforts generally involve:
a) expanding the current airport;
b) promoting and upgrading a secondary airport; or
c) a combination of both.DBS Asian Insights
SECTOR BRIEFING 25
37
Singapore and Malaysia are focused on expanding capacity at the current capital
airports (given ample land around the current sites), while Indonesia and Thailand
are employing a combination of upgrading works and the use of nearby secondary
airports to cater for future growth.
In the case of the Philippines, the government has been trying to persuade more
airlines to use the nearby Clark International Airport as a gateway, while also planning
to upgrade other regional airports around the country.
Diagram 30. ASEAN 5’s capital airports arrivals versus capacity
100 95
90 86
80 75
70 66 65
60
60 55 54 53
49
50 45
40 34 31 31
30 26
20
10
0
Singapore Jakarta Bangkok Kuala Manila
Lumpur
2015 Arrivals 2015 Capacity Expansion by 2020
Source: CAPA, Innovata
For Thailand’s Suvarnabhumi Airport, demand (53 million passengers in 2015) has
quickly exceeded capacity (45 million passengers) despite a recent upgrade and plans
are afoot to increase capacity to 60 million by 2017. At the same time, Don Mueang
Airport (the previous capital airport of Thailand) officially reopened in 2012 and can
handle up to 30 million passengers currently with its two terminals, helping to ease
the situation at Suvarnabhumi.
Indonesia has ongoing expansion plans for its Soekarno-Hatta Airport, to upgrade its
capacity to 65 million passengers by 2020, against its end-2015 capacity of 26 million
(by end-2016 this should improve to 38 million). This should help ease the situation
for ASEAN’s most congested airport, which handled 54 million passengers in 2015.
The fact that secondary airport Halim Perdanakusuma started serving domestic flights
from 2014 also alleviated the crunch.DBS Asian Insights
SECTOR BRIEFING 25
38
The Philippines’ main airport Ninoy Aquino International Airport has operated at or
beyond its capacity of 31 million passengers for a number of years. Short-term plans
to lessen congestion have revolved around promoting Clark International Airport as
an alternative gateway. The government is also studying a proposal to develop the
Danilo Atienza Air Base into Manila’s new international gateway with a terminal that
can handle 50 million passengers a year and two runways.
Singapore already has plans to expand its Changi Airport from the current capacity
of 66 million passengers per year to 86 million by 2020 (and 132 million by 2025).
Assuming 5% per annum growth in arrivals, this would cater for growth beyond the
next decade. Meanwhile, Malaysia’s Kuala Lumpur International Airport is also catering
for future growth by planning to hit an annual capacity of 95 million passengers by
2020, nearly double the actual throughput of 49 million passengers in 2015.
Besides plans for the capital airports of the ASEAN 5, there are numerous other
planned expansions or new airports in the works around the region, as well as recently
completed expansions. These recent completions or plans are definitive proof that
ASEAN governments are planning well ahead to cater for the expected growth in
travel, particularly in tourist arrivals.You can also read