Aquila European Renewables Income Fund Plc 1H20 Results
←
→
Page content transcription
If your browser does not render page correctly, please read the page content below
Aquila European Renewables Income Fund Plc

1H20 Results

FOR PROFESSIONAL INVESTORS ONLY | CONFIDENTIAL | © 2020 AQUILA CAPITAL   1
Table of Contents

1   1H20 Performance Highlights

2   Portfolio

3   Financial and Operating Performance

4   Valuation

5   Conclusion

6   Appendix

FOR PROFESSIONAL INVESTORS ONLY | CONFIDENTIAL | © 2020 AQUILA CAPITAL   2

Aquila European Renewables Income Fund Plc (the “Company” or “AERIF”)

                                                                                                      − AERIF seeks to generate stable returns, principally in the form of
                                                           Investment Objective                         income distributions, by investing in a diversified portfolio of
                                                                                                        renewable energy infrastructure investments

                                                                                                  − Direct asset exposure to wind, solar PV and hydro technologies
                                                     Diversified Renewables                       − Exclusively European focused
                                                     Portfolio                                    − Targeting a high percentage of contracted revenues (PPA, government
                                                                                                    regulated tariffs/green certificates)

                                                                                             −   Listed on the London Stock Exchange in 2019
                                                                                             −   Current market capitalization of EUR 194.4 million as at 30 June 2020
                                              London Listed                                  −   Diverse shareholder base
                                                                                             −   Awarded the Green Economy stamp by the London Stock Exchange

                                                                                         − FY20: dividend target of 4.0 cents per ordinary share
                                      Investment         Returns1                        − FY21: targeting a dividend of 5.0 cents per ordinary share, with the aim of
                                                                                           increasing this progressively over the medium term

                               Environmental, Social and                             − External Board and Authorised Investment Fund Manager
                                                                                     − Fully regulated Investment Adviser
                               Governance                                            − Committed to the transition towards the green economy

                                                                               − Aquila Capital, part of Aquila Group is an experienced and long-term investor – over
                        Experienced Investment                                   EUR 9.6 billion transaction volume in renewable energy transactions
                        Adviser – Aquila Capital                               − In-house asset management and merchant market desk
                                                                               − Enhanced pipeline of opportunities and strong track record of capital deployment

Source: Aquila Capital Investmentgesellschaft mbH, as of 30.06.2020. 1These are targets only and not forecasts. There can be no assurance that these targets can or will be met and they
should not be seen as an indication of the Company’s expected or actual results or returns.

FOR PROFESSIONAL INVESTORS ONLY | CONFIDENTIAL | © 2020 AQUILA CAPITAL                                                                                                                     3
Track Record since IPO

Summary                                                                                       Capital Deployment Since IPO

− Successful initial EUR 154.3 million public offering (IPO) in June 2019                     Rapid capital deployment achieved
− First successful capital raising post IPO, with EUR 40 million raised
                                                                                                                                                 Invested     Committed
  (oversubscribed) in March 2020
                                                                                                                         180
− Rapid capital deployment since IPO – over EUR 160 million invested or                                                  160
  committed up to 30 June 2020                                                                                           140
− Delivering on investment objectives, with an interest in a 197 MW 1                                                    120

                                                                                              EUR m
  portfolio of renewables assets throughout Europe                                                                       100
− Dividend target of 1.5 cents per ordinary share in FY19 achieved                                                        80
                                                                                                                          60
− FY20 dividend target of 4.0 cents per ordinary share unchanged, despite                                                 40
  global COVID-19 pandemic                                                                                                20
                                                                                                                           -
                                                                                                                                Q2 2019     Q3 2019         Q4 2019       Q1 2020     Q2 2020

Dividends per Ordinary Share                                                                  Share Price and NAV Performance

2019 dividend target achieved
                                           Dividend    Target Dividend                                                                    Share Price        NAV per Ordinary Share

                              6.0                                                                                        1.12
   Cents per Ordinary Share

                                                                                                EUR per Ordinary Share
                              5.0                                                                                        1.08
                                                                                                                         1.04
                              4.0                                        Aim
                                                                         of increasing the                               1.00
                              3.0                                        dividend                                        0.96
                                                                         progressively over
                              2.0                                        the medium term                                 0.92
                              1.0                                                                                        0.88
                              0.0                                                                                        0.84
                                    2019        2020             2021          2022+

Source: Aquila Capital Investmentgesellschaft mbH, as of 30.06.2020. 1Proportional share as at 30.06.2020.

FOR PROFESSIONAL INVESTORS ONLY | CONFIDENTIAL | © 2020 AQUILA CAPITAL                                                                                                                          4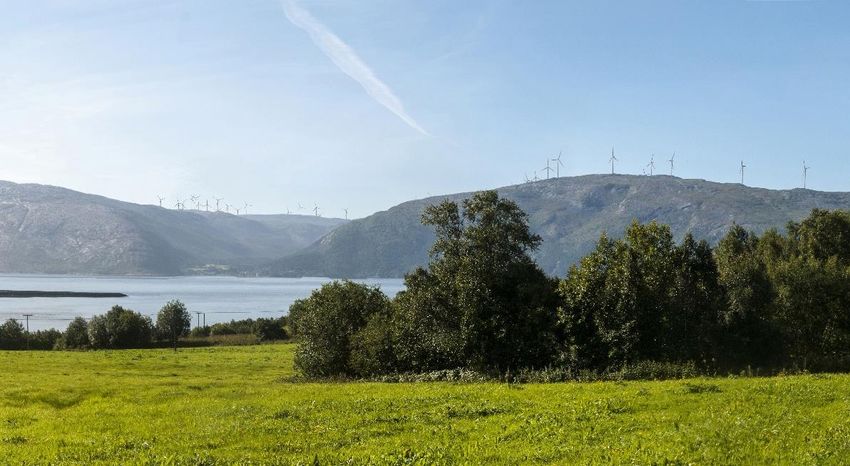
1H20 Highlights

 Portfolio                                                       1H20 Financial Performance                                       Other
− Portfolio expanded to six investments (note                   − Dividend per ordinary share: 1.5 cents1                        − Successful capital raising of EUR 40
  Sagres comprises 21 separate plants), with                    − Dividend cover: 1.9x                                             million completed in March 2020
  a total production capacity of 197 MW                                                                                          − Leverage as a percentage of GAV: 30.0%
                                                                − Dividend per ordinary share target for
− 1H20 power generation of 230.1 GWh,                             FY20: 4.0 cents                                                  (max leverage – 50.0% of GAV)
  11.0% above budget                                                                                                             − Compliance with all necessary investment
                                                                − NAV per ordinary share: 98.6 cents
− Two acquisitions completed during 1H20:                         (December 2019: 102.7 cents)                                     restrictions as outlined in the IPO
     ▪ Svindbaek II – 9.6 MW operating wind                                                                                        prospectus
                                                                − Ordinary share price premium / discount to
       farm in Denmark (99.8% interest)                           NAV: 1.9%2                                                     − First annual general meeting held, with all
     ▪ The Rock – 400 MW construction wind                                                                                         resolutions approved with a significant
                                                                − Ongoing charges (as a % of NAV): 1.3%3                           majority
       farm in Norway (13.7% interest)
− Production and asset availability largely                                                                                      − Kempen & Co initiated coverage on
  unaffected by COVID-19                                                                                                           AERIF on 5 August 2020, representing the
                                                                                                                                   second broker to cover the Company
− No major health and safety incidents
  observed on the portfolio

Source: Aquila Capital Investmentgesellschaft mbH, as of 30.06.2020. 1Based on dividends paid and declared relating to 1H20. 2Calculation is based on closing share price as of
30.06.2020. 3Calculation is based on average NAV over the period.

FOR PROFESSIONAL INVESTORS ONLY | CONFIDENTIAL | © 2020 AQUILA CAPITAL                                                                                                            5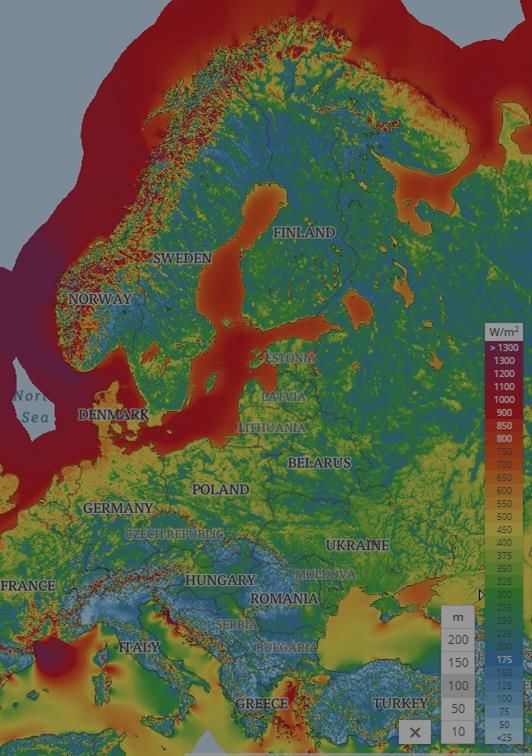
Acquisitions During 1H20

                                                                                                                                               Expected layout ©Morten Selnes, Norconsult

Svindbaek II                                                                                      The Rock
Technology: Wind                                                                                  Technology: Wind

Country: Denmark                                                                                  Country: Norway

Capacity: 9.6 MW                                                                                  Capacity: 400 MW

Status: Operational                                                                               Status: Construction

COD: December 2018                                                                                COD: Q4 2021

Energy Offtake: Feed-in premium for c. 9 years                                                    Energy Offtake: 15 year Power Purchase Agreement

Acquisition Date: 23 March 2020                                                                   Acquisition Date: 5 June 2020

Acquisition Price: EUR 13.2 million                                                               Acquisition Price: Undisclosed1

Ownership: 99.8%                                                                                  Ownership: 13.7%

Source: Aquila Capital Investmentgesellschaft mbH, as of 30.06.2020. 1Acquisition price undisclosed at vendor’s request for confidentiality.

FOR PROFESSIONAL INVESTORS ONLY | CONFIDENTIAL | © 2020 AQUILA CAPITAL                                                                                                               6
Environmental and Social

AERIF – Environmental, Social and Governance (“ESG”) Approach                              AERIF – Portfolio Contribution to the Green Economy1

− We are a responsible investor, ensuring that ESG criteria is incorporated
  into our day-to-day investment decisions
− We aim to provide institutional investors with long-term and sustainable
  alternative investment solutions in the area of renewable energy
− Since our IPO in 2019, we have been committed to sustainable investing.
  This is reflected across our investment philosophy and approach,
  including the selection of our investment adviser, Aquila Capital                                  c. 140,000                                   c. 170,000
− We chose to partner with an investment manager that has sustainable                                 Households supplied                               Tonnes of CO2
                                                                                                       with green energy                               emissions offset
  goals which are aligned to ours
                                                                                                            annually                                      annually
− Aquila Capital has integrated ESG criteria along their whole investment
  process, exploring both ESG risks as well as opportunities
Aquila Group – Recent Initiatives                                                          Aquila Group – Industry Recognition
− Partnering with WWF          − Aquila Capital joined      − Aquila Capital initiated a
  Germany to sponsor             the European Alliance        Transformation Award
  eagles                         for a Green Recovery,        with the aim to finding
− WWF Germany plans to           launched following the       breakthrough concepts
  acquire forest and land        COVID-19 pandemic at         and applicable and
  in Schleswig-Holstein to       the initiative of the        unconventional solutions
  transform it into a nature     Chairman of the              that can be implemented
  reserve, funded by a           European Parliament's        in order to mitigate
  donation from Aquila           Environment                  climate change
  Capital                        Committee

Source: Aquila Capital Investmentgesellschaft mbH, as of 30.06.2020. 1Data presented on a proportional interest basis. CO2 savings are based on the Company’s proportionate share.
Calculations follow the methodology of the Greenhouse Gas Protocol. CO 2 savings of European assets are based on the European average. Household data represents potential number of
households which could be powered by AERIFs share of electricity generated by its portfolio on an annual basis.
FOR PROFESSIONAL INVESTORS ONLY | CONFIDENTIAL | © 2020 AQUILA CAPITAL                                                                                                             7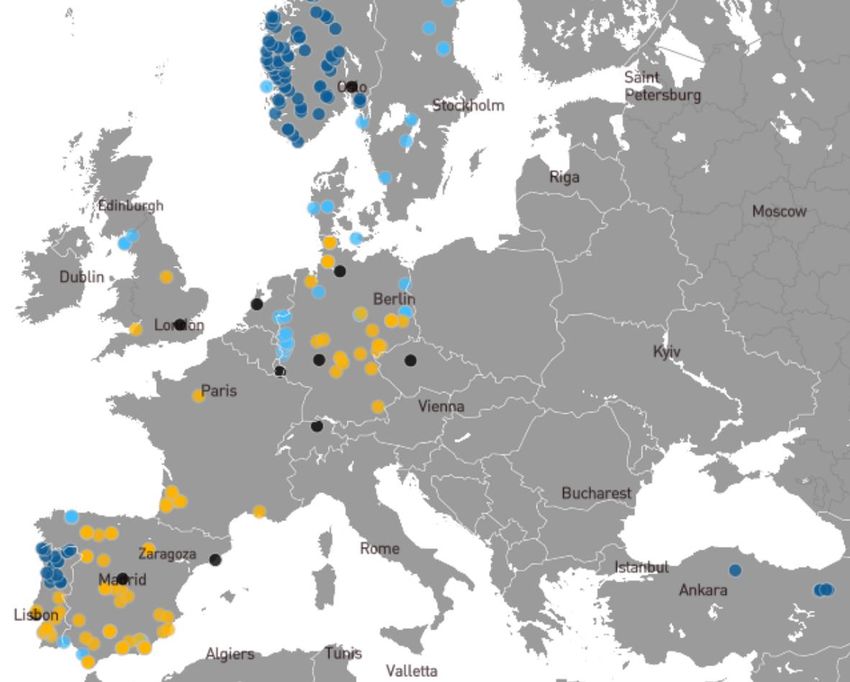
Aquila Group‘s Contribution to the UN Sustainable Development Goals

Providing affordable and clean              Building resilient infrastructure          Creating sustainable cities and          Combating climate change
energy                                      and fostering innovation                   communities

– With one of the largest renewable         – Aquila Group is also committed to        – Aquila Group is making over 40%        – Aquila Group is convinced it can
  energy portfolios in Europe,                making a significant contribution to       of its residential real estate           help tackle climate change and
  Aquila Group is dedicated to                infrastructure renewal                     dwellings accessible to low-income       move the transformation to a low-
  continuously investing in and             – Aquila Group has been investing in         communities                              carbon economy forward
  expanding clean energy sources              scientific research, in particular the   – It furthermore offsets the carbon      – Over the lifetime of its current
  such as solar PV, wind power                digitalization of energy transition        emissions of all its new real estate     portfolio, Aquila Group will produce
  and hydropower                              (Transformation Award)                     units over the course of two years       321 TWh of green energy, which
                                                                                         to make them climate neutral. In         corresponds to supplying 88.4
                                                                                         addition, the Group combines new         million households with electricity
                                                                                         logistic projects with rooftop solar     for one year and an overall
                                                                                         PV and/or district heating/cooling       reduction in CO2 emissions of
                                                                                         whenever possible                        106.9 million tonnes

Source: Aquila Capital Investmentgesellschaft mbH, as of 30.06.2020.

FOR PROFESSIONAL INVESTORS ONLY | CONFIDENTIAL | © 2020 AQUILA CAPITAL                                                                                             8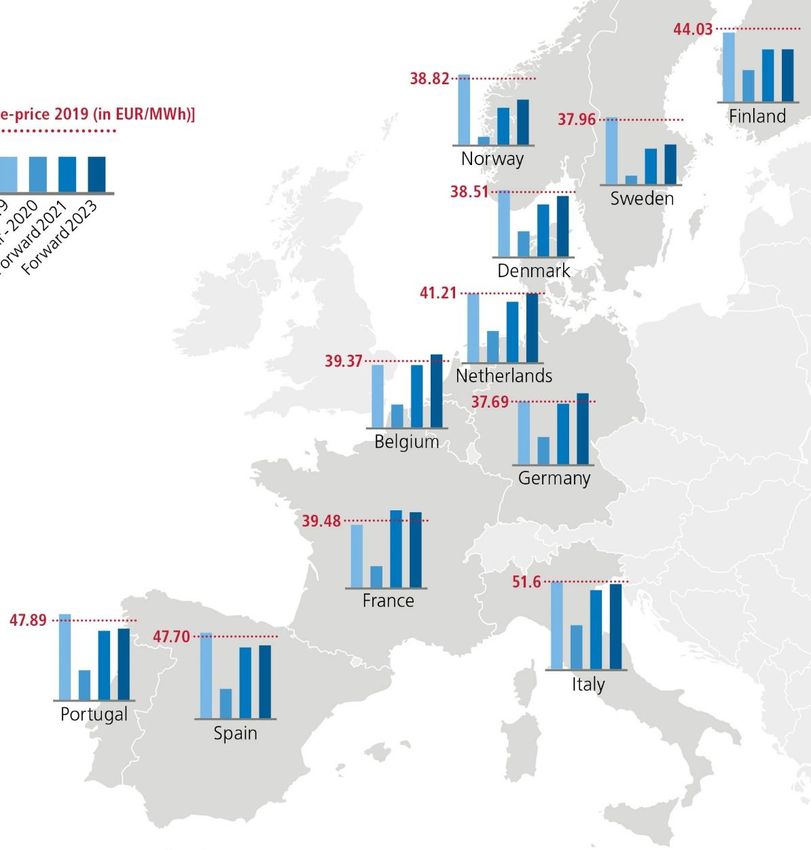
Corporate structure

                                                Investors
                                                                                                                  Investment Advisory
                                                 100%                                                             Agreement
                              Governing                                        AIFM
                              Body                                             Agreement                                        Investment Adviser
 Board of Directors                             AERIF Plc1                                        AIFM
                                                                                                                                (Aquila Capital)

                                                100%

                                                Tesseract Holdings
                                                Limited

                                                Various

                                                Asset entities

Board of Directors                               AERIF Plc                                        Investment Adviser
Independent                                      Listed                                           Full service package backed by a strong professional organization, with
– Operates independently from                    – London Stock Exchange, daily trading           aligned interests
  investment adviser and AIFM                      liquidity                                      − 80+ energy & infrastructure investment professionals
– Responsible for investment decisions                                                            − 26 asset management professionals
                                                 Organisational structure                         − 9 PPA professionals
Senior non-executives                            – Externally managed                             − Investment Adviser fee taken as ordinary shares (net of any tax) for first two
– 4 non-executive board members                  – Limited overhead expenses as                      years post IPO
– Highly experienced                               operational and investment services are
– Appointed by AERIF Plc                           outsourced                                     Local reach
                                                                                                  − 14 regional offices worldwide
Aligned interests                                Cost structure                                   − Deep knowledge of local markets
− Personally invested in AERIF                   – Tiered investment advisory fee: 0.55-
                                                   0.75%, depending on NAV                        Strong deal pipeline
                                                                                                  − Enhanced pipeline of opportunities managed by Aquila Capital and in
                                                                                                     negotiations
Source: Aquila Capital Investmentgesellschaft mbH, as of 30.06.2020. 1Simplified corporate structure shown.

FOR PROFESSIONAL INVESTORS ONLY | CONFIDENTIAL | © 2020 AQUILA CAPITAL                                                                                                               9
Table of Contents

1   1H 2020 Performance Highlights

2   Portfolio

3   Financial and Operating Performance

4   Valuation

5   Conclusion

6   Appendix

FOR PROFESSIONAL INVESTORS ONLY | CONFIDENTIAL | © 2020 AQUILA CAPITAL   10
Portfolio Snapshot

                                                                                                                         Key Statistics

                                                                                                                         6                                 5
                                                                                                                         Investments                       Under operation

                                                                                                                         1                                 4
                                                                                                                         Under construction                Countries

                                                                                                                         197 MW                            25 – 30
                                                                                                                         Operating    capacity1            Asset life (years)2

                                                                                                                         ~70%                              30%
                                                                                                                         Contracted    revenue3            Leverage4

Source: Aquila Capital Investmentgesellschaft mbH, as of 30.06.2020. 1Proportional share as at 30.06.2020. 2Asset life from commissioning date. 3Approximately 70% of revenue contracted
over the first five years (on a present value basis). 4Leverage as at 30.06.2020, in total representing 30% of Gross Asset Value.

FOR PROFESSIONAL INVESTORS ONLY | CONFIDENTIAL | © 2020 AQUILA CAPITAL                                                                                                               11
Current Portfolio
Project Technology Country Capacity1 Status COD8 Asset Life Equipment Energy Ownership Leverage6 Acquisition
from COD8 Manufacturer Offtaker3 in Asset Date
Tesla Wind energy Norway 150 MW Operational 2013, 25y Nordex PPA2 with 25.9%9 31.2% July
2018 utility / Spot 2019
Sagres Hydropower Portugal 103 MW Operational 1951- n.a.7 Various FiT5 / Spot 18.0%9 44.7% July
2006 2019
Holmen II Wind energy Denmark 18 MW Operational 2018 25y Vestas FiP4 / Spot 100.0% 43.9% July
2019
Olhava Wind energy Finland 35 MW Operational 2013- 27.5y Vestas FiT5 / Spot 100.0% 53.6% September
2015 2019
Svindbaek I + II Wind energy Denmark 32 MW Operational 2018 25y Siemens FiP4 / Spot 99.9% 20.9% December
2019 & March
2020
The Rock Wind energy Norway 400 MW Construction 2021 30y Nordex PPA2 / Spot 13.7%9 0.0%10 June
2020
Source: Aquila Capital Investmentgesellschaft mbH, as of 30.06.2020. 1Installed capacity at 100% ownership. 2PPA = Power Purchase Agreement. 3Price hedging will be implemented when
market exposure increases significantly. 4Feed-in premium is structured as a Contract for Difference (CfD) at the spot market price. 5Feed-in tariff is structured as a Contract for Difference
(CfD). 6Leverage drawn as a percent of investment fair value as at 30.06.2020, in total representing 30% of Gross Asset Value. 721 Individual assets; average concession life of 12 years
remaining. 8COD = Commissioning date. 9Remaining shares are held by entities managed and/or advised by Aquila Capital. 10Maximum envisaged leverage throughout The Rock’s
construction and operations is estimated at 47%.
FOR PROFESSIONAL INVESTORS ONLY | CONFIDENTIAL | © 2020 AQUILA CAPITAL 12Current Portfolio (cont’d)
Wind Power Density – Europe1 Hydrology – Iberian Peninsula2
Asset portfolio
located in regions
with a strong
matching natural
resource
Solar Power Irradiation – Europe3
Southern Europe
is an attractive
destination for
solar PV
opportunities
Source: Global Wind Atlas (2020), Global Solar Atlas (2020), AEMET (2020). 1Mean wind power density. 2Average total precipitation in the Iberian Peninsula (1971-2000).
3Global horizontal irradiation.
FOR PROFESSIONAL INVESTORS ONLY | CONFIDENTIAL | © 2020 AQUILA CAPITAL 13Portfolio Allocation1
Technology Geography
10.9%
10.9% 17.1%
Portugal
Hydro Norway
Wind Denmark 31.0%
Finland 41.1%
89.1%
Asset Status Present Value of Contracted vs. Non-Contracted Revenue (5 Years)2
14.6%
17.5%
30.5%
Operating Fixed price PPA
Under Construction Government regulated
Governmental subsidy tariff
Market
85.4%
52.0%
Source: Aquila Capital Investmentgesellschaft mbH. 1Allocation based on the fair value of the assets as of 30.06.2020. 2Asset revenues are discounted by the weighted average of all
discount rates used for the asset valuations as of 30.06.2020.
FOR PROFESSIONAL INVESTORS ONLY | CONFIDENTIAL | © 2020 AQUILA CAPITAL 14Attractive Contracted Revenue Base
Strong Earnings Visibility Pro-active Management of Merchant Price Exposure
− Significant earnings visibility underpinned by a large contracted revenue − Pro-active approach to managing merchant risk
base
− Focus on replacing expiring contracted revenues with PPAs, well in
− Approximately 70% of revenue contracted over the first five years (on a advance of expiry
present value basis)
− Supported by Aquila Capital’s in-house Merchant Market Desk
− Contract counterparties include high credit rating sovereign states and
corporates
100%
90%
Contracted revenue % (LHS)
Revenue Forecast (EUR m)
80%
Contracted Revenue %
70%
60%
50%
40%
30%
20%
10%
0%
2020 2021 2022 2023 2024 2025 2026 2027 2028 2029
Government regulated
Governmental subsidy Fixed price PPA Market Contracted revenue
Revenue%%(LHS)
tariff
Source: Aquila Capital Investmentgesellschaft mbH, as of 30.06.2020. These are targets only and not forecasts. There can be no assurance that these targets can or will be met and it
should not be seen as an indication of the Company's expected or actual results or returns. Data as of 30.06.2020.
FOR PROFESSIONAL INVESTORS ONLY | CONFIDENTIAL | © 2020 AQUILA CAPITAL 15Aquila Capital’s Merchant Market Desk (“MMD”)
PPA market is getting competitive Non-PPA products are becoming important
– Competition for PPAs is increasing – Power exchanges try to substitute part of PPA market
– Corporate buyers are becoming more sophisticated – Cross-border/virtual PPAs are seeing interest from corporates
– Smaller corporate buyers require more effort and new solutions – Elcerts and GoOs have been very volatile and requires active
management and research expertise
– Limited risk demand from utilities
Aquila's
Response
A strategic and in-house expert approach Building capabilities in energy risk management
towards the PPA market
– A dedicated PPA-team, responsible for sourcing and structuring – Short and medium-term power sale
PPAs and other hedge products – Sale and hedging of green products
– A Europe-wide team, but with local origination in target markets – Energy portfolio management
– Strategic PPA sourcing (“PPAs first, assets second”) – Power valuation and risk assessments
– Active hedging and optimisation through project lifetime
– Derivative structures
AERIF benefits from Aquila Capital’s Merchant Market Desk, both in relation to the
existing asset portfolio, as well as new investment opportunities
Source: Aquila Capital Investmentgesellschaft mbH, as of 30.06.2020.
FOR PROFESSIONAL INVESTORS ONLY | CONFIDENTIAL | © 2020 AQUILA CAPITAL 16Aquila Capital’s Merchant Market Desk (cont’d)
PPA sourcing and structuring Energy and market risk management
• Run competitive off-taker selection processes through our • We measure, monitor and manage merchant exposure
extensive network in the energy industry through selling at spot, entering into short-term PPAs and
analysing the suitability of financial products, such as options
• Quantitative evaluation of the offers in term of risk and reward
and forwards
and propose an optimal solution for our investors
• Constant dialogue with investors, banks and off-takers on
• Individual view of market price risks and opportunities and
developing new and innovative structures for risk
delivery obligations in order to find optimal structure of a PPA
diversification and enabling capture of more of the upside
• Working closely with project finance to pre-assess and
• Risk analysis and portfolio optimization of different Aquila
determine which structures are bankable to avoid unnecessary
funds
cost or delays
Market and pricing analysis FX and interest rate hedging strategies
• We provide pricing for Aquila Group projects, backed by • MMD’s FX and interest rate specialist works across all asset
several third-party power price forecasts classes to advise our investment teams on how to hedge
risk in all transactions and portfolios
• Rigorous analysis and monitoring of the main drivers for power
prices • Where appropriate, interest rate and FX derivatives are
employed to manage asset exposures with respect to
• Monitoring policy/regulatory developments in relevant markets adverse interest rate and foreign exchange moves
at EU and national level
• We have also started building a team to execute power
• Negotiation and structuring of Elcerts and GoOs hedging strategies in liquid markets, as a complement to
PPAs
The MMD offers services throughout the lifetime of a project and is the hub for all
hedging activities across Aquila Group and its managed funds (including AERIF)
Source: Aquila Capital Investmentgesellschaft mbH, as of 30.06.2020.
FOR PROFESSIONAL INVESTORS ONLY | CONFIDENTIAL | © 2020 AQUILA CAPITAL 17Table of Contents 1 1H 2020 Performance Highlights 2 Portfolio 3 Financial and Operating Performance 4 Valuation 5 Conclusion 6 Appendix FOR PROFESSIONAL INVESTORS ONLY | CONFIDENTIAL | © 2020 AQUILA CAPITAL 18
Production Performance

 Monthly Portfolio Performance vs. Budget (%)1

80%
                                                                                                                                    1H2020 Performance
60%

40%

20%

 0%

-20%

-40%

-60%

-80%
         Jun-19        Jul-19        Aug-19        Sep-19        Oct-19        Nov-19        Dec-19        Jan-20        Feb-20       Mar-20         Apr-20       May-20        Jun-20

                                                                                    Wind         Hydropower

   − Stronger than expected wind conditions in the Nordics observed in Q1 2020, partially offset in Q2 2020 which experienced below-average levels
   − Beneficial hydrology levels in Portugal observed in Q1 2020, with Q2 2020 performance largely in-line with budget
   − Hydro performance also benefitted from realized efficiencies as a result of a new O&M provider (automation, plant reconfiguration)
   − Since IPO in June 2019, the portfolio has benefitted from geographic diversification which assists in mitigating monthly variances in weather
   − This benefit is expected to materialise further as the portfolio expands and other technologies are added (e.g. solar PV)

 Source: Aquila Capital Investmentgesellschaft mbH, as of 30.06.2020. 1AERIF share of actual production (for all assets) versus budget, note operational data in some cases may pre-date
 AERIFs ownership of the asset.

 FOR PROFESSIONAL INVESTORS ONLY | CONFIDENTIAL | © 2020 AQUILA CAPITAL                                                                                                                    19
Operating Performance
Performance Summary Production Summary 1H20
− Total 1H20 production of 230.1 GWh, 11.0% above budget Technology Country Electricity Budget Performance
Production (GWh) vs. Budget
− Wind production accounted for approximately 80% of production during (GWh) (%)
the period
Denmark,
− Outperformance largely driven by higher than expected wind performance Wind Norway, 185.9 166.2 11.9%
in the Nordic regions in Q1, which generated 11.9% more production Finland
versus budget
Hydropower Portugal 44.1 41.2 7.2%
− In 1H20 the Portuguese hydro power portfolio produced 7.2% more
electricity than budget
− Downward pressure on realized prices observed – a combination of Total 230.1 207.4 11.0%
supply and demand shocks led to a sharp decrease in commodity and
electricity prices
COVID-19
− Only a portion of the Company’s revenue was impacted by adverse price
movements, as a result of government tariffs and a PPA in place − The AERIF Board and all relevant stakeholders have implemented
procedures to ensure the safety and well being of all employees
− Successful implementation of a number of operational initiatives as a
result of pro-active asset management, resulting in cost and efficiency − No impact on operations, with all facilities operating at expected availability
improvements levels
− No major health or safety incidents during the period − Assets continue to produce electricity, regardless of market conditions
Source: Aquila Capital Investmentgesellschaft mbH, as of 30.06.2020.
FOR PROFESSIONAL INVESTORS ONLY | CONFIDENTIAL | © 2020 AQUILA CAPITAL 20Pro-active Asset Management to Drive Shareholder Value
Holmen II Olhava Sagres Svindbaek Other
− Aquila’s asset management − Recent extension of an − Recently appointed a new − Aquila’s asset management − In early 2020, during COVID-
team have been working expiring TCM contract O&M provider team registered Svindbaek in 19 Aquila Capital’s asset
closely with local technical June 2020 for participation in management team worked
− Following a competitive − Following a period of closely with the technical and
managers and the trader to the control energy market
tender process, the contract planning and collaboration commercial operating
optimize compensation (“Regulerkraft”)
was extended with a 3 year with Aquila Capital’s asset managers in order to
payments payable to the
term at a ~70% reduction on management team, the O&M − The Regulerkraft is attractive continue to ensure the best
asset during remote shut possible operation of the
a cost per WTG basis provider was able to increase for asset owners as it allows
downs (as required by plants
plant efficiency and output an operator to benefit from
participating in the network
balancing market)
performance via a plant fixed compensation − Key focus areas included
reconfiguration across the payments during shut downs contractor safety and
portfolio (including software (as required by participating wellbeing, operational
regulation, automation) in the network balancing matters and component
market), whilst also availability
preserving full load hours − No negative impact from
from the subsidy scheme for operations as a result of
a later period COVID-19
Source: Aquila Capital Investmentgesellschaft mbH, as of 30.06.2020.
FOR PROFESSIONAL INVESTORS ONLY | CONFIDENTIAL | © 2020 AQUILA CAPITAL 21Summary Income Statement EUR k 1H20 FY19 (Loss)/gain on investments (6,759) 8,608 Net foreign exchange losses (8) (13) Interest income 2,709 1,609 Investment advisory fees (716) (654) Other expenses (549) (810) Profit on ordinary activities before finance costs and taxation (5,323) 8,740 Finance costs (161) (199) Taxation - - Profit on ordinary activities after taxation (5,484) 8,541 Return per Ordinary Share (cents) (3.80c) 7.07c − Given AERIF is classified as an ‘investment entity’ in accordance with IFRS 10, it is required to hold subsidiaries at fair value and accordingly does not consolidate them − Accordingly, AERIFs accounts are presented on a stand-alone basis (representing Aquila European Renewables Income Fund Plc) − Interest income reflects interest earned on shareholder loans from AERIF to its wholly owned subsidiary, Tesseract Holdings Limited. These loans are typically used to finance AERIFs acquisitions. Tesseract Holdings Limited represents the holding entity in relation to AERIFs portfolio of assets − The valuation of investments declined by EUR 6.8 million1 in 30 June 2020 Source: Aquila Capital Investmentgesellschaft mbH, as of 30.06.2020. 1Includes EUR -1.6m relating to net interest (expense)/income in relation to financial instruments and other expenses. FOR PROFESSIONAL INVESTORS ONLY | CONFIDENTIAL | © 2020 AQUILA CAPITAL 22
Summary Balance Sheet

EUR k                                                                                     1H20                                FY19

Assets
Cash                                                                                      41,548                              38,862
Trade and other receivables                                                               2,953                               1,927
Portfolio value                                                                           146,750                             118,660

Liabilities
Creditors                                                                                 (481)                               (532)

Net assets                                                                                190,770                             158,917
Net assets per Ordinary Share (cents)                                                     98.6c                               102.7c

− Portfolio value (EUR 146.8 million) reflects the value of the financial instruments (equity and shareholder loans) held by AERIF in Tesseract
  Holdings Limited as at 30 June 2020. In turn, these values are derived from the valuation of AERIFs underlying asset portfolio
− Note part of AERIFs existing cash on hand (EUR 41.5 million) will be used to fund future capital calls in connection with the construction of The
  Rock
− Receivables mainly include interest payments from the shareholder loans that AERIF has issued to Tesseract Holdings Limited
− Liabilities consist mainly of trade payables
− Currently, there is no fund-level debt in place

Source: Aquila Capital Investmentgesellschaft mbH, as of 30.06.2020.

FOR PROFESSIONAL INVESTORS ONLY | CONFIDENTIAL | © 2020 AQUILA CAPITAL                                                                                23
Summary Cash Flow

EUR k                                                                                       1H20                                FY19

Operating activities
Profit on ordinary activities before taxation                                               (5,484)                             8,541
Adjustment for unrealized losses / (gains) on investments                                   6,759                               (8,608)
Working capital adjustments                                                                 (1,077)                             (1,395)
Net cash flow from / (used) in operating activities                                         198                                 (1,462)

Purchase of investments                                                                     (34,849)                            (110,052)

Financing activities
Proceeds of share issues                                                                    40,660                              154,659
Share issue costs                                                                           (710)                               (3,123)
Comments
Dividends paid                                                                              (2,613)                             (1,160)

− [ cash
Net ]    flow from financing activities                                                     37,337                              150,376
Movement in cash                                                                            2,686                               38,862
Closing cash balance                                                                        41,548                              38,862

− Purchase of investments relates to the acquisition cost of Svindbaek II (March 2020) and The Rock (June 2020)
− Dividends of EUR 2.6 million paid in connection with the dividends declared in Q4 2019 and Q1 2020, resulting in dividend cover of approximately 1.9x
− Strong liquidity position as of 30 June 2020, following successful EUR 40 million capital raising in March 2020 – noting that this capital will also be used to
  fund AERIFs ongoing contribution towards The Rock

Source: Aquila Capital Investmentgesellschaft mbH, as of 30.06.2020.

FOR PROFESSIONAL INVESTORS ONLY | CONFIDENTIAL | © 2020 AQUILA CAPITAL                                                                                      24
Gearing and Liquidity

Debt Profile 1H20 (EUR m)                                                                                        Key Debt Metrics 1H20 (EUR m)1
                                                                                                                 Fund level debt
                                                                                                                                                                                          -
                                                                                                                 (AERIF share)
                                                                                190.8      272.6                 Asset level debt
                                                                                                                                                                                    81.9
                                                                                                                 (AERIF share)

                                                                                                                 Total debt                                                         81.9

                                                                                                                 Total debt as a % of GAV                                       30.0%

                                      29.4       10.0       0.0       81.9                                       Investment restriction – maximum
                                                                                                                                                                                50.0%
                                                                                                                 debt as a % of GAV
                            18.2
                 11.1
       13.2                                                                                                      Weighted average debt maturity                            12.6 years

     Sagres      Tesla   Holmen II   Olhava Svindbaek The Rock        Total      NAV       GAV

 − Conservative gearing position, with total non-recourse debt of EUR 81.9 million (AERIF share) as at 30 June 2020, representing 30.0% of GAV
 − Current gearing level within AERIFs maximum limit of 50.0% of GAV (as outlined in the IPO prospectus)
 − No imminent debt maturities – current weighted average debt maturity of 12.6 years
 − Majority of debt is fully amortising, deleveraging over time
 − Conservative hedging position
 − All debt is at the asset level, with no fund-level debt

 Source: Aquila Capital Investmentgesellschaft mbH, as of 30.06.2020. 1Non EUR debt is converted to EUR as at 30.06.2020. Weighted average calculation is based on AERIF share of
 debt.
 FOR PROFESSIONAL INVESTORS ONLY | CONFIDENTIAL | © 2020 AQUILA CAPITAL                                                                                                              25
Table of Contents 1 1H 2020 Performance Highlights 2 Portfolio 3 Financial and Operating Performance 4 Valuation 5 Conclusion 6 Appendix FOR PROFESSIONAL INVESTORS ONLY | CONFIDENTIAL | © 2020 AQUILA CAPITAL 26
Portfolio Valuation – Bridge

Portfolio Valuation Bridge (EUR m)

                                        40.0
                                                                                              1.2
                                                                                                                                                                          190.8

                                                                  (5.2)                                                (2.6)
                                                                                                                                                 (1.5)

              158.9

           NAV FY19                Raised capital        Movement in valuation     Net profit for the period      Dividend paid                 Other 2                 NAV 1H20
                                                            of investments 1

 − EUR 190.8 million NAV as at 30 June 2020, a marginal decline of 2.5% per ordinary share after the payment of dividends, compared to 31 December
   2019
 − On 6 March 2020, the Company raised EUR 40.0 million under its placing programme, increasing the aggregate amount of capital raised since IPO to
   EUR 194.3 million
 − Investment Adviser fees paid in shares to Aquila Capital (further alignment of interest)
 − Valuation of investments declined by EUR 5.2 million in 30 June 2020 (following a EUR 9.1 million increase in the period from IPO to 31 December
   2019), largely due to a reduction in short-term forecast electricity prices, particularly in the short-term as a result of the mild winter experienced in the
   Nordics, combined with lower oil prices and COVID-19
 − Dividends of EUR 2.6 million (1.5 cents per ordinary share) represent Q4 2019 and Q1 2020 dividends paid
 − In addition, the Company declared a further 0.75 cents per ordinary share in relation to the quarter ending 30 June 2020

 Source: Aquila Capital Investmentgesellschaft mbH, as of 30.06.2020. 1Excludes net interest (expense)/income in relation to financial instruments and other expenses which is accounted
 for in “Other”. Includes movement in valuation from Svindbaek II which was acquired in March 2020. 2Includes net interest (expense)/income in relation to financial instruments and other
 expenses.
 FOR PROFESSIONAL INVESTORS ONLY | CONFIDENTIAL | © 2020 AQUILA CAPITAL                                                                                                                      27
Portfolio Valuation – Key Assumptions
Metric 1H20 FY19
Discount rate Weighted average 7.3% 7.6%
Long-term inflation Weighted average 2.0% 2.0%
Wind (weighted average) 26.3 years1 25.7 years
Asset life (from COD)
Hydropower (weighted average) n.a.2 n.a.2
2 year average – ~EUR 28/MWh 2 year average – ~EUR 41/MWh
Power prices3 Weighted average Long-term forecast – refer below
Long-term forecast – refer below
Real Electricity Price Forecasts – All Assets (Weighted Average)4 Comments
− Majority of forecast price movement observed between FY19 and 1H20 is
60.0
in the first two years
55.0 − Longer-term forecasts (2022+) – marginal decline of c. 2.8% on average
50.0 from FY19 to 1H204
EUR / MWh
45.0
40.0
− Power price forecasts are based on an initial two years of market forward
35.0 pricing, followed by a rolling average of capture rates (i.e. technology and
30.0 country or region-specific power price curves) to reflect the forecasted
25.0 impact of intermittent electricity on power prices and to limit quarterly
20.0 volatility5
15.0 − Power price forecasts are independently sourced from a provider with
10.0 coverage in almost all European markets5
2020 2022 2024 2026 2028 2030 2032 2034 2036 2038 2040 2042
FY19 1H20
Source: Aquila Capital Investmentgesellschaft mbH, as of 30.06.2020. 1Including The Rock and Svindbaek II. 221 Individual assets; average concession life of 12 years remaining.
32 year average forecasts are based on market forward pricing in each of AERIFs relevant markets, weighted based on equity invested. Excludes The Rock. 4FY19 prices adjusted for
inflation to enable a comparison with 1H20 forecasts. 5Relating to the wind assets.
FOR PROFESSIONAL INVESTORS ONLY | CONFIDENTIAL | © 2020 AQUILA CAPITAL 28Table of Contents 1 1H 2020 Performance Highlights 2 Portfolio 3 Financial and Operating Performance 4 Valuation 5 Conclusion 6 Appendix FOR PROFESSIONAL INVESTORS ONLY | CONFIDENTIAL | © 2020 AQUILA CAPITAL 29
European Market Outlook
− During 1H20, a combination of supply and demand shocks led to a
  sharp decrease in commodity and electricity prices, however a price
  recovery is already underway
− Oil price war between Russia and Saudi Arabia, along with the
  resumption of gas transit between Russia and Ukraine led to an
  expansion of supply, while high stocks were still available due to
  weather conditions
− A windy, mild and wet winter led to high wind energy feed-in, a muted
  power demand and substantial hydro balances in the Nordics,
  Pyrenees and Alps regions, resulting in lower demand for fuel, mainly
  gas, adding pressure to the already high levels of storage
− COVID-19
  ▪ Demand shock triggered by the virus, originating in China, one of
    the largest importers of gas, coal, and oil globally
  ▪ Subsequent lockdowns caused demand for commodities/electricity
    in Europe to fall sharply
  ▪ Some European electricity markets experienced price reductions of
    37-90% in March
− Despite these interim shocks, futures markets generally indicate a
  pricing recovery is already underway
  ▪ Degree of pricing recovery is influenced by region specific factors

   AERIF is well positioned to withstand shocks, as a result of its
    diversified portfolio and majority contracted revenue base

Source: Aquila Capital Investmentgesellschaft mbH, as of 30.06.2020, Entsoe; eex; Nasdaq (2020).

FOR PROFESSIONAL INVESTORS ONLY | CONFIDENTIAL | © 2020 AQUILA CAPITAL                             30
European Market Outlook (cont’d)
− AERIF is uniquely positioned to benefit from the longer-term global
energy transition1
Installed Power Generation Capacity in the EU-28 (GW)2
▪ The European Union has been at the forefront of global renewable 1,400
+23% +9%
energy deployment for over two decades
1,200
▪ Europe is an attractive destination for renewables investors as the
region offers diversification, giving access to a broad spectrum of 1,000
risk profiles across a wide pool of assets 66%
800 56%
33%
▪ AERIFs investment mandate is European focused and is supported
by its investment adviser, Aquila Capital who is headquartered in 600
Germany, with an expansive and established footprint, throughout 400
Europe 67%
44% 34%
▪ European leaders continue to support the transition to a low carbon 200
society through an increase of their country’s renewable energy 0
share (RES), which is targeting 32% RES of final energy 2010 2030 Reference 2030 Remap
consumption by 2030 – this will require a substantial increase in
Coal Oil Natural Gas Nuclear Hydropower
power generation capacity
Biomass Solar PV CSP Wind Geothermal
− Climate change and the pressing need for a global energy transition is
expected to gain even further momentum as a result of COVID-19
− In July 2020, 27 European Union leaders agreed on a EUR 750 billion “We must use every tool we have to encourage investment in
stimulus package (2021 to 2023) in light of COVID-19 renewable energy”
▪ A large proportion of the stimulus package is targeting green and
renewable industries
Kadri Simson
▪ All spending must comply with a principle to “do no harm” to
European Commissioner for Energy
European Union green goals and comply with the goal of net-zero
6 May 2020
greenhouse gas emissions by 2050
1Source: Aquila Capital Investmentgesellschaft mbH, as of 30.06.2020. 2Source: IRENA: International Renewable Energy Agency in co-operation with the European Commission as of 2018.
FOR PROFESSIONAL INVESTORS ONLY | CONFIDENTIAL | © 2020 AQUILA CAPITAL 31Renewables as an Asset Class
Highly defensive earnings / investment Attractive risk / return profile Green thematic exposure
profile
– Low historical correlation with other asset – Attractive risk adjusted returns above risk free – Direct exposure to the green economy
classes rates – Positive contribution towards the United
– Low annual volatility – production is sourced Nation’s Sustainable Development Goals
from readily available, free sources (wind, sun,
rainfall) and isn’t reliant on market dynamics
– Revenues can be contracted to high credit Positive macroeconomic exposure Diversification
counterparties (utilities, corporates in the form
of PPAs) or governments (via subsidy
schemes) to further reduce earnings volatility
– Large portion of operating costs can be fixed in
the form of long-term contracts
– Electricity prices are generally correlated with – Additional form of diversification, beyond
inflation traditional core infrastructure investments
– Exposure to fundamental long-term trends in
electricity supply and demand
Source: Aquila Capital Investmentgesellschaft mbH, as of 30.06.2020.
FOR PROFESSIONAL INVESTORS ONLY | CONFIDENTIAL | © 2020 AQUILA CAPITAL 32Enhanced Pipeline Overview 1
# Asset Country Capacity COD Initial Project status − Attractive pipeline of opportunities potentially
Technology remuneration available for AERIF1
2
1 Onshore Wind NOR 400 MW 2021 PPA Managed by Aquila Capital − Opportunities comprise a mixture of assets
2 Onshore Wind FIN 43 MW 2021 PPA Managed by Aquila Capital managed by Aquila Capital, as well as
opportunities direct from third party vendors
3 Solar PV ESP 143 MWp 2021 PPA Managed by Aquila Capital
4 Solar PV PRT 70 MWp 2019 PPA Managed by Aquila Capital − Attractive mixture of assets across the full
technology spectrum, supported by either PPA or
5 Solar PV PRT 62 MWp 2019 PPA Managed by Aquila Capital government tariffs
6 Solar PV ESP 50 MWp 2021 PPA Managed by Aquila Capital
3
− Opportunity to add new technologies to the
7 Solar PV PRT 20 MW 2017-2020 PPA Managed by Aquila Capital portfolio (solar PV), as well as new country
exposure (Greece, Spain, Sweden)
8 Onshore Wind GRE 255 MW 2009-2021 FiT + FiP Negotiations
9 Onshore Wind GRE 82 MW 2020 FiT + FiP Negotiations − AERIF and its Investment Adviser have a
proven track record in successful capital
10 Onshore Wind SWE 71 MW 2020 PPA Negotiations
deployment
11 Onshore Wind SWE 70 MW 2023 PPA Negotiations
12 Onshore Wind PRT 39 MW 2009-2022 FiT Negotiations
13 Hydropower ESP 85 MW Various FiP + PPA Negotiations
14 Hydropower PRT 33 MW 1992-2000 PPA Negotiations
15 Hydropower SWE 26 MW 1940-1969 PPA Negotiations
Source: Aquila Capital Investmentgesellschaft mbH, as of 30.06.2020. 1Although certain assets have been identified by the Investment Adviser as being potentially available for acquisition
by the Company (the “Enhanced Pipeline”), unless stated otherwise, no assets have contracted to be acquired by the Company, there are no binding commitments or agreements to
acquire any of these assets and the Company does not have a right of first refusal over any of the assets in the Enhanced Pipeline. The individual holdings within the Company’s portfolio
may therefore be substantially different to the Enhanced Pipeline. 2The Fund is already invested in this asset (The Rock) and might have the opportunity to increase its investment. 3In
relation to this opportunity, on 11 September 2020, the Company announced it had approved the signing of a Sale and Purchase Agreement to acquire 100% of the equity for approximately
EUR 16m.
FOR PROFESSIONAL INVESTORS ONLY | CONFIDENTIAL | © 2020 AQUILA CAPITAL 33Benfica III – AERIFs First Solar PV Investment1
Montes Novos, part of Benfica III
Benfica III Indicative Portfolio Allocation by Technology – Post Benfica III2
Technology: Solar PV
Country: Portugal 9.9%
Capacity: 19.7 MWp 9.7%
Hydro
Status: Operational
Solar PV
COD: 2017 and 2020
Wind
Energy Offtake: c. 5-year power purchase agreements
Expected Acquisition Date: October 2020 80.4%
Acquisition Price: EUR 16.0 million
Ownership: 100%
Source: Aquila Capital Investmentgesellschaft mbH, as of 18.09.2020. 1Share purchase agreements signed on 13 September 2020. 2Based on technology allocation as at 30.06.2020 and
assumes the Benfica III transaction is closed.
FOR PROFESSIONAL INVESTORS ONLY | CONFIDENTIAL | © 2020 AQUILA CAPITAL 34Proposed Capital Raising – Transaction Details
Issue Summary Timetable
− Seeking to raise €150 million via an initial placing and offer for
General Meeting 10 am 6 October 2020
subscription
Deadline for offer for subscription 11am 8 October 2020
− Ability to upsize to €200 million
− Issue price of €1.0375, which represents a: Deadline for placing 12 pm 8 October 2020
▪ premium of 5.2% to the 30 June 2020 NAV Results announcement 9 October 2020
▪ discount of 3.9% to the closing share price on 16 September 2020 Admission of shares 13 October 2020
− New Ordinary Shares issued under the initial Issue will not qualify for
the third interim dividend, which is expected to be 1.25 cents.
− The issue is conditional on authority being granted at the General
Meeting
FOR PROFESSIONAL INVESTORS ONLY | CONFIDENTIAL | © 2020 AQUILA CAPITAL 35Conclusion
Successful track record since the Initial Public Offering in 2019 Low risk, defensive asset portfolio
− Over EUR 160.0 million committed or deployed into a high quality − Diversification by location and technology
portfolio of 6 assets, with total capacity of 197 MW − High earnings visibility with contracted revenues
− FY19 dividend target of 1.5 cents per ordinary share achieved − Low financing risk – long-term, amortising, hedged debt profile
− Attractive pipeline of investment opportunities
1H20 performance − Ongoing commitment to portfolio growth and delivering on our
− 1H20 power generation of 230.1 GWh, 11.0% above budget investment objectives
− Two new additions to the portfolio
− FY20 dividend target of 4.0 cents per ordinary share unchanged, Unique proposition for investors
despite global COVID-19 pandemic − Continental Europe focused
− Defensive portfolio characteristics − Targeting exposure across wind, solar, hydro
− Euro denominated, London Stock Exchange listing
Source: Aquila Capital Investmentgesellschaft mbH, as of 30.06.2020.
FOR PROFESSIONAL INVESTORS ONLY | CONFIDENTIAL | © 2020 AQUILA CAPITAL 36Table of Contents 1 1H 2020 Performance Highlights 2 Portfolio 3 Financial and Operating Performance 4 Valuation 5 Conclusion 6 Appendix FOR PROFESSIONAL INVESTORS ONLY | CONFIDENTIAL | © 2020 AQUILA CAPITAL 37
Corporate credentials
Renewable energy
                                                                                                 Current renewables portfolio
 Installed and                         ESG                                                       of Aquila Capital in Europe5
 Developed capacity1                                                                                  Hydropower
                                       Overall reduction of
                                       CO2 emissions in 20194                                         Onshore wind
 Wind energy
                                       1.3m tonnes                                                    Solar PV
 2,197 MW
                                                                                                      Offices
 >579 WTGs
                                       Green energy
                                       Produced in 20194
 Solar PV
                                       3.9 TWh
 3,649 MWp
 >113 PV parks
                                       Households supplied
 Hydropower                            in 20194
 631 MW                                1.1m
 145 plants
19 years of experience in alternative investments and close
proximity to our assets and our investors
– Over EUR 11.1 billion AuM and AuA2
– Over EUR 9.6 billion transaction volume in actively managed
  renewable energies
– Independently owned and operated
– Fully regulated with BaFin and CSSF3
– More than 350 employees across Europe and Asia
– Winner of Swedish Renewable Energy Award at 2018 Vind conference
– Multi technology focus on wind energy, solar PV and hydropower
– Covering the whole value chain
Source: Aquila Capital Investmentgesellschaft mbH. 1As at 30.06.2020. 2Assets under management (AuM) based on net asset value (NAV); enterprise value for real asset funds
respectively; Assets under administration (AuA) of the AIFM Alceda include funds managed by Aquila Capital. As at 30.06.2020. 3Aquila Capital Investmentgesellschaft mbH is fully
regulated and is supervised by the BaFin. Alceda Fund Management S.A. is fully regulated and supervised by the CSSF. 4Calculations follow the methodology of the Greenhouse Gas
Protocol. CO2 savings of European assets are based on the European average. CO 2 savings of international assets are based on country-specific values. As at 31.12.2019. 5 For illustrative
purposes only. Exact locations of offices and assets might deviate. Points indicate one or more assets and are not indicative of size. As at 30.06.2020.
FOR PROFESSIONAL INVESTORS ONLY | CONFIDENTIAL | © 2020 AQUILA CAPITAL                                                                                                                  38
Net Asset Value Sensitivity
Net Asset Value Sensitivity – 30 June 20201
Impact of Sensitivity on NAV per Ordinary Share
Power Prices (+/- 10%)
Energy Yield (p10/p90 10 years)
Inflation (+/- 0.5%)
Discount Rate (+/- 0.5%)
OpEx (+/- 10%)
Asset Life (+/- 1 year)
-20c -15c -10c -5c 0c 5c 10c 15c 20c
Cents per share
Source: Aquila Capital Investmentgesellschaft mbH, as of 30.06.2020. 1The data points in this chart are themselves based on a number of assumptions, including as to the possible mix of
assets in the portfolio and should not therefore be taken as a forecast, guarantee or indication of the Company's future returns.
FOR PROFESSIONAL INVESTORS ONLY | CONFIDENTIAL | © 2020 AQUILA CAPITAL 39Terms of the Fund
Aquila European Renewables Income Fund Plc
Fund structure UK-domiciled closed-end investment company
Listing Premium Segment of the London Stock Exchange
Ticker / ISIN in EUR / SEDOL AERI / GB00BK6RLF66 / BK6RLF6
Ticker / ISIN in GBP / SEDOL AERS / GB00BK6RLF66 / BJMXQK1
Currency Fund raising, reporting and investor distributions will be Euro-denominated
− Year to 31 December 2020: minimum of 4 cents per ordinary share
Target dividend profile1
− Year to 31 December 2021: minimum of 5 cents per ordinary share, with the aim of growing progressively thereafter
Governance Independent board of 4 directors
Investment adviser Aquila Capital Investmentgesellschaft mbH
AIFM International Fund Management Limited
Advisory agreement Initial term: 4 years with 1 year termination notice period
< EUR 300m: 0.75% of NAV (+ VAT)
Investment advisory fees
≥ EUR 300m ≤ EUR 500m: 0.65% of NAV (+ VAT)
+ applicable taxes
> EUR 500m: 0.55% of NAV (+ VAT)
− Continuation vote after 4 years and every 4 years thereafter
Shareholder alignment − Discount triggered buyback subject to free cashflow
− Advisory fee settled in shares in first 2 yearsContact details
Germany Czech Republic Japan Luxembourg Netherlands New Zealand
Hamburg (Headquarters) Prague Tokyo Senningerberg Amsterdam Invercargill
Valentinskamp 70 Palladium BUREX FIVE Airport Center Luxembourg Tower F, World Trade Center 173 Spey Street
20355 Hamburg Náměstí Republiky 1 2-11-10 Shimbashi 5, Heienhaff Schiphol Airport Invercargill 9810
Tel.: +49 (0)40 87 50 50-100 110 00 Prague 1 Minatoku 1736 Senningerberg Schiphol Boulevard 215
Tokyo 105-0004 1118 BH Schiphol
info@aquila-capital.com
www.aquila-capital.com
Frankfurt
Neue Mainzer Straße 75
60311 Frankfurt/Main
Norway Portugal Switzerland Singapore Spain United Kingdom
Oslo Lisbon Zurich Singapore Madrid London
Haakon VII’s Gate 6 Avenida Fontes Pereira AQ Investment AG 138 Market Street Paseo de la Castellana 259D 103 Cannon Street
0161 Oslo de Melo Poststrasse 3 #15-03 CapitaGreen Planta 14ª London EC4N 5AG
141050-121 Lisbon 8001 Zurich Singapore 048945 28046 Madrid
Barcelona
Carrer del Foc, 30
08038 Barcelona
For more information please visit us on
FOR PROFESSIONAL INVESTORS ONLY | CONFIDENTIAL | © 2020 AQUILA CAPITAL 41Important notice FOR INSTITUTIONAL/PROFESSIONAL INVESTORS ONLY. NOT FOR RELEASE, PUBLICATION OR DISTRIBUTION, DIRECTLY OR INDIRECTLY, IN OR INTO, THE UNITED STATES, AUSTRALIA, CANADA, JAPAN OR THE REPUBLIC OF SOUTH AFRICA, OR ANY OTHER JURISDICTION WHERE TO DO SO MIGHT CONSTITUTE A VIOLATION OF THE RELEVANT LAWS OR REGULATIONS OF SUCH JURISDICTION. This is an advertisement and not a prospectus for the purposes of EU Regulation 2017/1129 (the Prospectus Regulation) or Part VI of the Financial Services and Markets Act 2000 (FSMA). This document has been prepared for information purposes only. It constitutes neither investment advice, an investment service nor the solicitation to make offers or any declaration of intent with a view to purchase or sell any shares or other securities in the presented product Aquila European Renewables Income PLC (the “Fund”); the contents of this document also do not constitute a recommendation for any other action or commitment and should not be construed as such. Any investment decision regarding the Fund should be made on the basis of the prospectus, a complete review of all sales documents and in consideration of the risk instructions only. The merits or suitability of any securities must be independently determined by the recipient on the basis of its own investigation and evaluation of the Fund, International Fund Management Limited (the “AIFM”) as well as Aquila Capital (as referenced below). Any such determination should involve, among other things, an assessment of the legal, tax, accounting, regulatory, financial, credit and other related aspects of the securities. Recipients of this document are recommended to seek their own independent legal, tax, financial and other advice and should rely solely on their own judgment, review and analysis in evaluating the Fund, the AIFM and Aquila Capital (as referenced below) and their business and affairs. This document is being distributed to, and is directed only at persons or entities in the United Kingdom who (i) have professional experience in matters relating to investments and fall within the definition of “investment professionals” in Article 19(5) of the Financial Services and Markets Act 2000 (Financial Promotion) Order 2005 (as amended, the “FPO”) or (ii) are high net worth companies, unincorporated associations and other bodies within the meaning of Article 49(2) of the FPO. This document is not for the consideration of any other person or entity that does not fall within the abovementioned categories (i) or (ii). This document especially must not be made available to retail customers (as defined in the Financial Conduct Authority’s rules). This document and the information contained herein are not for release, publication or distribution - and the shares in the Fund are not and must not be offered - directly or indirectly (i) in or into the United States, Australia, Canada, Japan or the Republic of South Africa, or any other jurisdiction where to do so might constitute a violation of the relevant laws or regulations of such jurisdictions or (ii) to, for the account or the benefit of, any national, resident or citizen of such countries. In particular, the Fund’s shares are not offered or sold, directly or indirectly within the United States or to, or for the account or benefit of, “US persons” as defined in the Regulation S of the US Securities Act of 1933, as amended. Any distribution of shares in the Fund shall be subject to, and be restricted by, the applicable laws, in particular the private placement regulations. Historical information is not an indication of future earnings. This document may contain forward-looking statements. These statements typically contain words such as “expects” and “anticipates” and words of similar import. Such forward-looking statements, for example of future economic growth, depend on historical data and objective methods of calculation and by their nature involve risk and uncertainty and must be interpreted as forecasts only. Any reference to future returns or distributions must be understood as a target only. No assurances or warranties are given that any indicative performance or return will be achieved in the future. The Fund is an investment that is associated with considerable risks. Investors must be prepared to suffer substantial losses up to the total loss of their invested capital. FOR PROFESSIONAL INVESTORS ONLY | CONFIDENTIAL | © 2020 AQUILA CAPITAL 42
Important notice (cont’d)
The information contained in this document is given at the date of its publication (unless otherwise marked) and may be incomplete and subject to change. In particular
certain figures contained in this presentation, including financial information, are unaudited and may be subject to change. Therefore such information should be treated
as provisional and no reliance may be placed for any purpose whatsoever on the information or opinions contained in this document or on their completeness, accuracy or
fairness, respectively. Neither the Company, Aquila Capital Investmentgesellschaft mbH (who is acting solely in an investment advisory position to the AIFM), nor any
other member of the Aquila Group (as defined below) gives any undertaking to provide the recipient with access to any additional information, to update this document or
to correct any inaccuracies in it which may become apparent, and the distribution of this document and the document itself shall not be deemed to be any form of
commitment.

The information contained in this presentation may constitute inside information for the purposes of the Criminal Justice Act 1993 and the EU Market Abuse Regulation
(2014/596/EU) ("MAR"). You should not use this information as a basis for your behaviour in relation to any financial instruments (as defined in MAR), as to do so could
amount to a criminal offence of insider dealing under the Criminal Justice Act 1993 or a civil offence of insider dealing for the purposes of MAR or other applicable laws
and/or regulations in other jurisdictions.

Further, no liability whatsoever, whether in negligence, contract, under statute or otherwise, for damages arising directly or indirectly from the use of this document or the
information contained herein is accepted by Aquila Capital Investmentgesellschaft mbH, any other member of the Aquila Group (as defined below), the AIFM, the Fund or
Numis Securities Limited (“Numis”) or Van Lanschot Kempen Wealth Management NV (“Kempen & Co”) as the placement agents, or any of their respective directors,
officers, employees, advisors, representatives or other agents.

All contact and any questions relating to this document should be directed through Numis. Numis is authorized and regulated by the Financial Conduct Authority in the
United Kingdom. Numis is not acting as financial advisor to any recipient of this document, and any prospective investor interested in investing in the Fund is
recommended to seek independent financial advice. Numis is acting exclusively for the Fund and no-one else in connection with any issue (the “Issue”) or programme of
placings proposed in the prospectus (“Placing Programme”) or in relation to the matters referred to in this document and will not regard any other person (whether or not
a recipient of this document) as its client in this regard and will not be responsible to anyone other than the Fund for providing the protections afforded to its clients or for
providing advice in relation to the Issue or the Placing Programme, the contents of this document or any transaction or arrangement referred to in this document. Kempen
& Co, which is authorised by the Dutch Central Bank and regulated by the Dutch Central Bank and the Dutch Authority for Financial Markets, is acting exclusively for the
Company and no-one else in connection with the placing under the Issue (the "Placing") and the Placing Programme and to the matters referred to in this document, will
not regard any other person (whether or not a recipient of this document) as its client in relation to the Placing and the Placing Programme and will not be responsible to
anyone other than the Company for providing the protections afforded to its clients or for providing advice in relation to the Placing and the Placing Programme, the
contents of this document or any transaction or arrangement referred to in this document.

FOR PROFESSIONAL INVESTORS ONLY | CONFIDENTIAL | © 2020 AQUILA CAPITAL                                                                                                         43
You can also read