Optimizing water use in the Central Highlands of Viet Nam - Focus on the Robusta coffee sector Dr. Dave A. D'haeze
←
→
Page content transcription
If your browser does not render page correctly, please read the page content below

Optimizing water use in the Central
 Highlands of Viet Nam
 Focus on the Robusta coffee sector
 Dr. Dave A. D’haeze

INTERNATIONAL UNION FOR CONSERVATION OF NATURE
About IUCN

IUCN is a membership Union uniquely composed of both government and civil society
organisations. It provides public, private and non-governmental organisations with the knowledge
and tools that enable human progress, economic development and nature conservation to take
place together.

Created in 1948, IUCN is now the world’s largest and most diverse environmental network,
harnessing the knowledge, resources and reach of more than 1,400 Member organisations and
some 18,000 experts. It is a leading provider of conservation data, assessments and analysis.
Its broad membership enables IUCN to fill the role of incubator and trusted repository of best
practices, tools and international standards.

IUCN provides a neutral space in which diverse stakeholders including governments, NGOs,
scientists, businesses, local communities, indigenous peoples organisations and others can work
together to forge and implement solutions to environmental challenges and achieve sustainable
development.

Working with many partners and supporters, IUCN implements a large and diverse portfolio of
conservation projects worldwide. Combining the latest science with the traditional knowledge of
local communities, these projects work to reverse habitat loss, restore ecosystems and improve
people’s well-being.

www.iucn.org
https://twitter.com/IUCN/
Optimizing water use in the Central
Highlands of Viet Nam
Focus on the Robusta coffee sector

Dr. Dave A. D’haeze
The designation of geographical entities in this book, and the presentation of the material, do not imply the expression
of any opinion whatsoever on the part of IUCN and the Water Diplomacy Programme of the Swiss Agency for
Development Cooperation (SDC) concerning the legal status of any country, territory, or area, or of its authorities, or
concerning the delimitation of its frontiers or boundaries.
The views expressed in this publication do not necessarily reflect those of IUCN and SDC.
IUCN is pleased to acknowledge the support of its Framework Partner who provide core funding: the Water Diplomacy
Programme of the Swiss Agency for Development Cooperation (SDC).
Published by: IUCN, Gland, Switzerland
Produced by: IUCN Viet Nam Country Office
Copyright: © 2022 IUCN, International Union for Conservation of Nature and Natural Resources
Reproduction of this publication for educational or other non-commercial purposes is
authorised without prior written permission from the copyright holder provided the source is
fully acknowledged.
Reproduction of this publication for resale or other commercial purposes is prohibited without
prior written permission of the copyright holder.
Recommended citation: D’haeze, D. (2022). Optimizing water use in the central highlands of Viet Nam: Focus on
the Robusta coffee sector. Hanoi, Viet Nam: IUCN and Gland, Switzerland.
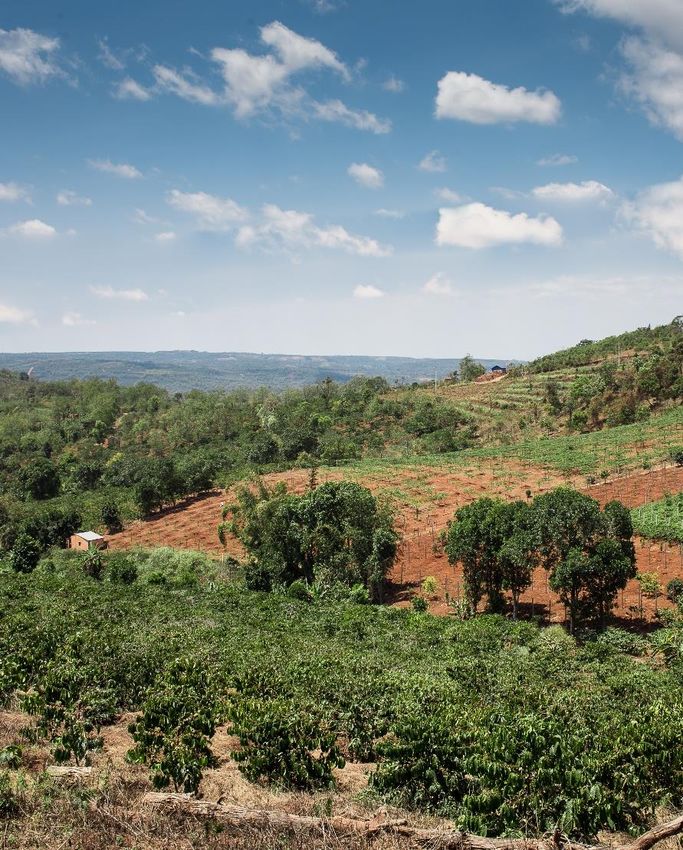
Cover photo: A farmer in a coffee plantation in the Central Highlands of Viet Nam © Alisher Sharipau,
Hanns R. Neumann Stiftung
Back cover photo: The landscape of a coffee plantation in the Central Highlands, Viet Nam © Alisher Sharipau,
Hanns R. Neumann Stiftung
Layout by: Nguyen Thuy Anh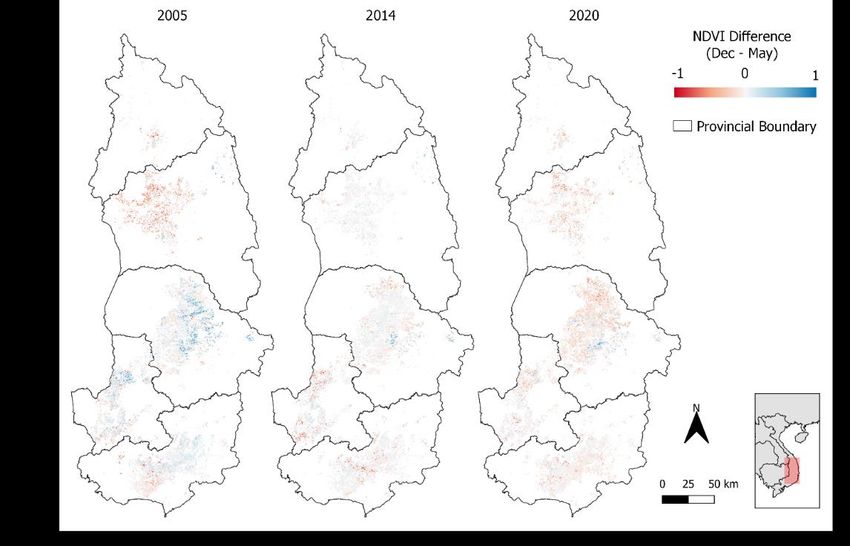
Table of contents

LIST OF TABLES ......................................................................................................................3
LIST OF FIGURES ....................................................................................................................4
1. ABBREVIATIONS, ACRONYMS, UNITS AND CURRENCY ..............................................5
     1.1     ABBREVIATIONS AND ACRONYMS .......................................................................................... 5
     1.2     METRICS ..................................................................................................................................... 5
     1.3     CURRENCY ................................................................................................................................. 5
2.     INTRODUCTION ................................................................................................................6
3.     BACKGROUND..................................................................................................................8
4.     MATERIALS AND METHODS............................................................................................9
     4.1     STUDY AREA .............................................................................................................................. 9
     4.2     IDENTIFICATION OF DROUGHT PRONE COFFEE AREAS .................................................... 9
       4.2.1        Spatiotemporal drought analysis ...........................................................................9
       4.2.2        Spatio-temporal vegetative crop response analysis ............................................11
       4.2.3        Water scarce coffee areas ..................................................................................14
     4.3     CURRENT LAND USE AND LAND SUITABILITY FOR ROBUSTA COFFEE .......................... 15
     4.4     CROP WATER REQUIREMENTS AND CURRENT ACTUAL WATER USE ........................... 16
       4.4.1        Robusta coffee....................................................................................................16
       4.4.2        Intercrops: pepper, avocado and durian ..............................................................17
     4.5     CROP MODELLING ................................................................................................................... 18
       4.5.1 Crop life cycle .....................................................................................................18
       4.5.2 Optimization of the rejuvenation cycle .................................................................19
       4.5.3 Agricultural land use transformation scenarios ....................................................21
       4.5.4 Maximization of gross revenue at farm and landscape level ...............................21
       4.5.5 Calculation of investment costs and Return on Investment .................................23
       4.5.6 Calculation of the profit/loss probability and risk exposure ..................................23
       4.5.7 Carbon sequestration..........................................................................................24
5.     RESULTS .........................................................................................................................25
     5.1     LANDSCAPE LEVEL ................................................................................................................. 25
       5.1.1        Higher coffee production with fewer trees ...........................................................25
       5.1.2        Higher gross revenue through diversified farming ...............................................26
       5.1.3        More coffee and other crops with less water .......................................................27
       5.1.4        High return on investment ...................................................................................28
       5.1.5        Carbon sequestration potential for the Central Highlands ...................................30
     5.2     FARM LEVEL ............................................................................................................................. 31
       5.2.1 Higher coffee production with fewer trees ...........................................................31
       5.2.2 Higher gross farm revenue through diversified farming .......................................32
       5.2.3 Reduced income risks.........................................................................................33
       5.2.4 High return on Investment ...................................................................................34
       5.2.5 Initial high financial risk exposure........................................................................35
       5.2.6 Increased carbon sequestration ..........................................................................36
6.     SUMMARY PER PROVINCE............................................................................................37
7.     CONCLUSIONS AND RECOMMENDATIONS .................................................................38
     7.1     ECONOMIC GAINS – PRODUCTION AND GROSS REVENUE .............................................. 38
     7.2     ENVIRONMENTAL GAINS – WATER SAVING AND CLIMATE CHANGE MITIGATION ........ 39
     7.3     INTERVENTION STRATEGY – COSTS AND RETURN ON INVESTMENT ............................ 39
     7.4     RECOMMENDATIONS .............................................................................................................. 40
REFERENCES ........................................................................................................................41

                                                                            2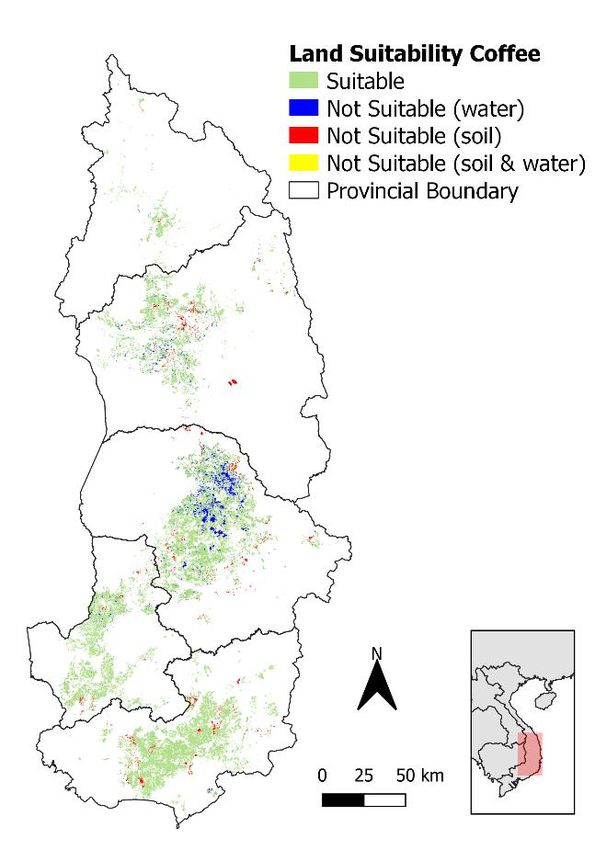
List of tables

Table 4.1 Classification of the Standard Precipitation Index .......................................................9
Table 4.2 SPI3 per month for the driest years ..........................................................................11
Table 4.3 Land suitability for coffee per province .....................................................................15
Table 4.4 Summary of current and optimal water requirement for coffee..................................16
Table 4.5 Crop water requirements for intercrops ....................................................................17
Table 4.6 Crop life cycle stages and maximum potential productivity by crop species..............18
Table 4.7 Average annual crop price........................................................................................21
Table 4.8 Model boundary conditions and constraints ..............................................................22
Table 5.1 Investment projection over 20 years for the Central Highlands (USD) ......................28
Table 5.2 Investment projection over 20 years per province (USD) ..........................................28
Table 6.1 Overview main findings by province .........................................................................37

                                                             3
List of figures
Figure 4.1 Coffee area in the Central Highlands .................................................................................................. 9
Figure 4.2 Spatio-temporal precipitation trends in the 2019/2020 dry season in the Central Highlands ........... 10
Figure 4.3 Spatio-temporal SPI3 trends in the 2019/2020 dry season in the Central Highlands ....................... 10
Figure 4.4 Average monthly SPI3 for the entire Central Highlands ................................................................... 11
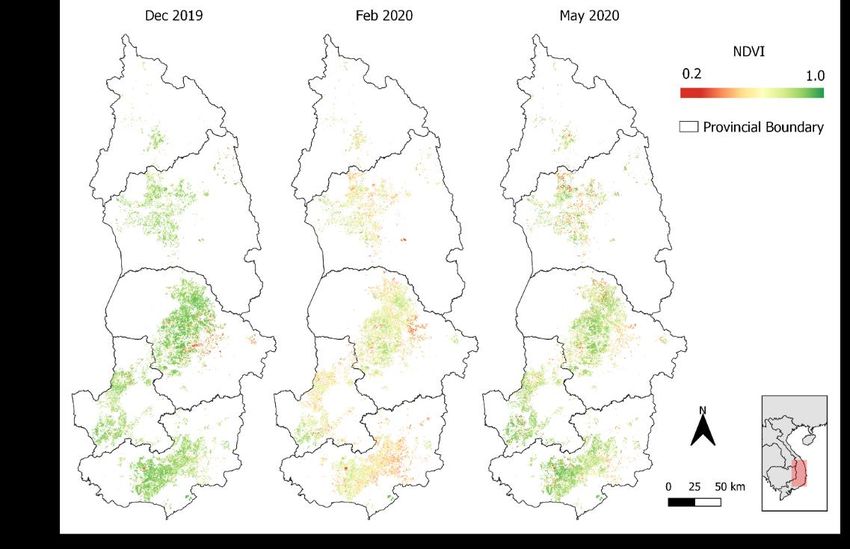
Figure 4.5 Spatio-temporal NDVI variation in the 2019/2020 dry season in coffee areas ................................. 12
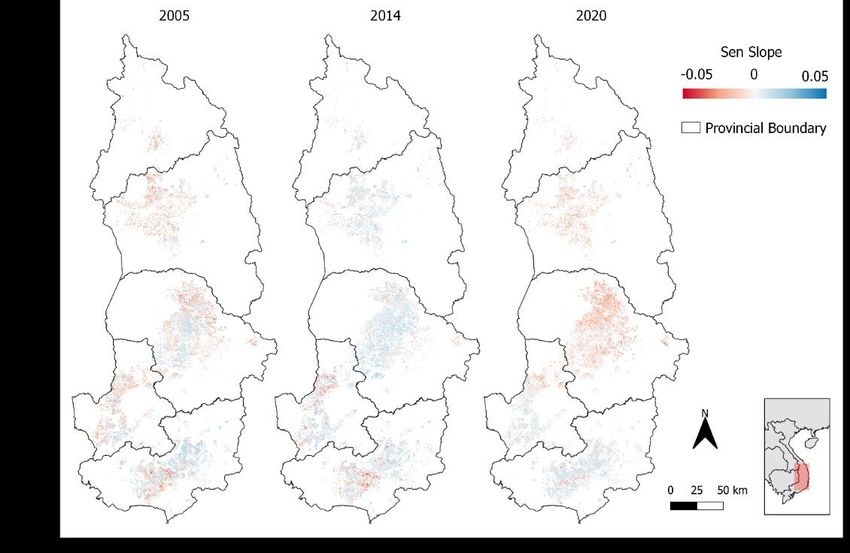
Figure 4.6 Spatio-temporal Sen slope variation for the driest years (2005, 2014 and 2020) in coffee areas .... 13
Figure 4.7 Spatio-temporal NDVIdiff variation for the driest years (2005, 2014 and 2020) in coffee areas......... 13
Figure 4.8 Water scarce coffee areas ................................................................................................................ 14
Figure 4.9 Land suitability for coffee production ................................................................................................ 15
Figure 4.10 Most common irrigation methods in the Central Highlands ............................................................ 16
Figure 4.11 Adoption rates of good irrigation practices in 2017 and 2019 (hose) .............................................. 17
Figure 4.12 Adoption rates of good irrigation practices in 2017 and 2019 (sprinkler) ........................................ 17
Figure 4.13 Crop life cycle by crop species (t/ha) .............................................................................................. 18
Figure 4.14 Coffee life cycle, rejuvenated area and total production for 5 (left) and 10 (right) years ................ 19
Figure 4.15 Example total production per year and per rejuvenation cycle ....................................................... 20
Figure 4.16 Simulation of monocrop coffee production over time for two rejuvenation cycles ......................... 20
Figure 4.17 Historic annual average crop price ................................................................................................. 21
Figure 4.18 Traditional histogram of historic coffee prices (1991-2020) ............................................................ 23
Figure 4.19 Kernel Density Estimation of historic coffee prices (1991-2020) .................................................... 23
Figure 4.20 Random profit/loss value over time ................................................................................................. 24
Figure 5.1 Annual coffee production at landscape level .................................................................................... 25
Figure 5.2 Annual production per crop species at landscape level .................................................................... 25
Figure 5.3 Annual gross revenue at landscape level ......................................................................................... 26
Figure 5.4 Annual gross revenue by crop species at landscape level ............................................................... 26
Figure 5.5 Water use per scenario at landscape level ....................................................................................... 27
Figure 5.6 Average annual irrigation costs per scenario at landscape level ...................................................... 27
Figure 5.7 Cumulative investment over 20 years and cumulative added value vs. BaU at landscape level ...... 29
Figure 5.8 Cumulative investment over 10 years and cumulative added value vs. BaU at landscape level ...... 29
Figure 5.9 Carbon sequestration over time for monocrop and intercropped coffee (landscape) ....................... 30
Figure 5.10 Carbon sequestration over time broken down by crop species (landscape) .................................. 30
Figure 5.11 Annual coffee production at farm level ............................................................................................ 31
Figure 5.12 Annual production per crop species at farm level ........................................................................... 31
Figure 5.13 Annual gross farm income .............................................................................................................. 32
Figure 5.14 Annual gross farm income by crop species .................................................................................... 32
Figure 5.15 Annual gross farm income based on historic crop price ................................................................. 33
Figure 5.16 Annual gross farm income by crop species based on historic crop price ....................................... 33
Figure 5.17 Harvest period per crop species ..................................................................................................... 33
Figure 5.18 Cumulative investment and cumulative added value at farm level for monocrop coffee ................ 34
Figure 5.19 Cumulative investment and cumulative added value at farm level for intercropped coffee ............ 34
Figure 5.20 Loss/profit probability and value and risk exposure at farm level over time.................................... 35
Figure 5.21 Total carbon sequestration for monocrop and intercropped coffee over time ................................. 36
Figure 5.22 Carbon sequestration for intercrop systems over time broken down by crop species .................... 36
Figure 5.23 Carbon sequestration for monocrop systems over time broken down by crop species .................. 36
4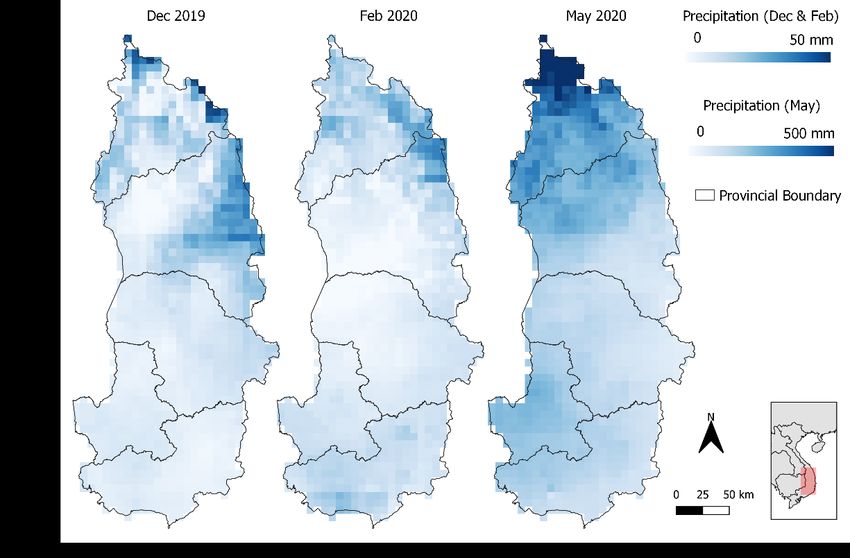
1. Abbreviations, acronyms, units and currency

1.1 Abbreviations and Acronyms
BaU            Business as Usual
bil            billion
BRIDGE         Building River Dialogue and Governance
CHIRPS         Climate Hazards Group InfraRed Precipitation with Station data
gbe            green bean equivalent
ha             hectare
IUCN           International Union for Conservation of Nature and Natural Resources
mio            million
NDVI           Normalized Difference Vegetation Index
NIAPP          National Institute for Planning and Projection
ROI            Return on Investment
SPI            Standard Precipitation Index
t              metric ton
USD            United States Dollars
VND            Vietnam Dong
WASI           Western Highlands Agriculture and Forestry Science Institute
y              year

1.2 Metrics
This report makes use of the International System of Units (SI).

1.3 Currency
Raw calculations were done in Vietnam Dong and converted to USD at an exchange rate of
22,949 VND for 1 USD.

                                                5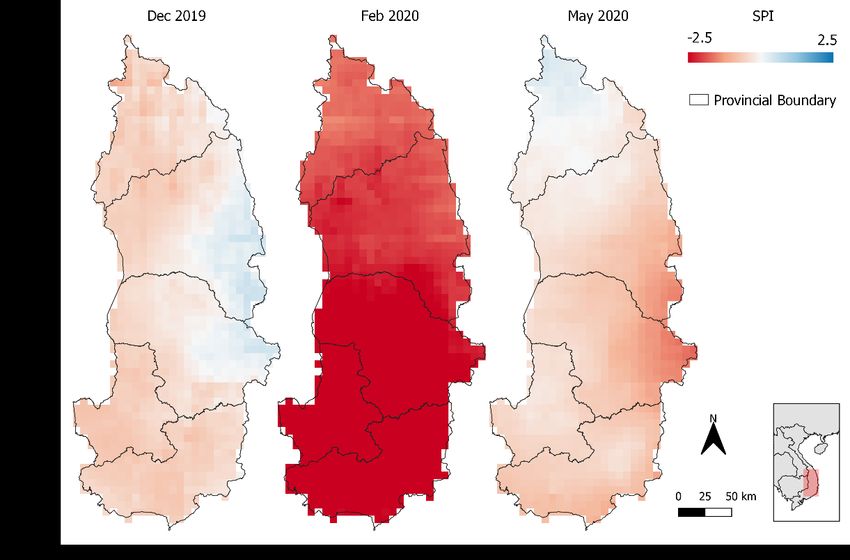
2. Introduction
International Union for Conservation of Nature and Natural Resources (IUCN), through its BRIDGE
program (Building River Dialogue and Governance), is supporting work on transboundary river
cooperation in the 3S (i.e. Srepok, Sesan and Sekong) river basins. Coffee is the dominant
commercial land use and a major user of water in the Central Highlands of Vietnam, which forms the
headwaters of the Srepok and Sesan (2S) Rivers.
In 2019, a rapid assessment of opportunities was conducted to transition coffee monocultures into
diversified coffee farming with significant benefits in terms of total crop value, drought resilience,
existing coffee supply to the global market and dry season water availability and downstream flows.
The analysis showed that more efficient irrigation and the transition of drought prone areas out of
coffee and into high value tree crops could increase the dry season flow of the 2S by 50% with
potentially substantial downstream and transboundary benefits.
The assessment was updated in 2020: https://www.iucn.org/news/viet-nam/202008/transforming-
coffee-and-water-use-central-highlands-vietnam-case-study-dak-lak-province.
There is growing business interest in such transition to reduce the risk of farmers abandoning coffee
altogether under conditions in increasing weather variability, thereby threatening supply chains, and
to ensure compliance with increasingly strict international regulations on pesticide residues. See:
https://www.iucn.org/news/viet-nam/202010/business-consultation-coffee-transformation-and-water-
use-vietnams-central-highlands.
Building on the 2020 assessment, the objective of this assignment is to provide a more detailed
analysis of the costs and benefits of the proposed transition from coffee monocultures into diverse,
higher value, and water saving agroforestry across all five provinces in the Central Highlands.
The goal of this study is to:
1. Identify areas suitable for coffee production the five Central Highlands provinces in terms of
   soil/topography.
2. Identify areas with a potential water shortage in extreme dry years for the December-May dry
   season by looking at the monthly Standard Precipitation Index and the Normalized Difference
   Vegetation Index derived from satellite imagery, over a 20-years period.
3. Run the crop diversification model developed for Dak Lak for the entire Central Highlands:
        a. Scenario 1: Business as usual (BaU) i.e. rejuvenate monocrop coffee over 19 years in all
           current coffee areas.
        b. Scenario 2: Diversify coffee with pepper, avocado and durian on land units suitable for
           coffee and replace coffee with a combination of aforementioned crops on water scarce
           land units.
4. Refine the economic analysis at farm level; i.e. use Monte Carlo simulation to quantify the
   probability and value as well as farmers’ risk exposure to gross revenue loss/profit for the intercrop
   model vs. the current situation.
5. Summarize all above results broken down per province (investment needs for transition per
   province is important for provincial decision makers).

                                                   6
This analysis differs from the initial rapid assessment in the following ways:
   a. The report covers all 5 provinces of the Central Highlands (i.e. Kon Tum, Gia Lai, Dak Lak,
      Dak Nong and Lam Dong). Looking at the study from an administrative boundary perspective
      may facilitate decision making at provincial level.
   b. The modelling timeframe has been set at 30 years so as to include the full life cycle of Robusta
      coffee (i.e. 25 years).
   c. The analysis is done at both the landscape level and the individual farm level. The landscape
      level is important to understand, e.g. total provincial production of coffee and intercrops or to
      better capture regional water savings. The farm level analysis on the other hand allows us to
      assess farm income and investment needs at the individual level.
   d. The report includes a return on investment (ROI) analysis to help the public and private sector
      understand the cost and benefits of a large-scale intervention strategy. At the farm level, the
      ROI analysis can help convince farmers shifting to the new business model and allows to
      estimate farm financing needs (if any).
   e. The report includes a quick assessment of potential carbon sequestration in view of changing
      climate conditions.
The report is structured as follows. At first the rationale for this study is elaborated. The methodology
and data used in this report are then described. In the following chapter (results) different options for
agricultural transformation are analyzed in terms of coffee production, water saving, profitability and
climate change mitigation both at the landscape and farm level. Finally, conclusions and
recommendations are presented.

                                                   7
3. Background
Vietnam is the world’s second largest coffee producer and leading Robusta coffee exporter. The
country achieves the world’s highest coffee yields which puts it in the center of the global coffee
market as demand is constantly increasing (1-3% per year). Coffee is the most important agricultural
export product in value for Vietnam and supporting the rural livelihoods of over 2 million people, mainly
in the Central Highlands. Export volumes peaked at 30 million bags in 2018 generating revenues of
3.54 billion USD.
The Central Highlands has a population of circa 5.7 million (GSO, 2016). It is the second poorest
region in Viet Nam and rural poverty is almost double the national average (28.8% vs. 17.9%) with
particularly high poverty rates among ethnic minorities who make up 32% of the population. Over 40%
of the Central Highlands’ population earns an income from coffee production.
In order to make coffee farming economically viable, irrigation is needed to achieve yields that
average 2.3 tons of green beans per ha (ICO, 2019). However, people living in the Central Highlands
increasingly face the challenges of drought and extreme water shortage. These threaten agricultural
production, which not only affects community life but also weakens the local economy (ICEM, 2013).
E.g. as a result of the 2016 drought, the discharge of main rivers reduced by 20-90% (NCHMF, 2016).
The same year, about 70% of the cultivation area experienced severe drought (MARD, 2016). Nearly
170,000 ha of crops were affected by the drought, of which 7,100 ha were left fallow and more than
95,000 ha were deficient in irrigation (CGIAR, 2016).
Aggravating this situation is the absence of systematic monitoring of water resources, which makes
it impossible to provide information on the condition of water resources and recommend a course of
action on water resources management for the region.
During the dry months (January-April) Robusta coffee in Vietnam needs to be irrigated. Although
water is scare during this period, smallholder coffee farmers tend to irrigate up to 2 times more than
what MARD recommends. Over-extraction can be explained by the fact that water is an open access
resource, has no price and licensing regulations about the maximum number of wells and their
maximum extraction depth are not enforced.
During the 2016 drought, CGIAR experts conducted a rapid appraisal on how to cope with climate
change and water scarcity in agriculture and made the following recommendation to MARD: “Develop
appropriate policies to encourage diversification of agricultural systems, including innovative financing
mechanisms to support smallholders.” The authors argue that: “Changing land use patterns and
landscape management are options for long-term adaptation. Typical monocultures in the Central
Highlands could be replaced with diversified cropping systems, which vary agricultural products (both
cultivation and livestock). These diversified systems engender multiple sources of household income
and promote resilience to climate change and extreme weather events.”
Aligned with the above recommendations, this report presents a macro-economic landscape and farm
level analysis for transforming coffee monocrop into diversified farming systems.
84. Materials and methods
4.1 Study area
The study area is the Central Highlands (Figure 4.1)
which is comprised of 5 provinces, from north to south,
Kon Tum, Gia Lai, Dak Lak, Dak Nong and Lam Dong.
The current coffee area in this region was estimated at
586,000 ha based on SPOT satellite imagery (NIAPP,
2015).
To address agricultural transformation needs in
response to climate change, it is important to
understand land suitability for the Robusta coffee in
terms of soil and landscape characteristics (e.g.
topography) as well as water availability for irrigation
during the dry season. In an earlier IUCN report on Dak
Lak Province (D’haeze, 2020), water scarce coffee
areas were identified based on a geohydrological study
by Milnes et al. (2015). Since this information is not
available for the entire Central Highlands, this study
relies on time series satellite imagery to identify drought
prone areas using the Standard Precipitation Index
(SPI) and to assess crop vegetative response using the
Normalized Difference Vegetation Index (NDVI).
Figure 4.1 Coffee area in the Central
Highlands
4.2 Identification of drought prone coffee areas
4.2.1 Spatiotemporal drought analysis
A commonly used indicator to identify the severity of Table 4.1 Classification of the Standard
drought events, recommended by the World Precipitation Index
Meteorological Organization, is the Standard Precipitation
Precipitation Index (SPI). SPI is a normalized, Value Regime
dimensionless index representing the probability of 2.0 < SPIMonthly CHIRPS (Climate Hazards Group InfraRed Precipitation with Station data) satellite images
(Figure 4.2) were used for a period of 20 years (2001-2020). CHIRPS is a 35-year quasi-global rainfall
data set, which is available in different time steps at a spatial resolution of 0.05° (~ 5 by 5 km). The
data can be freely downloaded at https://data.chc.ucsb.edu/products/CHIRPS-2.0/. Using freeware
software packages QGIS 2.16 and R Studio 1.4.1717, the SPI3 was calculated pixel by pixel for
a 20-years monthly time series1 of CHIRPS rainfall records (Figure 4.3).
Figure 4.2 Spatio-temporal precipitation trends in the 2019/2020 dry
season in the Central Highlands
Figure 4.3 Spatio-temporal SPI3 trends in the 2019/2020 dry season in the
Central Highlands
1Figures 4.2 and 4.3 above are presented as an example only to show trends. These maps are part of a full time series that
consists of 240 maps for rainfall and SPI each (monthly data over 20 years).
10Figure 4.4 shows the monthly average SPI3 for the entire Central Highlands over 20 years and
indicates that in order of drought severity 2005, 2014 and 2020 were the most critical years.
Table 4.2 summarizes the observed SPI3 values for the three driest years.
2.5
2.0
1.5
1.0
0.5
0.0
-0.5
-1.0
-1.5
-2.0
-2.5
2000 2001 2002 2003 2004 2005 2006 2007 2008 2009 2010 2011 2012 2013 2014 2015 2016 2017 2018 2019 2020
Figure 4.4 Average monthly SPI3 for the entire Central Highlands
Red bars below 1.0 indicate drought and blue bars higher than 1.0 show above average precipitation.
Table 4.2 SPI3 per month for the driest years
The highlighted cells show moderately dry months (SPI3 < 1.0); cells
with a red border indicate extremely dry months (SPI3MODIS NDVI satellite data are used. They have a spatial resolution of 250 by 250 m,
are available on a 16-day interval and can be downloaded for free at
https://modis.gsfc.nasa.gov/data/dataprod/mod13.php. Figure 4.5 shows the NDVI trends over time
in 2019/2020. For example, in Dak Lak, coffee areas in the east appear clearly affected by water
scarcity in February (red), while in the center of the basalt plateau the NDVI values remain rather
stable (greenish) indicating sufficient water availability (less plant water stress).
Figure 4.5 Spatio-temporal NDVI variation in the 2019/2020 dry season
in coffee areas
To understand plant response in relation to water availability, a spatio-temporal NDVI trend analysis
was done using the modified Mann-Kendall method to derive the Sen slope (i.e. the trend direction)
and its significance (p value). Applying freeware software packages QGIS 2.16 and R Studio
1.4.1717, the trend analysis was done pixel by pixel for the three driest years (i.e. 2005, 2014 and
2020) and for the dry season months only (i.e. December in the previous year till May in the current
year; i.e. 2 images/month x 6 months = 12 images/year). It is assumed that the NDVI will remain
stable or show a slight decline during the dry season in irrigated areas with sufficient water availability,
while the NDVI will significantly decline (plant wilting) towards the end of the dry season in areas with
water scarcity. Figure 4.6 shows the NDVI trend during the dry season in the three driest years. In
2020, coffee trees in Gia Lai, Dak Lak and northern Dak Nong appeared suffering more from water
stress (red), compared to Lam Dong province (bluish).
12Figure 4.6 Spatio-temporal Sen slope variation for the driest years
(2005, 2014 and 2020) in coffee areas
On top of the trend analysis, the difference between the NDVI value in May and December was
studied (NDVIdiff = NDVIMay - NDVIDec). Negative NDVIdiff values indicate plant wilting (i.e. water
scarcity), while positive values show vegetative plant recovery in May as compared to the start of the
dry season in December (Figure 4.7).
Figure 4.7 Spatio-temporal NDVIdiff variation for the driest years
(2005, 2014 and 2020) in coffee areas
NDVIdiff is dimensionless indicator expressing the difference between NDVI May and NDVIDec.
134.2.3 Water scarce coffee areas Combining the results of the meteorological drought and vegetative crop response analyses allows us to identify areas at risk of severe water shortage during the dry season. For each extremely dry year (2005, 2014 and 2020), coffee areas with a significant negative NDVI trend (i.e. statistically significant negative Sen slope at p
4.3 Current land use and land suitability for Robusta Coffee
The current coffee area in the Central Highlands was estimated based on SPOT satellite imagery
(NIAPP, 2015). This map was overlain with the physical land suitability map2 (NIAPP & KUL, 2002)
and the water scarcity map (CHYN, 2015 and current study) to identify suitable and unsuitable land
units in terms of water scarcity, soil and topographic conditions (Figure 4.9 and Table 4.3).

                                                                 Table 4.3 Land suitability for coffee per
                                                                                province
                                                               Province            Suitability           ha        %
                                                                          total                          16,576
                                                                          suitable                       16,141        97
                                                               Kon Tum    not suitable (water)              214         1
                                                                          not suitable (soil)               221         1
                                                                          not suitable (soil & water)       -           0
                                                                          total                         103,180
                                                                          suitable                       92,418        90
                                                                Gia Lai   not suitable (water)            4,915         5
                                                                          not suitable (soil)             5,518         5
                                                                          not suitable (soil & water)       329         0
                                                                          total                         210,948
                                                                          suitable                      179,311        85
                                                               Dak Lak    not suitable (water)           24,904        12
                                                                          not suitable (soil)             6,131         3
                                                                          not suitable (soil & water)       601         0
                                                                          total                          96,557
                                                                          suitable                       93,100        96
                                                               Dak Nong   not suitable (water)            1,718         2
                                                                          not suitable (soil)             1,717         2
                                                                          not suitable (soil & water)         23        0
                                                                          total                         158,941
                                                                          suitable                      150,918        95
                                                               Lam Dong   not suitable (water)              739         0
                                                                          not suitable (soil)             7,256         5
                                                                          not suitable (soil & water)         28        0
       Figure 4.9 Land suitability for coffee
       production in the Central Highlands

Table 4.3 summarizes the land evaluation exercise above. In total ~586,000 ha is planted with coffee
of which ~532,000 ha are suitable (91%). Areas not suitable for coffee production in terms of soil and
topographic conditions count ~22,000 ha (4%). These land units will be excluded from the macro-
economic modeling below. Areas unsuitable for coffee only because of seasonal water scarcity sum
up to ~32,500 ha (6%). These land units will be included in the landscape model but converted into
less water demanding mixed cropping systems without coffee.

2The land suitability map was developed in the Belgian VLIR-DGOS project “Land Evaluation for Land Use Planning and
Development of Sustainable Agriculture in South-Vietnam”. This was a cooperation between the Katholieke Universiteit
Leuven (KUL, Catholic University Leuven, Belgium) and the National Institute for Planning and Projection (Vietnam). The
project ran from 1997 till 2002.

                                                          15
4.4 Crop water requirements and current actual water use
4.4.1 Robusta coffee
Empirical research shows that the maximum required irrigation volume per coffee tree per round is
~400 liters for hose irrigation (D’haeze, 2003).
A recent study (Viossanges et al., 2019, IWMI/Nestlé/SDC project report3) found that farmers in the
Central Highlands in general and in Dak Lak in particular appear to be shifting from traditional hose
irrigation to overhead sprinkler to save labor time and costs (Figure 4.10). To calculate the landscape
wide water requirement, the irrigation method needs to be factored in as some methods are more or
less efficient than others.
For hose irrigation, water is conveyed directly
from the source to the individual coffee tree
without significant losses. Hence the crop water
requirement of 400 l/tree/round is equal to the
water extraction volume. Assuming that the
dimensions of each basin around an individual
coffee tree are 2.5 by 2.5 m, then the wetted soil
surface is 6.25 m2. For overhead sprinkler the
entire field is wetted. Given the plant spacing of
3 m by 3 m (1,110 trees / ha), this is equivalent
to 9 m2 per tree. Therefore, without considering
Figure 4.10 Most common irrigation evaporative water losses on the canopy, the
methods in the Central Highlands sprinkler method requires about 45% more
Based on a survey sample of 14,592 coffee farmers in water i.e. ~600 l/tree/round (Table 4.4).
Gia Lai, Dak Lak, Dak Nong and Lam Dong (2017).
‘Combined’ refers to the use of both hose and
overhead sprinkler on the same farm.
Table 4.4 Summary of current and optimal water requirement for coffee
The water requirements are broken down per irrigation method.
The upper part of the table shows figures in l/tree/round, while in the lower part these figures are converted to m3/ha.
The values per ha assume 1,110 coffee trees/ha and 3 irrigation rounds per year.
Weighted
Item Unit Hose Sprinkler Combined
average
Percent users by irrigation method % 66% 21% 13%
Current irrigation volume l/tree/round 585 689 637 614
Recommended irrigation volume l/tree/round 400 600 500 455
Potential water saving l/tree/round 185 89 137 159
Current irrigation volume m3/ha 1,948 2,294 2,121 2,043
Recommended irrigation volume m3/ha 1,332 1,998 1,665 1,515
Potential water saving m3/ha 616 296 456 528
3The project “Viet Nam to produce more coffee with less water - towards a reduction of the blue water footprint in coffee
production” was co-financed by Nestlé/Nescafé and the Swiss Agency for Development and Cooperation. Implementation
was with the foundation Hanns R. Neumann Stiftung. The project duration was 5 years (2014-2019).
16In the above-mentioned Nestlé/SDC project, irrigation application measurements were conducted in
2017, 2018 and 2019 for a sample of ~ 400 farmers. This is statistically representative for a population
size of 586,000 farming households (equivalent to all coffee farmers in the Central Highlands). The
measurements were broken down per irrigation method and whether farmers received project training
or not. Results show adoption rates of 55% and 53% for respectively hose and overhead sprinkler
irrigation (Figure 4.11 and Figure 4.12).
Figure 4.11 Adoption rates of good Figure 4.12 Adoption rates of good irrigation
irrigation practices in 2017 and 2019 (hose) practices in 2017 and 2019 (sprinkler)
The x-axis shows the applied irrigation volume (l/tree/ha). The x-axis shows the applied irrigation volume (l/tree/ha).
The y-axis indicates the number of farmers applying a The y-axis indicates the number of farmers applying a
certain volume of water (%). certain volume of water (%).
The sum of the blue full colored bars shows a 55% adoption The sum of the blue full colored bars shows a 53% adoption
rate in 2019 (irrigation volume less than 400 l/tree/round). rate in 2019 (irrigation volume less than 600 l/tree/round).
Currently, farmers apply on average 585 l/tree/round, 689 l/tree/round and 637 l/tree/round for
respectively hose, overhead sprinkler and a combination of both methods. The recommended water
volumes per tree are respectively 400 l/tree/round, 600 l/tree/round and 500 l/tree/round. These
figures (Table 4.4) will be used in the landscape modeling described below.
4.4.2 Intercrops: pepper, avocado and durian
The crop water requirements for alternative intercrops are taken from WASI and summarized
in Table 4.5 below.
Table 4.5 Crop water requirements for intercrops
The table is broken down by crop simulation model, i.e. monocrop
coffee, intercrop coffee on suitable land and intercrops only (without
coffee) on unsuitable (water scarce) land.
Trees Irrigation volume
Crop models
(#/ha) (m3/ha/y)
Coffee (monocrop)
Current irrigation 1,110 2,043
Optimal irrigation 1,110 1,515
Coffee (intercrop)
Suitable land
Coffee 887 1,211
Pepper 336 134
Avocado 28 34
Durian 28 21
Unsuitable land
Pepper 1,362 545
Avocado 35 42
Durian 35 26
174.5 Crop modelling
4.5.1 Crop life cycle
Based on literature review and discussion with
experts, the crop life cycles for Robusta coffee
(Coffea canephora), black pepper (Piper nigrum),
Avocado (Persea americana) and Durian (Durio)
were developed (Figure 4.13 and Table 4.6). The
latter three species were recommended by WASI as
potential intercrops.
The coffee life cycle starts with 2 zero-production
years and subsequently 5 linear production
increase years (i.e. from year 3 to 8 productivity
linearly increases from 0.5 to 6.0 t/ha). The
maximum potential yield is reached in year 8. The Figure 4.13 Crop life cycle by crop
stable maximum potential yield phase counts 10 species (t/ha)
years (years 8 to 17) after which productivity The time horizon (x-axis) covers 75 years to allow
visualization of the downward trends for avocado and
declines linearly to 0.75 t/ha in year 25. Table 4.6 durian after 60 years and the cyclical patterns for coffee
gives on overview of the life cycle stages and and pepper (25 and 20 years respectively).
maximum potential yields for all four crops. The y-axis shows the yield per crop species (t/ha).
Each life cycle assumes monocrop farming, applying
For the below macro-economic modeling a best agricultural practices to achieve maximum
potential yield.
maximum time horizon of 30 years is applied.
Table 4.6 Crop life cycle stages and maximum potential productivity
by crop species
Crop life cycle stages are expressed in years and the maximum potential yield in t/ha
Stable Total Maximum
Not Production Production
Crop maximum life potential
productive increase decrease
production cycle productivity
Coffee 2 5 10 8 25 6
Pepper 2 4 8 6 20 2
Avocado 5 5 50 15 75 15
Durian 4 15 41 15 75 15
184.5.2 Optimization of the rejuvenation cycle
To determine the most productive rejuvenation cycle for each crop species, first the respective crop
life cycles were constructed (cf. chapter 4.5.1). The simulated production figures (t/ha) were plotted
in a matrix form. Columns depict the production years, rows the rejuvenation cycle years (Figure 4.14,
top graphs). E.g. if one replants partially in year 5, then a new crop life cycle starts in that production
year (cf. row 5 below in the graphs at the top).
Figure 4.14 Coffee life cycle, rejuvenated area and total production
for 5 (left) and 10 (right) years
The top graphs show the productivity change over time or the crop life cycle (t/ha)
The middle graphs show examples of rejuvenation schemes; over 5 years at the left and over 10 years at the right (ha)
The bottom graphs depict the total production i.e. the product of the above matrices (t).
19In a second step, the crop rejuvenation cycles were developed and plotted in a matrix format (graphs
in the middle of Figure 4.14). As above, columns depict the actual production years, while rows are
the rejuvenation years. Assume a farm has a total area of 100 ha. In the first case (left middle graph)
the total land area is rejuvenated over 5 years (i.e. 20 ha/y). In the second case (right middle graph),
rejuvenation is planned over 10 years (i.e. 10 ha/y). Rejuvenation cycle matrices were designed
for 1 until 30 years (i.e. 30 matrices in total).
In the third step the crop life cycle matrix is multiplied with each unique rejuvenation cycle matrix,
resulting in 30 new total production matrices (Figure 4.14 bottom graphs), where each unique
row/column combination represents the specific crop production for a specific rejuvenated area.
E.g. column 4/row 1 (bottom left graph) is equal to 32 t (i.e. 1.6 t/ha multiplied by 20 ha).
Subsequently, the totals were calculated for each production year. E.g. in the bottom left graph in
Figure 4.14 (rejuvenation cycle of 5 years), the sum of the values in columns 1, 2, 3, 4 and 5 are
respectively 0, 0, 10, 42 and 96. In contrast, the sum of the first 5 columns (or production years) for a
10-year rejuvenation cycle, results in 0, 0, 5, 21, 48. Summing the columns for each total production
matrix results in 30 1-dimentional matrices (2 are shown as an example in Figure 4.15).
Finally, the average was 1 2 3 4 5 6 7 8 9 10 11 12 13 14 15 16 17 18 19 20 21 22 23 24 25 26 27 28 29 30
5 0 0 10 42 96 96 96 96 96 96 96 96 96 96 96 96 96 96 96 96 96 96 96 96 96 96 96 96 96 96
calculated for each rejuvenation 10 0 0 5 21 48 86 135 195 255 315 315 315 315 315 315 315 315 315 315 315 315 315 315 315 315 315 315 315 315 315
cycle. The one with the highest
average over 30 years results the Figure 4.15 Example total production per year and per
optimum rejuvenation cycle. rejuvenation cycle
Columns indicate production years and rows rejuvenation cycle years.
Rows 1 and 2 refer respectively to 5- and 10-year rejuvenation cycles.
The above procedure was repeated for each crop species (4 in total) and run separately for (i) the
entire current coffee area, (ii) the suitable coffee areas and (iii) the unsuitable coffee areas.
Figure 4.16 shows the total coffee production per
year for 2 distinct rejuvenation cycles (19 and 25
years) per hectare. These were chosen as the
19 year-cycle results in the highest average yield
(among all 30 scenarios analyzed) and 25 years
coincides with the end of the productive lifetime for
coffee. It shows that the better option is to
rejuvenate earlier as the overall average yield will
stabilize at 4.4 t/ha, 12% higher than the stable end
yield for a 25-year cycle.
At the landscape level 19 years may be an
Figure 4.16 Simulation of monocrop
interesting option to spread required investment
coffee production over time for two
costs over a longer time horizon. However, at the
rejuvenation cycles
macro-level one may want to transition faster if
The red line simulates monocrop coffee production
over time (t/ha) and assumes replanting every possible. Faster transitioning meaning that larger
25 years. areas need to be converted on an annual basis.
The blue line simulates monocrop coffee production
over time (t/ha) and At the farm level, a farmer would usually try to
assumes replanting every
19 years. rejuvenate over a shorter time horizon if financing
allows. However, it would be good to keep a 19-year rejuvenation cycle once the farm is fully
replanted. This is equivalent to rejuvenating 3-5 % or ~55 trees per hectare annually for monocrop
farming. This will guarantee a stable yield over time (beyond 25 years) and allows spreading
investments. One can look at this as a depreciation process.
204.5.3 Agricultural land use transformation scenarios
In this report with a focus on agricultural transformation for the Central Highlands, two land use
scenarios will be assessed:
1. Coffee monocrop
This is the business as usual (BaU) scenario where it is assumed that farmers continue growing
coffee as a monocrop (i.e. 1,110 trees per ha) in the current coffee areas (~586,000 ha in the
Central Highlands; cf. section 4.3). The model assumes that farmers rejuvenate gradually and
replace old coffee trees with better varieties (e.g. TRS1, TR4, TR9 and TR11) at a pace of ~5%
per year equivalent to a full replacement over 19 years (cf. optimal crop rejuvenation cycle
described in chapter 4.5.2). At landscape level a 19-year rejuvenation cycle is equivalent to
~31,000 ha conversion of land use annually.
2. Coffee intercrop
In this new scenario a distinction in land use destination at landscape level is made based on the
aforementioned land suitability analysis (cf. chapter 4.3) which shows that ~532,000 ha is suitable
for coffee production, while ~ 32,500 ha faces seasonal water scarcity. Therefore, this new
scenario is split into 2 parts:
a. suitable land units where coffee is grown intercropped with pepper, avocado and durian;
and
b. unsuitable (water scarce) land units where coffee is replaced by an intercropped farming
system with pepper, avocado and durian only.
4.5.4 Maximization of gross revenue at farm and landscape level
As described above, the agricultural transformation model aims to diversify agricultural production in
order to save water and maximize gross revenues. Gross revenue is calculated by multiplying the
annual yield (t/ha) by average annual price (USD/t) per crop species. Average annual crop prices
were derived from various sources (Figure 4.17 and Table 4.7).
Table 4.7 Average annual crop price
The average annual crop price (USD/t) was calculated
based on data from 1991 to 2018.
Data sources are provided in (Figure 4.17)
Crop USD/t
Coffee 1,650
Pepper 3,399
Avocado 793
Durian 1,556
Figure 4.17 Historic annual average crop price
The x-axis depicts calendar years starting in 1990.
Prices in the y-axis are in USD/t.
Sources
Coffee: https://ycharts.com/indicators
Pepper: FAOSTAT Vietnam
Avocado: FAOSTAT (average top 10 countries)
Durian: Own data compilation based on various sources
21To maximize gross revenues4, the best combination of crops in terms of plants per hectare needs to
be identified. Multiple goal linear programming was applied to resolve this problem using Excel Solver
software. With this method it is possible to determine the number of plants per crop species per
hectare, while maximizing the total gross revenue for all species over a 30-year time horizon. In the
process, constraints can be added, e.g. the maximum number of coffee trees may not exceed
1,110 per hectare or coffee production in year 30 must be 20% higher than the production in year 1.
Several iterations were run, starting with few simple constraints and stepwise adding more and more
complex constraints. For example, in the first simple scenario, the model only assumes that the
number of plants per hectare per species cannot exceed the maximum plant density under monocrop
conditions and the sum of the area taken per crop species may not exceed 1 ha (i.e. 10,000 m2). In
this case the model shows that no pepper should be planted, which violates the goal of maximum
crop diversification. Therefore, new constraints were added. Table 4.8 shows an overview of all model
constraints and the resulting combined number of plants per hectare. The model outputs are different
for suitable and unsuitable (water scarce) land units because on the latter no coffee is planted.
Table 4.8 Model boundary conditions and constraints
Area suitable for coffee production
Maximize the total gross revenue of an intercropped farming system
Goal
consisting of coffee, pepper, avocado and durian over a 30-year time horizon
# coffee trees: maximum 1,110 trees
Constraints
# pepper poles: maximum 2,500 poles
# avocado trees: maximum 154 trees
# durian trees: maximum 154 trees
# avocado trees: equals # durian trees
Total coffee production in year 30: 20% higher compared to current coffee production
# coffee trees: 887
Results
# pepper poles: 336
# avocado trees: 28
# durian trees: 28
Area unsuitable for coffee production (water scarce)
Maximize the total gross revenue of an intercropped farming system
Goal
consisting of pepper, avocado and durian only over a 30-year time horizon
# pepper poles: maximum 2,500 poles
Constraints
# avocado trees: maximum 154 trees
# durian trees: maximum 154 trees
# avocado trees: equals # durian trees
Sum of avocado and durian trees: equals 70 trees
# coffee trees: 0
Results
# pepper poles: 1,362
# avocado trees: 35
# durian trees: 35
4Maximum gross revenue in this case, is defined within a framework of boundary conditions, i.e. assuring significant water
savings for irrigation, while increasing total coffee production by at least 20% in fully diversified cropping systems.
224.5.5 Calculation of investment costs and Return on Investment
To investigate the investment needs, a budget was constructed over a 20-year time horizon. The most
important costs are allocated to farmer training and awareness raising through communication media,
establishment of nurseries and production of seedlings as well as personnel and expert expenses
(cf. chapter 5.1.4).
To assess the cost and benefits of an investment program, the Return on Investment (RoI) was
calculated using Equation 4.1.
Equation 4.1 Return on Investment
(Gi − Ii )
RoIi =
Ii
RoI = Return on Investment in year i
G = Gross revenue in year i; i.e. sum gross yield per crop species (coffee, pepper,
avocado and durian) + cost savings for irrigation labor and energy
I = Investment in year i
4.5.6 Calculation of the profit/loss probability and risk exposure
In order to understand the probability of making an annual loss or profit and the associated value or
risk for the intercrop model compared to the current situation, a Monte Carlo simulation was
conducted.
At first, the historic prices for each crop were tested for normality using the Shapiro-Wilk test. This
showed that the time series deviate significantly from normality. Therefore, a Kernel Density
Estimation (KDE) was used to estimate the probability density functions for each historic crop price
timeseries. As an example, Figure 4.18 shows the non-normal distribution of historic coffee prices
(1991-2020) in a traditional histogram, while Figure 4.19 depicts its estimated probability density
function.
Figure 4.18 Traditional histogram of Figure 4.19 Kernel Density Estimation of
historic coffee prices (1991-2020) historic coffee prices (1991-2020)
Subsequently the probability density function was used to generate a set of 1,000 random coffee
prices following the trend depicted in Figure 4.19, applying Excel’s discrete random number generator.
For each year (total=30) and each crop (coffee, pepper, durian and avocado), this process was
repeated.
A similar approach was used, to generate 1,000 random crop yields per crop species and per year.
In this case a normal distribution was assumed with the modelled yield (cf. chapter 4.5.1 and 4.5.2)
per year as average and the standard deviation set equal to 25% of the average yield.
23Multiplying prices and yields results in
1,000 random gross income values per
year, for BaU in year 1 (i.e. a yield that
fluctuates around an average of 2.37;
cf. Figure 5.11, year 1) and the intercrop
model. Subtracting the gross income of
the intercrop model from the current
value gives the profit or loss for each
simulation run (n=1,000) in each year
(n=30). Figure 4.20 shows an example of
5 random trials over 30 years. The
Shapiro-Wilk test indicates that
profit/loss values are normally distributed
in each year. A subsequent frequency
analysis, i.e. counting the number of
negative (loss) and positive (profit) Figure 4.20 Random profit/loss value over time
values, generates the probability of profit Each line depicts a random trial out of 1,000 Monte Carlo simulation
or loss within each year and their runs over 30 years.
average annual absolute value. The profit/loss value is the difference between an intercropped
Multiplying the probability with absolute farming system and the current situation (USD/ha)
profit/loss value, finally results in a risk value (i.e. exposure to loss or profit).
4.5.7 Carbon sequestration
To understand the effect of crop diversification on climate change mitigation, sequestered carbon was
estimated. For Robusta coffee the allometric equation of Guillemot et al. (2018) was applied, while for
fruit trees such as avocado and durian, the generic model of Ketterings et al. (2001) was used
(Equation 4.2 and Equation 4.3). To convert biomass to carbon a factor 0.5 was used. Raw data on
trunk circumference for coffee (n=111) and trunk diameter for avocado and durian (n=35 for each
crop type) were obtained from Agri-Logic (2018). To simulate carbon sequestration over time, simple
correlations were made between crop age and the trunk circumference for coffee (R2 = 0.6178) and
trunk diameter for avocado and durian (respectively R2 = 0.7485 and R2 = 0.8032). The projected
crown diameter for coffee linearly increases to 9 m2 in year 8. Pepper was not included in the analysis
because it is not considered to contribute significantly to carbon sequestration.
Equation 4.2 Aboveground biomass for Equation 4.3 Aboveground biomass for
coffee fruit trees
Brobusta coffee = 0.0177 x C1.408 x PCA0.818 Bfruit tree=0.066×D2.59
B = Aboveground Biomass (kg / tree) B = Aboveground Biomass (kg / tree)
C = Circumference of the trunk at 30 cm (cm) D = Diameter trunk at breast height (cm)
PCA = Projected Crown Area (m2)
245. Results
5.1 Landscape level
5.1.1 Higher coffee production with fewer trees
Crop production simulation at the landscape level for the BaU scenario (i.e. all current coffee areas
in the Central Highlands) shows that the yield in year 1 for monocrop coffee, rejuvenated over
19 years, is about 1.55 million metric ton (Figure 5.1). This is in line with estimated Robusta figures
reported for the 2020/2021 crop year (i.e. 28 million 60 kg bags or 1.68 million tons on an estimated
area of 620,000 ha, 6% higher than the estimate in this study i.e. 586,000 ha; USDA GAIN, 2021).
Under monocrop (BaU) conditions, the total output reduces to a minimum of 950,000 t in year 6
(-39% vs. year 1), then recovers to break even in year 13 (1.67 mio. t) to reach a stable production of
~2.58 mio. t as of year 19. This is 66% higher compared to year 1.
In the second scenario, whereby coffee farms on suitable land are fully intercropped and coffee on
water scarce areas is replaced by other crops (a combination of pepper, avocado and durian), total
production in the Central Highlands drops to a minimum of 832,000 t in year 7 (-46% versus year 1),
then climbs to a break-even in year 16 (1.58 mio. t), reaching stable production in year 19 (1.87 mio.
t). This is 20% higher compared to year 1.
In the intercrop scenario, total production for pepper, durian and avocado in the Central Highlands
will reach an annual stable maximum of 0.13 mio. ton, 0.92 mio. ton and 1.1 mio. ton respectively in
year 25 (Figure 5.2).
Figure 5.1 Annual coffee production at Figure 5.2 Annual production per crop
landscape level species at landscape level
The red line depicts the BaU scenario (monocrop coffee For each crop species the total annual production for the
rejuvenated over 19 years) and the blue line shows the fully Central Highlands is shown (mio. t/y).
intercropped model (mio. t/y).
255.1.2 Higher gross revenue through diversified farming
In terms of gross revenue generation, the BaU scenario at landscape level results in a 66% increase
in average annual value, i.e. 5.18 billion USD/y as of year 19 compared to 3.12 billion USD/y in
year 1 (Figure 5.3) at an average coffee price of 2,000 USD/t. For the intercrop scenario the value
addition as of year 25 is twice year 1 or 26% higher compared to a stable coffee monocrop system.
In the intercrop system based on average prices, coffee contributes most to the value generation,
followed by durian, avocado and pepper (Figure 5.4).
Figure 5.3 Annual gross revenue at Figure 5.4 Annual gross revenue by crop
landscape level species at landscape level
The solid red line depicts the BaU scenario, the dotted red The gross income (billion USD) is calculated based on the
line shows the value for only coffee in an intercropped average crop price from 2011 until 2020.
system and the blue line shows the value for a fully
intercropped model (coffee + intercrops). The gross income
(billion USD) is calculated based on the average crop price
from 2011 until 2020.
26You can also read