Transmission Channels of Central Bank Asset Purchases in the Irish Economy
←
→
Page content transcription
If your browser does not render page correctly, please read the page content below

Article
Transmission Channels of Central Bank Asset
Purchases in the Irish Economy
Cormac Cawley and Marie Finnegan *
    School of Business, GMIT, H91 TRNW Galway, Ireland; c_cawley@hotmail.com
    * Correspondence: marie.finnegan@gmit.ie

    Received: 17 June 2019; Accepted: 13 September 2019; Published: 23 September 2019

    Abstract: The European Central Bank (ECB) engaged in an expanded asset purchase programme
    (APP) from 2014 to 2018 to help achieve their primary objective of price stability. Total assets
    purchased over this period was over €2.5 trillion and new net purchases ended in December 2018.
    This paper identifies whether the ECB’s APP in Ireland operated through the portfolio rebalancing
    channel, the signalling channel or the lending channel. It presents a quantitative descriptive analysis
    of some key Irish data sets in the 2014–2018 period and uses time-series visualisation and trend
    analysis to identify trends and correlations. There are a number of preliminary findings. First, much
    downward pressure on sovereign debt yields and spreads had occurred before the APP began due
    to previous accommodative monetary policy and the signalling channel. Second, the corporate-
    sector purchase programme (CSPP) did impact on targeted bonds and may have had spill overs to
    non-targeted bonds. Third, the APP did not lead to much increased lending to the SME sector.
    Fourth, while households did engage in traditional portfolio rebalancing, Irish banks did not and
    were perhaps more motivated to meet their capital requirements and manage their level of reserves.
    This is a first step towards understanding the transmission channels of ECB policy in Ireland and
    more work needs to be done to detangle the transmission of the most recent APP from other factors
    and consider these findings in the context of theoretical models. Such work is important to help
    inform policy makers on enhancing the transmission mechanism to the Irish economy of the recently
    launched new ECB asset purchase programme from November 2019.

    Keywords: quantitative easing; asset purchase programme; Ireland; transmission channels of QE

    JEL Classification: E52; E58

1. Introduction
      In 2013 and 2014, Euro-area inflation was falling well below the European Central Bank’s (ECB)
price stability target of below, but close to, 2 percent over the medium term. In 2014, the ECB decided
to engage in an expanded asset purchase programme (APP), a quantitative easing (QE) effort, aimed
at returning inflation to levels consistent with this price stability target (ECB 2014a, 2015, 2016)1. The
initial asset purchase programme comprised two separate programmes, which included the third
covered bond purchase programme 2 (CBPP3) launched in October 2014 and an asset-backed
securities purchase programme (ABSPP) in November 2014. This programme was expanded to
include a secondary markets public-sector asset purchase programme (PSPP) initiated in March 2015

1     QE and APP will be used interchangeably in this paper as they are taken to mean the same monetary policy.
2     The ECB had engaged in covered bond purchases before 2014 with a covered bond purchase programme
      (CBPP) announced in May 2009.

Economies 2019, 7, 98; doi:10.3390/economies7040098                             www.mdpi.com/journal/economies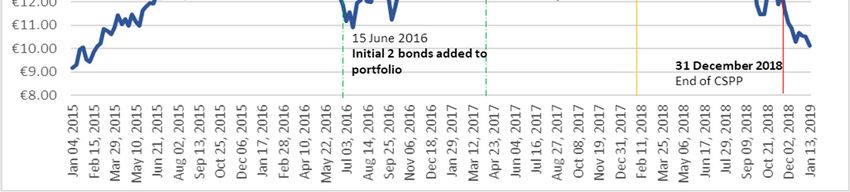
Economies 2019, 7, 98                                                                               2 of 26

and a corporate-sector purchase programme (CSPP) in March 2016. Collectively, these programmes
are referred to as the expanded asset purchase programme or quantitative easing.
      Between September 2014 and the end of 2018, the ECB purchased over €2.5 trillion worth of
securities under these four programmes 3 (Larkin et al. 2019, p. 3). Net APP purchases ended in
December 2018 with reinvestment of maturing principal amounts occurring from January 2019. This
is expected to continue well past the time when the ECB begin to increase key interest rates (ECB
2019b).
      The economics literature suggests that central bank asset purchases affect the macroeconomy
through three main channels: the portfolio rebalancing channel, the signalling channel and the
lending channel (Benford et al. 2009, pp. 93–95; Dunne et al. 2015, p. 65; Gern et al. 2015, p. 207; Brózda
2016, p. 755). In a European context, there is much empirical evidence on the existence of the portfolio
channel (Urbschat and Watzka 2017, p. 27; Albertazzi et al. 2018, p. 2); the signalling channel
(Altavilla et al. 2015, p. 2; Neugebauer 2018, p. 22; Zaghini 2019, p. 21) and the lending channel
(Tischer 2018, p. 35). In Ireland, Larkin et al. (2019, p. 22) found strong evidence that the signalling
effect was present in the Irish bond market.
      This paper contributes to the literature by expanding this focus to the operation of all three
transmission channels in Ireland. The main research question is to identify whether the ECB’s APP
in Ireland operated through the portfolio rebalancing channel, the signalling channel or the lending
channel. It is a first attempt to identify if the channels were operative and if there were any possible
barriers to their operation in Ireland. This paper presents a quantitative descriptive analysis of some
key data sets in the 2014–2018 period when the ECB was undertaking asset purchases. The aim is to
identify initial trends and possible correlations in key variables over this period through time-series
visualisation and trend analysis and point to areas for further investigation in the context of
theoretical models. This work is important to help inform policy makers on the likely effects of the
recently announced new ECB asset purchase programme starting in November 2019.
      The remainder of this paper is divided into five sections. Section 2 provides a literature review
which provides a theoretical perspective on how the portfolio rebalancing channel, the signalling
channel and the lending channel transmit central bank asset purchases to the macro economy. Section
3 documents the data description and analysis. Section 4 presents a summary of the main findings.
Section 5 discusses some of the main findings from the data analysis with reference to the literature.
Section 6 offers some concluding remarks.

2. Literature Review
     From a theoretical perspective, the ECB’s expanded asset purchase programme was aimed at
further enhancing the transmission of monetary policy, facilitating credit provision to the euro area
economy, easing borrowing conditions for households and businesses and ultimately contributing to
returning inflation rates to levels below, but close to, 2 percent over the medium-term, consistent
with the ECB’s primary objective of maintaining price stability (ECB 2015; ECB 2016).
     Dunne et al. (2015, p. 65) identify three primary channels in the economic literature through
which a central bank’s purchases of assets can affect the real economy: the portfolio rebalancing
channel, the bank lending channel and the signalling channel. Figure 1 presents these three
transmission channels and their macroeconomic outcomes (Dunne et al. 2015, p. 65). The main
research question in this paper is to identify whether the ECB’s APP in Ireland operated through the
portfolio rebalancing channel, the signalling channel or the lending channel. This section presents
theoretical perspectives on these three channels. Section 2.1 considers the portfolio rebalancing
channel, Section 2.2 the signalling channel and Section 2.3 the bank lending channel.

3   Purchases by the ECB are taken to mean purchases by the Eurosystem, including the ECB and the national
    central banks of euro-area countries.
Economies 2019, 7, 98                                                                                   3 of 26

      Figure 1. Transmission channels of asset purchases to the macro economy (Dunne et al. 2015, p. 66).

2.1. Portfolio Rebalancing Channel
      The portfolio rebalancing channel operates via incentivising institutions to rebalance their
portfolio from safe assets, like government bonds, to riskier assets with higher expected returns, like
corporate bonds or loans, in their search for higher yield (Albertazzi et al. 2018, p. 1 and Tischer 2018).
Theoretically, the central bank buys government bonds and this increased demand increases
government bond prices and decreases their yield. This, in turn, indirectly pushes down yields on
corporate debt as some investors rebalance their portfolios away from government debt with
suppressed yields and towards corporate debt in which the yield is higher (Joyce et al. 2014, p. 3;
Gern et al. 2015, p. 207). This, in turn, pushes up corporate bond prices and decreases their yield.
      Alternatively, central banks can directly buy private sector assets, which directly increases
corporate asset prices and reduces their yields (Gern et al. 2015, p. 208). The higher asset prices have
a wealth effect on asset holders and this, should, in theory, boost their spending (Joyce et al. 2014, p.
7; Dunne et al. 2015, p. 67). Sovereign bond yields are used in the pricing of a broad range of interest
rates relevant to the real economy (Larkin et al. 2019, p. 5). The lower yields across the economy
should make loans cheaper, allowing households and firms to borrow more and repay their debt
more cheaply. This should feed into higher consumption and investment and eventually feed
through to higher prices, helping to achieve the ECB’s overall objective of price stability (De Santis et
al. 2018, p. 66).
      Empirical evidence in support of this transmission mechanism has been found in a number of
countries. Krishnamurthy and Vissing-Jorgensen (2013, p. 101) and Carpenter et al. (2015, p. 230),
among others, showed evidence of this channel in the US associated with the Federal Reserve’s QE
programme. Joyce et al. (2014, p. 1) argued that investors shifted their portfolios away from
government bonds towards corporate bonds due to the Bank of England’s QE Programme. In the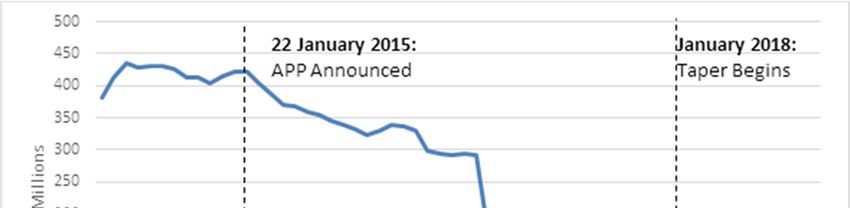
Economies 2019, 7, 98                                                                             4 of 26

euro area, Urbschat and Watzka (2017, p. 27), Neugebauer (2018, p. 22) and Larkin (2019, p. 12) all
show evidence of declining yields on sovereign government bonds, with peripheral countries’ bond
yields declining by more than core countries’ bond yields. Albertazzi et al. (2018, p. 2) found that
portfolio rebalancing played a relevant role in the transmission of the ECB’s APP, with rebalancing
skewed more towards loans in non-vulnerable countries compared to vulnerable countries such as
Ireland.
     The literature also suggests that the APP may have impacted both targeted government and
corporate bonds and non-targeted or non-eligible bonds (Albertazzi et al. 2018, p. 2). For example,
Altavilla et al. (2015, p. 40) found that the ECB asset purchase programme significantly lowered yields
in a broad set of market segments and there have been spill-overs to non-targeted assets, with this
spillover accentuated by the low degree of financial stress prevailing at the announcement of the
programme. In addition, Zaghini (2019, p. 21) found evidence of a significant impact of the CSPP on
yield spreads, both directly on purchased and targeted bonds and indirectly on other bonds.

2.2. The Signalling Channel
      Eggertsson and Woodford (2003, p. 67) have argued that the key to dealing with a situation in
which monetary policy is constrained by the zero-lower bound on short-term nominal interest rates
is “the skilful management of expectations regarding the future conduct of policy”. Gern et al. (2015,
p. 207) and Moessner and Rungcharoenkitkul (2019, p. 83) consider the signaling channel to be one
of the most prominent channels of central bank asset purchases and that, in practice, it takes the form
of forward guidance communication strategies employed by many central banks to influence
expected and actual short-term interest rates.
      The ECB officially started using forward guidance in July 2013 by announcing that it expected
“the key ECB interest rates to remain at present or lower levels for an extended period of time” (ECB
2014b, p. 65). Forward guidance has been maintained as a monetary policy since then. Gern (2015,
pp. 207–8) and Bhattarai et al. (2015, p. 32) suggest that QE actually strengthens the credibility of the
central bank to keep interest rates low for a prolonged period of time because an earlier exit from this
strategy would trigger losses for the central bank. The expectation of low-level of long-run real
interest rates should encourage spending and increase credit demand. This should stimulate
consumption, investment and net exports and ultimately increase inflation back up towards the
ECB’s 2 percent target over the medium-term (ECB 2014b, pp. 65–66).
      In addition, the signaling of the lower expected interest rates should weaken the currency and
increase demand for exports. The weaker currency should also feed into higher import prices and so
raise inflation and inflation expectations (Dunne et al. 2015, p. 69). This is sometimes referred to as
the exchange rate channel (Glick and Leduc 2013, p. 19 and Haldane et al. 2016, p. 10). A related point
is that when the ECB buys Euro-area bonds from non-euro area holders, the portfolio rebalancing
effect outlined above should also weaken the exchange rate and, therefore, impact on prices.
      Empirical evidence in support of the signalling transmission mechanism has been found in the
euro area. Altavilla et al. (2015, p. 2) demonstrate that the bulk of the impact of asset purchase
programmes is found to arise at announcement (“stock effects”), whereas “flow effects” generated
by the actual implementation of the purchases are limited. Urbschat and Watzka (2017, p. 27) found
that the effects in yield and spread reduction were most pronounced for the initial announcement on
the PSPP but declined afterwards for additional announcements. Neugebauer (2018, p. 22), using an
event study, found that the effects of ECB’s asset purchase announcements on euro-area government
bond yields arose with a one-day delay. In an Irish context, Larkin et al. (2019, p. 22), who also uses
an event study, showed that the announcement effect related to PSPP reduced Irish sovereign bond
yields significantly and contributed to a flattening of the yield curve. In terms of the CSPP, Zaghini
(2019, p. 21) found that the announcement of the CSPP programme in March 2016 had an immediate
effect on bond trades.
      Empirical evidence also exists for the exchange rate effect due to signaling effects. For example,
Demertzis and Wolff (2016, p. 8) suggested the expected interest rate differential arising from
announcements undermined EUR/USD, with much of the decline occurring with discussions about
Economies 2019, 7, 98 5 of 26
when and how the ECB would start the PSPP. Indeed, Ferrari et al. (2017, p. 25) found that the
exchange rate was more sensitive to monetary policy when the effective lower-bound interest rate
became increasingly binding. This is supported by Dedola et al. (2018, p. 1), who found that the ECB’s
APP programme led a depreciation in the euro relative to the USD of 12 percent between September
2014 and the end of 2016 and that the signaling channel contributed to the exchange rate response to
QE. This is especially important in the context of a small open economy like Ireland.
2.3. Bank Lending Channel
The traditional bank lending channel can occur directly, with institutions selling bonds to the
ECB and using the proceeds to extend credit to the real economy (ECB 2015), or indirectly through
banks’ lending a proportion of their increased deposits, from investors who have sold bonds to the
ECB and lodged the proceeds in their bank accounts, to households and firms (Butt et al. 2014, p. 1).
In particular, banks keep a proportion of their increased deposits to meet their reserve, liquidity and
capital requirements but will use excess funds to finance loans at higher interest rates than they could
earn if they left it on deposit at negative interest rates at the ECB (Dunne et al. 2015, p. 68). Indeed,
the negative ECB deposit facility rate (−40 basis points since March 2016) encourages lending and
accentuates the effect of the APP on credit supply by increasing the cost of holding the reserves
injected via the APP, thus incentivising banks to rebalance towards bank loans4 (Altavilla et al. 2019,
p. 35). This channelling of funds from deposits to productive firms and households is essential to
ensuring investment and growth (Altavilla et al. 2019, p. 3), especially in times of stress (Bruno et al.
2017, p. 25), and ultimately impacting on higher inflation levels and a return to price stability.
Empirical evidence in support of the traditional bank lending channel is mixed. For example,
Butt et al. (2012, p. i) found no evidence to suggest that the Bank of England’s QE operated via a
traditional bank lending channel. Tischer (2018, p. 35), using data on German banks for 2014–2016,
showed that QE encouraged banks to rebalance from securities to loans but that this was primarily
motivated by portfolio rebalancing, as described above.
It is worth noting that there is another view that argues that the level of deposits or reserves in
banks are not important in determining bank lending (Disyatat 2010, p. 2). This is reflected in the
theory of ‘endogenous money’, which suggests that bank lending is not constrained by banks’ level
of deposits and reserves but by what banks view as ‘credit-worthiness’ in borrowers, the interbank
market, quest for profitability, and liquidity controls by central banks (Lavoie 2014, p. 193). This
theory has gained traction in central banking circles. For example, McLeay et al. (2014, p. 1) from the
Bank of England and the Bundesbank (2017, p. 17), have suggested that banks can grant loans without
any prior inflows of deposits. This is relevant to the ECB’s APP as it suggests that central bank
purchases of secondary market assets are not necessary to spur bank lending. Fullwiler (2013, p. 186),
referring to QE specifically, argues that “since banks require neither reserve balances nor deposits to
make loans…adding to the stock of either does not in itself stimulate the economy”.
The literature also suggests that well-capitalised banks are a prerequisite to an effective bank
lending channel arising from unconventional monetary policy. For example, Boeckx et al. (2016, p. 3)
found that better capitalised banks have, on average, responded more to ECB’s credit support policies
used in the pre-APP years. Albertazzi et al. (2016, p. 16) found that capital and economic constraints
were the key dimension that determined the extent to which banks transmit non-conventional
monetary impulses via shifts in lending supply. Bruno et al. (2017, p. 26), also focusing on the pre-
APP years, showed that the main bank characteristics affecting lending are size, capitalisation,
liquidity, and ownership and, to a lower extent, reliance on deposits. In addition, Altavilla et al. (2019,
p. 38) reported that the APP led to increased loan volumes in the Euro area and the impact was
stronger for banks with larger holdings of sovereign bonds.
4 Andrade et al. (2016, pp. 19–22); Tischer (2018) also suggest that quantitative easing can increase banks’
equity through higher asset prices and that this also is conducive to a more productive lending environment.Economies 2019, 7, 98 6 of 26
3. Data Description and Analysis
The main research question for this study is to identify whether the ECB’s APP in Ireland
operated through the portfolio rebalancing channel, the signalling channel or the lending channel.
This paper uses a quantitative descriptive analysis of some key data sets in the 2014–2018 period
when the ECB was undertaking asset purchases. The aim is to identify trends and possible
correlations in key variables over this period through time-series visualisation and trend analysis and
point to areas for further investigation in the context of theoretical models.
Given the relative confidentiality of NCB-related purchases (ECB 2014c), finding data on the
impact of the APP via these three channels in Ireland was difficult. In particular, it was necessary to
find data on purchase quantities, programme participants and the market response. This data was,
therefore, compiled from combining data from various sources. Data was sourced for the two core
components of the APP, the PSPP and CSPP. The rationale for this was that these two programmes
were the main constituents of the APP. Figure 2 shows the APP Net purchases by Programme in
October 2018. It can be seen that the bulk of the APP centered on the PSPP (81.8 percent as at October
2018) and the CSPP (10.24 percent as at October 2018).
Figure 2. Asset purchase programme (APP) Net Purchases by Programme, October 2018.
Data for the PSPP purchases were sourced from Amundi Research’s monthly compilation of
statistics on each Eurozone nation’s purchases under the PSPP. CSPP purchases and figures were
sourced from UniCredit, whom disclosed the ECB’s CSPP portfolio in research reports. Historical
corporate bond data was garnered from ISIN codes published by the Central Bank of Finland (which
conducted the CSPP purchases for Ireland).
The data sources used for the purposes of bank lending analysis were collated from the Central
Bank of Ireland’s Credit and Banking Statistics and Quarterly National Accounts data. Concerning
securities holdings statistics, this report uses the aggregate balance sheets for Irish Headquartered
Credit Institutions, as opposed to the broader Domestic Market Credit Institutions data. The rationale for
this is that this data encompasses national banks that have accounts with the Irish central bank and
domestic clients, as opposed to investment banks and so-called O-SIIs (Other Systemically Important
Institutions) that operate outside of the regulatory parameters of depository financial institutions, and
do not have accounts with the Irish central bank and, therefore, did not participate in the APP
directly. Additional reference material has been taken from Bruegel’s Sectorial Sovereign Bond
Holdings database, as well as the European Central Bank’s Statistical Data Warehouse on Securities
Holding Statistics.Economies 2019, 7, 98 7 of 26
There are a number of caveats to this approach. First, there are limitations to the availability of
the data. For example, aggregate bank balance sheets detail only security holdings by sector and not
by maturity. Second, lending statistics from non-financial corporations (NFC) are not readily
available, which would have been an insightful counterpart to the SME lending data gathered.
However, SMEs form an intrinsic part of the Irish economy. There are currently 248,344 SMEs in
Ireland (Houses of the Oireachtas 2019, p. 29), which comprises 99.7% of all Irish NFCs (ibid., p. 11).
Additionally, as SMEs are generally restricted to domestic bank-based funding, they provide a more
accurate picture of the effectiveness of the APP’s bank-lending channel within Ireland.
Third, this approach does not derive an operational model from the theory and run regressions
to test a hypothesis as per much literature cited here. However, it does shed light on the transmission
channels for QE to the Irish economy and points to possible areas for further investigation. The links
drawn are not definitive and more work will need to be done to disentangle the impact of the APP
from other factors and consider these findings in the context of theoretical models.
4. Findings
This section describes the initial findings that the two main programmes in the APP, the PSPP
and the CSPP, had on the Irish economy. It is divided into three sections. Section 4.1 presents findings
arising from the PSPP on Irish government bonds and Irish debt. Section 4.2 shows the findings
arising from the CSPP on corporate bonds. Section 4.3 considers the portfolio rebalancing of
households and banks and the lending behavior of Irish banks from the APPs announcement in
January 2015.
4.1. The PSPP and the Irish Economy
Between March 2015 and December 2018, the ECB conducted net purchases of public-sector
securities under the PSPP. This section considers public-sector purchases in Ireland and is divided
into three sections. Section 4.1.1 details the Irish Central Bank’s purchase of bonds over the period
March 2015 to December 2018. Section 4.1.2 shows the impact on Irish government bond yields.
Section 4.1.3 reflects on the impact of the PSPP on Irish long-term debt.
4.1.1. Description of the Irish PSPP
As of 31 December 2018, cumulative net purchases of Irish government bonds by the ECB
amounted to €30.1 billion (Larkin et al. 2019, p. 7). Table 1 shows a breakdown of the Central Bank of
Ireland’s purchase of sovereign debt from March 2015 to November 2018.
Table 1. Irish public-sector asset purchase programme (PSPP) Monthly Purchases.
Total Holdings Monthly Purchase Total Holdings Monthly Purchase
(€Billions) (€Billions) (€Billions) (€Billions)
Mar-15 0.80 0.80 Feb-17 19.70 0.60
Apr-15 1.50 0.70 Mar-17 20.20 0.50
May-15 2.20 0.70 Apr-17 20.80 0.60
Jun-15 3.00 0.80 May-17 21.30 0.50
Jul-15 3.80 0.80 Jun-17 21.80 0.50
Aug-15 4.40 0.60 Jul-17 22.40 0.60
Sep-15 5.20 0.80 Aug-17 22.90 0.50
Oct-15 6.10 0.90 Sep-17 23.40 0.50
Nov-15 6.90 0.80 Oct-17 23.50 0.10
Dec-15 7.60 0.70 Nov-17 24.60 1.10
Jan-16 8.40 0.80 Dec-17 25.30 0.70Economies 2019, 7, 98 8 of 26
Feb-16 9.20 0.80 Jan-18 25.70 0.40
Mar-16 10.00 0.80 Feb-18 26.10 0.40
Apr-16 11.10 1.10 Mar-18 26.50 0.40
May-16 12.20 1.10 Apr-18 27.10 0.60
Jun-16 13.20 1.00 May-18 27.60 0.50
Jul-16 14.20 1.00 Jun-18 28.20 0.60
Aug-16 14.90 0.70 Jul-18 28.75 0.55
Sep-16 15.90 1.00 Aug-18 29.30 0.55
Oct-16 16.90 1.00 Sep-18 29.60 0.30
Nov-16 17.90 1.00 Oct-18 29.80 0.20
Dec-16 18.60 0.70 Nov-18 29.90 0.10
Jan-17 19.10 0.50
Source: Amundi (2015–2019).
The table shows that the PSPP began with an initial purchase of €800 million of Irish bonds in
March 2015. Irish bond purchases declined from November 2016, which could be referred to as an
early ‘Irish tapering’, 13 months prior to the official ECB tapering of January 20185. They increased in
the month of November 2017 to €1.1 billion and then tapered, in line with the ECB official tapering.
This pattern can also be seen in Figure 3.
Billion (€)
1.2
November 2016
1.0 Irish Purchases
Reduced
0.8 January 2018
Official Tapering Begins
0.6
0.4
0.2
0.0
Figure 3. Irish PSPP Purchases Per Month. Data sourced: Amundi (2015–2018).
The ECB’s capital key was used to guide net purchases given that the ECB was buying bonds
across many different sovereign bond markets on a monthly basis (ECB 2019a). Figure 4 shows Irish
PSPP purchases as a percentage of all PSPPs versus the Irish allocated capital key of 1.65%. It can be
seen that a precise achievement of the capital key was not achieved each month, with some flexibility
built in to support the smooth implementation of the programme (ECB 2019a). However, as of 31
December 2018, cumulative net purchases of Irish government bonds by the ECB amounted to €30.1
billion, which represents a 1.55 percent share of total PSPP purchases (excluding supranational
bonds) (Larkin et al. 2019, p.7).
5 Official ECB tapering refers to the first major reduction of purchases from €60 billion until December 2017,
to €30 billion in January 2018. See the chronology of asset purchases here:
https://www.ecb.europa.eu/mopo/implement/omt/html/index.en.html.Economies 2019, 7, 98 9 of 26
3.10% January 2018
Tapering
2.60%
September 2016
True Taper Begins?
2.10%
1.60%
1.10%
0.60%
0.10%
Nov-15
Nov-16
Nov-17
Mar-15
May-15
Jul-15
Sep-15
Jan-16
Mar-16
May-16
Jul-16
Sep-16
Jan-17
Mar-17
May-17
Jul-17
Sep-17
Jan-18
Mar-18
May-18
Jul-18
Sep-18
Ireland Capital Key 1.607% Ireland monthly % of PSPP
Figure 4. Irish PSPP Purchases (as % of all PSPP) vs. Allocated Capital Key. Source: Amundi (2015–
2018).
4.1.2. Impact on Irish Government Bond Yields
Irish bond yields have fallen substantially since 2011. Figure 5 shows the decline in the yield on
10-year bonds from January 2011 to October 2018. As evidenced here, much of the drop in Irish bond
yield was primarily caused by monetary policy outside of the PSPP, including the longer-term
refinancing operations (LTRO) announced in December 2011 and Outright Monetary Transactions
(OMT) announced in September 2012. In addition, some of the decrease can be attributed to
continuously low interest rates employed by the ECB from 2012. Figure 5 also shows that the initial
downward price action on government yields was far more driven by the announcements or forward
guidance of the various policies than by the implementation of the policies themselves. For example,
the PSPP was announced in January 2015 and implemented from March 2015, after which very little
price action occurred.Economies 2019, 7, 98 10 of 26
Figure 5. Irish 10-Year Bond Yield, January 2011–October 2018 Sources: St Louis. Fed, European
Central Bank; Tabulated in Excel.
Figure 6 compares the yields on 2-, 5- and 10-year Irish treasury bonds. It can be seen that overall,
yields did narrow but that this was prior to the PSPP’s launch in March 2015. For example, the spread
between 10- and 2-year bonds decreased from 242 basis points in May 2014 to just 78 basis points (a
decline of 164 basis points) in May 2015. However, the following year when PSPP purchases were
active, the spread actually increased on average. Similarly, the yield on 10-year (benchmark) bonds
decreased from 3.02% in January 2014 to 0.757% year-on-year to March 2015, but only fell to 0.733%
the following year. Two-year yields first entered negative territory at the beginning of the PSPP,
logging −0.21% in March 2015, a trend which has held steady through tapering. Since March 2015,
term spreads have remained at a relatively steady rate.
3.6
3.1
March 2015 January 2018
2.6 September 2016 Overall Tapering
PSPP Begins
2.1 Irish Taper Begins
1.6
1.1
0.6
0.1
-0.4
-0.9
Jul-14
Jul-15
Jul-16
Jul-17
Jul-18
May-14
Nov-14
May-15
Nov-15
May-16
Nov-16
May-17
Nov-17
May-18
Nov-18
Jan-14
Jan-15
Jan-16
Jan-17
Jan-18
Jan-19
Mar-14
Sep-14
Mar-15
Sep-15
Mar-16
Sep-16
Mar-17
Sep-17
Mar-18
Sep-18
10 yr Price 2 yr Price 5 yr Price
Figure 6. Term Spreads—2-, 5- and 10-Year Government Bond Yields, January 2014–January 2019.
Source: Investing.com.
4.1.3. Impact of PSPP on Irish Long-Term Debt
The findings suggest that the NTMA (National Treasury Management Agency), the Irish state
agency that manages the national debt, used the APP to extend the maturity profile of Irish debt.
Figure 7 shows an inverse relationship between the proportion of PSPP purchases in Ireland for a
given quarter (as per national accounts) and the decrease in Irish long-term securities-based debt over
that same period. Using ‘Q1 2015’ as the anchor-point (0%), Figure 7 shows that trajectory of the two
variables are similar. Table 2 shows some descriptive statistics, which correspond to Figure 7. The
correlation coefficient shows that there is a relatively strong correlation of 0.64 between the
government level of long-term debt and PSPP purchases over the period Q1 2015 and Q3 2018. This
suggests that there is a motivation for exploring this relationship further with regression analysis.Economies 2019, 7, 98 11 of 26
September 2016: January 2018:
154 3.5
PSPP Purchases Reduce Tapering
152
3
150
148 2.5
€ (Billions)
€ (Billions)
146 2
144
142 1.5
140 Long-Term Securities 1
138 Debt Returns 0.5
136
134 0
2015 2015 2015 2015 2016 2016 2016 2016 2017 2017 2017 2017 2018 2018 2018
Q1 Q2 Q3 Q4 Q1 Q2 Q3 Q4 Q1 Q2 Q3 Q4 Q1 Q2 Q3
PSPP Quarterly Purchases (RHS) Long-Term Securities Debt (LHS)
Figure 7. Irish Long-Term Security Debt to PSPP Purchases. Source: Central Bank of Ireland.
Subsequently, government debt outstanding in long-term bonds have returned to pre-PSPP
levels (0% level on fig above), first by the initial ‘Irish-only’ tapering that began in November 2016
and then the official ECB tapering from January 2018.
Table 2. Irish Long-Term Security Debt to PSPP Purchases.
Government Long-Term Securities PSPP Quarterly Purchases
Mean 146 1.973
Variance 11.162 0.416
Median 148.506 1.9
Standard deviation 3.341 0.645
Correlation coefficient −0.6432
4.2. The CSPP and Corporate Bonds
Between June 2016 and December 2018, the ECB conducted net purchases of corporate-sector
bonds under the corporate-sector purchase programme (CSPP) (ECB 2019a). This section considers
the impact of the CSPP on corporate bonds in the Irish economy. Section 4.2.1 describes the CSPP in
Ireland. Section 4.2.2 considers a case study of one company, Ryanair, as a targeted bond of the ECB.
Section 4.2.3 looks at spill overs from the CSPP to non-targeted bonds.
4.2.1. The CSPP in Ireland
In Ireland, commencing from 8 June 2016, the Corporate-Sector Purchase Programme involved
the ECB buying Irish non-sovereign bonds via the Finnish Central Bank (2016). Table 3 shows the
Irish corporate bonds that were bought, all of which are or have been listed on the Irish Stock
Exchange. These were identified by tracing the ISIN (International Securities Identification Number)
codes published as eligible holdings for securities lending (Bank of Finland 2018).Economies 2019, 7, 98 12 of 26
Table 3. Irish corporate-sector purchase programme (CSPP) Bonds (listed by CSPP purchase date).
Date of Initial Issue
ISIN Issuer Coupon Maturity CSPP Purchase Date
Issue Volume (€mn)
XS1419674525 Dublin Airport Authority 1.554 7/06/28 07/06/16 15/07/16 290
XS1239586594 ESB 2.125 08/06/27 05/06/15 15/07/16 850
XS1288849471 Kerry Group 2.375 10/09/25 10/09/15 15/07/16 850
XS1077584024 Ryanair 1.875 17/06/21 17/06/14 15/07/16 500
XS1199964575 Ryanair 1.125 03/10/23 10/03/15 15/07/16 750
XS0375220588 Dublin Airport Authority 6.872 09/07/18 09/07/08 29/07/16 400
XS1428782160 ESB 1.875 14/06/31 14/06/16 29/07/16 600
XS1505896735 CRH 1.375 18/10/28 18/10/16 21/10/16 600
XS1529684695 Gas Networks Ireland 1.375 05/12/26 05/12/16 20/01/17 500
XS1560853670 ESB 1.75 07/02/29 07/02/17 10/02/17 500
XS1565699763 Ryanair 1.125 15/08/23 15/02/17 17/02/17 750
Sources: Bank of Finland, Finanzen De, Unicredit.
It can be seen that the Irish component of the CSPP was highly concentrated, with three of the
beneficiaries being state-owned (ESB, Gas Networks Ireland) or semi-state bodies (DAA), most of
which had multiple bonds bought. The remainder were purchased by Designated Activity Company
(DAC) subsidiaries of private firms; Ryanair, Kerry Group and CRH6. The maturities of these bonds
were varied in accordance with the CSPP’s aim of lowering interest rates across the investment-grade
spectrum. Figure 8 shows the initial bond term and the years remaining for these bonds as of March
2019.
DAA 6.5872%
Kerry Group 2.375%
ESB 2.125%
Issuer + Coupon %
ESB1.875%
Ryanair 1.875%)
ESB 1.75%
GAS Networks Ireland 1.75%
DAA 1.554 %
CRH Finance DAC 1.375%
Ryanair 1.125%
Ryanair 1.125%
0 2 4 6 8 10 12 14 16
Years
Initial bond term Years Remaining (Coupon Payments)
Figure 8. Irish CSPP Bond Term Structure/Remaining (as at March 2019). Source: Bank of Finland
(2018), Börse Frankfurt.
This programme has provided a select subsection of Irish NFCs with indirect funding with total
net holdings of €1.345 billion by June 2018 (53 percent of Ireland’s capital key of 1.607 percent). The
following section considers a case study of one such company, Ryanair.
4.2.2. CSPP Case Study: Ryanair
This section takes a case study approach to consider the impacts of the CSPP on one company
quoted on the Irish Stock Exchange (ISEQ). Ryanair is chosen as it was one of the largest beneficiaries
6 It is worth noting that the Irish corporate bond market is relatively thin compared to, for example, the French
corporate bond market.Economies 2019, 7, 98 13 of 26
of the CSPP. Table 4 shows the purchase of Ryanair’s bonds by the Central Bank of Finland with an
initial purchase made on 15 July 2016.
Table 4. Ryanair bond purchases by the Central Bank of Finland.
Initial ECB
15/072016 15/07/2016 17/02/2017 Total
Purchase
ISIN XS1077584024 XS1199964575 XS156569963
Coupon 1.875 1.125 1.125
Maturity 17/06/21 10/3/23 15/8/23
Date of issue 17/06/2014 10/03/2015 15/02/2017
Initial (€mn) 850 850 750
Holdings as at
€38,484,542.53 €38,484,542.53 €76,969,085.06
Sept 2016
Holdings as at
€147,381,620.72 €142,205,088.32 €125,249,704.23 €414,836,413.77
Nov 2017
Holdings as at
€164,597,763.51 €159,594,371.03 €140,383,694,33 €464,575,828.87
March 2018
Holdings as at
€169,361,040.92 €163,675,808.38 €143,799,186.96 €476,836,036.27
June 2018
% of Irish CSPP
12% 13% 11% 37%
Portfolio
Source: UniCredit (2016–2018).
Rather than expanding the purchases to different companies as the programme continued, the
ECB increased net purchases within the existing portfolio each month. Shown here is that Ryanair
net purchases increased sharply during the initial purchase phase, with holdings increasing from
€76.83 to €414.84 million between September 2016 and November 2017. Purchases reflected a constant
weighting of 0.32% in the overall CSPP and 37% in its Irish component in the financial statements
observed. It is also worth noting that the ECB added the second 1.125% 2023 bond just two days after
its first date of issuance.
While this data does not isolate the impact of the APP on Ryanair bond performance relative to
other factors, such as Ryanair strikes and cancellations over this time period, it is, however, likely
that admission to the CSPP created higher bond prices due, in part, to anticipated and actual CSPP
demand. Figure 9 shows the Ryanair 1.875% 2021 bond performance through the CSPP. It can be seen
that the 1.875% 2021 bond rose in value from €101.96 in January 2016 (on the announcement of the
CSPP), to a high point of €108.60 in May 2016. With a sustained increase in purchases by the ECB
held monthly between June 2016 and December 2017 (after which tapering began), these bonds
remained on an elevated plateau of a price average of €105.74 over the CSPP’s duration with a
standard deviation of 0.79. Although an official ECB taper did not occur until December 2018,
investment in the CSPP portfolio components slowed far sooner. After tapering, this price has
declined down to €102.82 by February 2019.Economies 2019, 7, 98 14 of 26
110
9 March 2015 15 July 2016
108 PSPP Begins Added to CSPP Portfolio
Bond Value (€)
106 10 March 2016
CSPP
104 Announced Stable, elevated price through
CSPP
102
100
98
Aug-14
Aug-15
Aug-16
Aug-17
Aug-18
Feb-15
May-15
Feb-16
May-16
Feb-17
May-17
Feb-18
May-18
Feb-19
Nov-14
Nov-15
Nov-16
Nov-17
Nov-18
Figure 9. Ryanair 1.875% 2021 Performance through CSPP. Source: Bank of Finland (2018), Börse
Frankfurt.
Regarding corporate performance, Ryanair’s participation in the CSPP coincided with a significant
jolt to its share price. Figure 10 shows that when CSPP commenced, Ryanair share prices rose from
€12.97 on the date of Ryanair’s first two CSPP bond commencements, 15 June 2016, to €14.18 on
issuance of its third bond to the ECB on 17 February 2017. The share price reached a high of €18.60 on
13 August 2017 and has—since tapering—decreased significantly.
Figure 10. Ryanair Share Price through CSPP. Source: Börse Frankfurt.
Figure 11 shows the performance of Ryanair shares relative to the overall ISEQ index over the
period January 2014 to March 2019. Pre the CSPP in 2016, it indicates that Ryanair share prices were
closely correlated with the overall ISEQ index. Furthermore, Table 5 shows that Ryanair share prices
had a very strong correlation of 0.956 to the market between January 2014 and May 2016. Figure 11
shows this correlation deteriorating after the introduction of CSPP, with the Ryanair share price
outperforming the ISEQ. Table 5 shows the correlation coefficient fell to 0.576 from June 2016 to
February 2017 with the introduction of the first two bonds to the CSPP. This fell further to 0.068 from
February 2017 to January 2018 when the second Ryanair bond was added to the CSPP portfolio. The
change in these correlations warrants further investigation to isolate the impact of CSPP on Ryanair’s
share price performance.Economies 2019, 7, 98 15 of 26
€ Ryanair (LHS) ISEQ Overall (RHS)
20 10,000.00
15th July 2016 January 2018
18 Tapering Begins
Ryanair Introduced to CSPP 9,000.00
16
8,000.00
14
12 7,000.00
10
6,000.00
8
5,000.00
6
4 4,000.00
Aug 20, 2014
Aug 17, 2017
Jan 02, 2014
Feb 27, 2014
Apr 28, 2014
Apr 08, 2015
May 16, 2016
Jun 25, 2014
Apr 25, 2017
Oct 15, 2014
Feb 09, 2015
Jun 05, 2015
Jun 05, 2018
Dec 10, 2014
Jul 31, 2015
Sep 25, 2015
Jan 20, 2016
Jul 12, 2016
Sep 06, 2016
Feb 24, 2017
Jun 22, 2017
Oct 12, 2017
Feb 06, 2018
Apr 06, 2018
Jul 31, 2018
Sep 25, 2018
Jan 18, 2019
Nov 20, 2015
Mar 16, 2016
Nov 01, 2016
Dec 29, 2016
Dec 07, 2017
Nov 20, 2018
Mar 15, 2019
Figure 11. Ryanair Share relative to ISEQ Performance Through CSPP. Sources: Investing.com, Börse
Frankfurt.
Table 5. Ryanair Share Price and CSPP Statistics.
February 2017–
June 2016–February
January 2014–May January 2018 (Second
2017 (First Bond
2016 (Pre-CSPP) Bond Added to
Added to CSPP)
CSPP)
Mean €10.29 €13.24 €16.90
Variance 8.514239 1.297385 1.603317
Median €10.23 €13.43 €16.81
Standard Deviation €2.917917 €1.139028 €1.266222
Correlation coefficient
0.956 0.576 −0.068
(with ISEQ Average)
4.2.3. CSPP Spillovers
The findings show that the CSPP may have enacted a market-wide response of increasing
corporate bond prices and compressing corporate spreads across both targeted and non-targeted
bonds. In general, Figure 11 shows that the ISEQ index saw rapid gains after the ECB made the formal
announcement of the CSPP in March 2016, which may suggest spillovers from targeted to non-
targeted bonds in general.
In particular, Figure 12 shows four bonds of similar term structure over the period 2014 to 2018.
These include a 2022 Irish government bond, CSPP targeted 2021 and 2023 Ryanair bonds and an
Irish issued 2022 General Electric bond. The GE bond, though eligible under the ECB’s criteria, was
not chosen for the CSPP programme. However, it shows that the non-targeted GE bond experienced
a similar effect to the targeted Ryanair bonds. The findings show that, as with the PSPP, price action
was far more driven by announcement than the purchases themselves.Economies 2019, 7, 98 16 of 26
109 PSPP Begins: Ryanair Bond Purchase: APP Tapering:
10th March 2015 15th July 2016 Jan 2018
107
105
103
101
99
97
Ryanair 1.875% 2021
Ryanair 1.125% 2023
95
GE 0.8% 2022
Irish gvt 0.8% 2022
93
6/13/2014 6/13/2015 6/13/2016 6/13/2017 6/13/2018
Figure 12. Bond prices for four bonds from 2014–2018. Sources: Irish Stock Exchange, Börse Frankfurt.
In addition, Table 6 shows some descriptive statistics, which correspond to Figure 12. The
correlation coefficient shows that there is a strong correlation of 0.8687 between the General Electric
0.8 2022 bond and the Ryanair 1.875 2021 bond and a 0.7288 correlation coefficient between the
General Electric 0.8 2022 bond and the Ryanair 1.125 2023 bond over the period March 2015 to March
2019. This suggests that further investigation is warranted on spillover effects between targeted and
non-targeted bonds using regression analysis.
Table 6. Descriptive Statistics of Three Sampled Irish CSPP Bonds.
Ryanair 1.875 2021 General Electric 0.8 2023 Ryanair 1.125 2023
Bond Bond Bond
Mean 104.498 100.8711 99.448
Variance 104.885 101.38 100.3
Median 1.875 4.378 24.906
Standard deviation 1.369 2.092 3.881
Correlation
0.8627 0.7288
coefficient
4.3. The APP and its Transmission Channels
This section details the initial findings on portfolio rebalancing in banks and households (Section
4.3.1) and lending behaviour by banks (Section 4.3.2) on the back of the APP.
4.3.1. The APP and Portfolio Rebalancing
Irish Households
The findings show that households have rebalanced their portfolios away from government
bonds and towards deposits initially and then ‘shares and other equity’ after 2015. Figure 13 shows
a notable reduction in households’ holdings of long-term government bonds, which decreased from
€421 million at the APP’s announcement in January 2015, to just €116 million by December 2018.Economies 2019, 7, 98 17 of 26
Figure 14 shows a rapid increase in deposits and simultaneous transactions in ‘shares and other
equity’ after 2015, which subsequently dies off with tapering from Q3 2018.
Figure 13. Irish Household Holdings of Irish Long-Term Government Bonds. Source: Central Bank of
Ireland.
Intial PSPP Phase:
2 Increase in Deposits; then Taper:
Shares/Other Equity January
2018
€ billion
1
0
-1
2014 2014 2015 2015 2016 2016 2017 2017 2018 2018
Q1 Q3 Q1 Q3 Q1 Q3 Q1 Q3 Q1 Q3
Currency and Deposits
Shares and Other Equity
Figure 14. Household Transactions in Financial Assets (Quarterly Moving Average). Source: Central
Bank of Ireland.
Irish Banks
Figure 15 shows the security holdings in Irish banks as a percentage of assets over the period
2014 to 2018. It can be seen that Irish banks held a relatively consistent proportion of Irish government
bonds over the period 2014 to 2018. In addition, holdings from the private sector (often corporate
bonds) consecutively declined, with the CSPP announcement inducing a short upswing between
November 2015 and February 2016. However, banks increased their holdings of MFI securities, which
refer to credit institutions’ money market funds, and other resident financial institutions, over the
period. Holdings of securities from other monetary financial institutions rose from 4.2% at the
beginning of QE, to over 7.5% of total assets held as at January 2019.Economies 2019, 7, 98 18 of 26
11.000%
10.000% MFI Securities
APP CSPP Announced
9.000% Gen Gvt. Securities
Announced 10 March 2016
8.000% Private Sector
7.000%
6.000%
5.000%
4.000%
3.000%
2.000%
1/1/2014
4/1/2014
7/1/2014
10/1/2014
1/1/2015
4/1/2015
7/1/2015
10/1/2015
1/1/2016
4/1/2016
7/1/2016
10/1/2016
1/1/2017
4/1/2017
7/1/2017
10/1/2017
1/1/2018
4/1/2018
7/1/2018
10/1/2018
1/1/2019
Figure 15. Irish Headquartered Banks—Security Holdings as % of Assets. Source: Central Bank of
Ireland (2018).
4.3.2. The APP and Lending Behaviour by Irish Banks
Since the beginning of the APP in March 2015, the findings show that new loan growth to SMEs
has grown in aggregate terms. However, this has been heavily biased towards lending for real-estate
activities (primarily property investment). Figure 16 shows SME new loan issuance by Irish banks
over the period 2014 to June 2018. Prior to the APP, SME real-estate lending made up 11.78% of all
new lending, at €106 million for the month of December 2014. This increased to 25.24%, at €397
million, by the APP’s tapering in December 2017.
1600 January 2018
Tapering
1400
9 March 2015
1200 APP Begins
1000
€ Millions
800
600
400
200
0
Dec-13 Sep-14 Jun-15 Mar-16 Dec-16 Sep-17 Jun-18
Other SME loans Real Estate SME Loans Total New Loans Pre-Real Estate Lending
Figure 16. SME New Loan Issuance by Irish Banks. Source: Central Bank of Ireland.Economies 2019, 7, 98 19 of 26
As shown above, loans to SMEs, excluding real-estate-based lending, increased from €768
million in December 2014 to €849 million in September 2018. Indeed, it can be seen that the divergence
in real-estate lending relative to other SME loans began around the beginning of the APP. Between
March 2013 and March 2015, real estate-based loans bore a correlation coefficient of 0.767 to overall
lending. By comparison, between June 2015 and December 2017, this correlation dropped to 0.559,
marking a notable alteration in SME lending behavior throughout the APP period. Further
investigation is warranted given these initial findings.
5. Discussion
This paper has combined information from multiple sources in an attempt to identify whether
the ECB’s APP in Ireland operated through the portfolio rebalancing channel, the signalling channel
or the lending channel. In particular, it focuses on the PSPP (from March 2015) and the CSPP (from
March 2016), which made up the bulk of the APP. This section discusses four themes that emerged
from the research findings and situates this discussion in the economics literature. It is divided into
four sections. Section 5.1 considers the portfolio rebalancing channel with respect to government and
corporate bonds. Section 5.2 discusses the portfolio rebalancing channel in relation to households and
banks. Section 5.3 discusses the signaling channel. Section 5.4 reflects on the lending channel and
Section 5.5 reflects on the restructuring of Irish debt.
5.1. Portfolio Rebalancing Channel: Government and Corporate Bonds
The economics literature suggests that the PSPP should act to raise the demand for government
bonds directly and corporate bonds indirectly and decrease their yields (Beirne et al. 2011 and Dunne
et al. 2015). In general, the findings show that this did occur in the Irish context and that the price
action occurred due to signaling or announcement effects rather than actual Irish bond purchases by
the Central Bank. The signaling channel will be discussed in greater detail below. In addition, the
literature suggests that the CSPP would act to increase the demand and subsequent price for
corporate bonds and reduce their yields directly (Gern et al. 2015, p. 208). The findings suggest that
this may have been the case in Ireland.
In general, the findings show that the ISEQ saw rapid gains after the ECB formally signaled the
CSPP in March 2016 and made further gains throughout the period of the CSPP, with declines
occurring after the ECB’s formal tapering began in January 2018. Of course, while it is impossible to
detangle the impact of the CSPP on the rising ISEQ index over this period from other supportive
factors such as improved macroeconomic fundamentals, it is, however, likely that the CSPP did,
among other things, improve the performance of the ISEQ over its announcement and
implementation phase.
In particular, the findings suggest that one ECB-targeted company, Ryanair, did experience
higher corporate bond prices. As with PSPP, it can be seen that the announcement of the CSPP in
March 2016 led to immediately higher prices for these corporate bonds and these higher prices
remained elevated with monthly ECB purchases between June 2016 and December 2017, after which,
prices declined in conjunction with the beginning of the ECB tapering. Other factors affecting Ryanair
bond prices such as strikes and cancellations over this period are not controlled for, but it is likely
that, among other things, the CSPP did impact on Ryanair bonds.
The economics literature also suggests that ECB asset purchases had spill-over effects to non-
targeted assets (Altavilla et al. 2015, p. 40; Albertazzi et al. 2018, p. 2; Zaghini 2019). The findings
suggest that this may have also been the case in the Irish context. For example, the findings show that
a non-targeted bond (a 2022 General Electric Bond) increased in line with a targeted bond (a Ryanair
2023 bond) after the announcement of the CSPP in March 2016, with both bond prices remaining
elevated during the corporate bond-buying programme.Economies 2019, 7, 98 20 of 26
5.2. Portfolio Rebalancing in Banks and Households
The literature suggests that the portfolio rebalancing channel operates via incentivising banks to
rebalance their portfolio from government bonds to riskier assets with higher returns like corporate
bonds and loans (Albertazzi et al. 2018, p. 1 and Tischer 2018). However, contrary to expectations,
the findings show that Irish banks actually held a relatively consistent proportion of Irish government
bonds over the period 2014 to 2018. This shows that Irish banks may not have engaged with the
conventional portfolio rebalancing channel cited in the literature or as the ECB initially intended (ECB
2015, pp. 7–8). There may be a few reasons for this.
First, it could be, in part, due to the functioning of Irish banks in the wake of regulatory measures
of the Capital Requirements Directive IV, specifically the enforcement of retaining tier-1 capital, and
consequences of holding risk-weighted assets (RWAs). As noted by Bonner (2016, p. 2), within these
rules, government securities hold a 0% risk weighting, leading to what is termed a ‘regulatory effect’
of choosing to hold these bonds (Andreasen et al. 2015, p. 7). Indeed, the literature suggests that bank
regulation, especially risk-based capital constraints, may weaken the effectiveness of non-standard
monetary operations as banks ensure that they meet their capital requirements (Peek and Rosengren
1993, p. 36; 1995, p. 23; Albertazzi et al. 2016, p. 16 and Christensen and Krogstrup 2018, p. 20). Second,
in an attempt to avoid negative deposit rates on excess reserves induced by the APP, banks may have
managed their level of reserves and in particular, pushed on excess reserves like a ‘hot potato’ to
other banks (Ryan and Whelan 2019, p. 36). In particular, Ryan and Whelan (2019, p. 36) found
evidence that banks may be reducing their reserves by adding to their debt security holdings.
This is connected with a portfolio rebalancing channel that is distinct to that which dominates
the literature. Christensen and Krogstrup (2018, p. 25) identify this as a ‘reserve-induced rebalancing’
channel arising from QE which runs through banks’ portfolio responses to reserves expansions and
is independent of the types of assets purchased. In particular, banks react to the creation of excess
reserves by preserving portfolio optimisation and satisfying balance sheet regulatory procedures.
This reserve-induced rebalancing may also help explain the findings that Irish banks increased
their holdings of MFI securities over the QE period. Ryan and Whelan (2019, p. 36) suggest that
money markets are another possible avenue for banks trying to push reserves off of their balance
sheet, even though they assume that this is not being widely used as a mechanism for reserve
management in euro-area banks. The reasons for this increase in MFI-based securities in Irish banks
warrants further investigation.
The findings also suggest there was evidence of portfolio rebalancing in Irish households. In
particular, the findings show that there was a notable reduction in households’ holdings of long-term
government bonds and an increase in their holdings of shares and other equities during 2015 as they
chased yield as per the portfolio rebalancing channel. It is likely that household’s portfolio holdings
are managed, in the main, by pension and life-assurance funds set up to chase yield across markets.
This is echoed in the literature. For example, Carpenter et al. (2015, p. 230) found that during the
Federal Reserve QE programme, households (including hedge funds) were one of the investor classes
most likely to sell assets to the Federal Reserve.
5.3. The Signalling Channel
In practice, the signalling channel amounts to forward guidance about the future path of
monetary policy (Gern et al. 2015, p. 2), a tool used by the ECB since 2013. The economics literature
suggests that the signalling of asset purchases by central banks can have a large impact on financial
markets in terms of decreased yield and increased prices (Dunne et al. 2015, p. 69; Albertazzi et al.
2018). The findings show that the signaling channel was effective in the Irish context. In terms of the
PSPP, the signaling effect seems to have had a more pronounced impact than the actual purchases
themselves. Irish long-term yields declined sharply during the debate surrounding the PSPP and the
announcement of PSPP in January 2015 and showed no major decline after PSPP purchases actually
began in March 2015. In addition, Irish bond yield spreads between different dated securities
narrowed before PSPP began in March 2015 with very little compression occurring after March 2015.
This corresponds with findings elsewhere in the UK (Haldane et al. 2016, p. 12), the euro areaEconomies 2019, 7, 98 21 of 26
(Altavilla et al. 2015, p. 3; Albertazzi et al. 2018, p. 4 and Neugebauer 2018, p. 22) and Ireland (Larkin
et al. 2019, p. 22). It is worth noting that the findings suggest that prior to the PSPP, there is also
evidence of the signaling effect on 10-year Irish government bond yields in response to the
announcement of the LTRO announcement in December 2012 and the OMT announcement in 2012.
This finding in the Irish context is also supported in the literature (Falagiarda and Reitz 2015, p. 287).
5.4. The Lending Channel
The economics literature suggests that the APP should lead to increased bank lending due to
banks acting as financial intermediaries and lending out a proportion of their increased deposits
arising from APP to households and firms. The findings suggest that there was no marked increase
in loans to SME’s over the period, with the exception of real-estate lending, on the back of the APP.
In particular, this channel may have been relatively weak as Irish banks grappled with high rates of
non-performing loans (NPLs). Donnery et al. (2018, pp. 58–59) argue that although the aggregate
domestic Irish banking system NPL ratio fell from 32 percent in 2013 to below 14 percent at end-2017
and the volume of NPLs on Irish banks’ balance sheets fell from over €80 billion to €30 billion over
the period from 2013 to 2017, NPLs remain one of the primary sources of vulnerability facing the Irish
economy (Donnery et al. 2018, p. 55). In particular, this impaired balance sheet performance can
negatively impact on credit supply 7 (Donnery et al. 2018, p. 57 and Altavilla et al. 2019, p. 3).
Albertazzi et al. (2018, pp. 19–20) also suggests that there was greater portfolio rebalancing by banks
towards real-sector loans in ‘non-vulnerable’ than in ‘vulnerable countries’ like Ireland. This may
have been because in ‘non-vulnerable’ countries, banks choices of higher yielding assets were
diminished due to already compressed spreads pushing them towards real-sector loans (where
spreads remained higher). In addition, bank capital constraints in the wake of the financial crisis
referred to above may have increased the (effective or perceived) constraints of banks’ ability to
expand credit supply (Albertazzi et al. 2016, p. 16). It may also reflect the view that the level of
deposits or reserves in banks are not important in determining bank lending that is expressed in the
literature (Disyatat 2010, p. 2; Fullwiler 2013, p. 186; McLeay et al. 2014, p. 1; Bundesbank 2017, p. 17).
Either way, more work needs to be done on the reasons why Irish banks did not increase lending
substantially on the back of the APP. This reluctance by Irish banks to portfolio rebalance towards
loans in response to central bank asset purchases has important implications for the wider economy
as this channel is essential to ensuring investment and economic growth (Altavilla et al. 2019, p. 3),
The literature also suggests well-capitalised banks are a prerequisite to an effective bank lending
channel arising from unconventional monetary policy (Boeckx et al. 2016, p. 3; Albertazzi et al. 2016,
p. 16 and Bruno et al. 2017, p. 26; Albertazzi et al. 2018, p. 20). The Irish central banks extra capital
requirement, the “countercyclical capital buffer” or CCyB, on Irish banks is to be welcomed in this
regard. The Irish CCyB ensures that banks must hold sufficient capital in relation to the loans they
make and was increased from 0% to 1% from July 2019 (Central Bank of Ireland 2018). While the
CCyB does not restrain lending in good times, it should ensure that Irish banks will be more likely to
increase lending during recessionary periods in the future. In particular, the CCyB safeguards against
cyclical risk by adding to capital requirements during positive phases, in order that credit supply can
be preserved during downturns by corresponding subtractions in capital requirements (Central Bank
of Ireland 2018; Lane 2019). This counter cyclical measure is supported in the literature. For example,
Boeckx et al. (2016, p. 23) argues that banks need to have a sufficient buffer over their minimum
capital requirements to be able to transmit the easier financial conditions of non-conventional
monetary policy to the rest of the economy, especially in times of stress.
5.5. Irish Debt Restructuring
7 It is worth noting that the poor increase in loans to SME’s over the period may also be driven by weak credit
demand in this sector and it is difficult to separate these demand and supply effects in practice.You can also read