Applicability of Geomorphic Index for the Potential Slope Instability in the Three River Region, Eastern Tibetan Plateau

Page created by Leslie Walton
 
CONTINUE READING
Applicability of Geomorphic Index for the Potential Slope Instability in the Three River Region, Eastern Tibetan Plateau
sensors
Communication
Applicability of Geomorphic Index for the Potential Slope
Instability in the Three River Region, Eastern Tibetan Plateau
Feng Liu *, Xin Yao and Lingjing Li

                                           Institute of Geomechanics, Chinese Academy of Geological Sciences, Beijing 100081, China;
                                           Yaox@cags.ac.cn (X.Y.); Lilj@cags.ac.cn (L.L.)
                                           * Correspondence: liuf@cags.ac.cn

                                           Abstract: Geomorphic indices (e.g., the normalized channel steepness index (Ksn) and the stream
                                           length-gradient index (SL)) highlight changes in fluvial shapes and gradients. However, the applica-
                                           tion of these indices was seldom used to identify potential landslide zones. In this study, we used the
                                           Ksn and SL indices to detect the significant variations in the stream power along river reaches, which
                                           are anomalies associated with landslides, in the Zengqu River watershed, the upper reaches of the
                                           Jinsha River. Most of the landslide anomalies originate along the trunk and surrounding tributaries
                                           below the knickpoint of the mainstream. This suggests an erosional wave is migrating upstream
                                           throughout the drainage area. The fluvial incision may generate over-steepened hillslopes, which
                                           could fail in the future. In addition, the divide asymmetry index (DAI) predicts the direction of
                                           the divide as the headwaters migrate toward lower relief, higher elevation surfaces. Landslides
                                           are expected to occur as the unstable divide migrates. The proposed methodology can benefit the
                                           detection and characterization of potential landslide zones. It should improve hazard and risk
                                 analysis and the identification of drainage network areas associated with landslides.
         

Citation: Liu, F.; Yao, X.; Li, L.         Keywords: geomorphic indices; potential landslide zone; DEM; Jinsha River
Applicability of Geomorphic Index
for the Potential Slope Instability in
the Three River Region, Eastern
Tibetan Plateau. Sensors 2021, 21, 6505.   1. Introduction
https://doi.org/10.3390/s21196505
                                                Landslides are highly stochastic geomorphological processes that shape the Earth’s
Academic Editor: Fernando
                                           landscapes [1,2], causing economic and life losses due to widespread spatial distribution [3].
José Aguilar
                                           The landslide hazard mitigation cannot do without the identification of the conditioning
                                           factors [4]. The use of optical remote sensing imaging for landslide detection is mainly
Received: 2 August 2021                    based on various markers associated with the surface morphological features of the affected
Accepted: 6 September 2021                 area [5–7]. However, it only provides synoptic information about the post-failure defor-
Published: 29 September 2021               mation surface features and lacks information about the previous deformation state [8].
                                           The InSAR technique complements the abovementioned limitation of the landslide detec-
Publisher’s Note: MDPI stays neutral       tion based on optical imagery [9,10]. Regardless of the type of remote sensing method,
with regard to jurisdictional claims in    understanding the lithology, tectonics, topography, and climate is a fundamental prereq-
published maps and institutional affil-    uisite for landslide detection. Indeed, the interactions between tectonics, erosion, and
iations.                                   climate change are a basic tenet of the tectonic geomorphology [11]. The surface processes
                                           associated with landslides can be investigated based on the river incision and drainage
                                           basin morphology in highly incised and rugged terrain. However, the method of studying
                                           the tectonic geomorphology has seldom been used to identify regions where landslides
Copyright: © 2021 by the authors.          may occur along the valley sides of stream channels and watershed divide. For example,
Licensee MDPI, Basel, Switzerland.         the anomalous values of the stream length-gradient (SL) index were used to analyze the
This article is an open access article     change in the gradient along a channel affected by landslides [12–15]. However, they did
distributed under the terms and            not assess the potential regions that may be prone to landslides. Here, we focused on the
conditions of the Creative Commons         Zengqu River, which is a tributary of the upper part of the Jinsha River. The region where
Attribution (CC BY) license (https://      landslides may occur was predicted via the geomorphic index method. This study aimed
creativecommons.org/licenses/by/           to provide a means of diagnosing potential hillslope failure on the valley side and drainage
4.0/).

Sensors 2021, 21, 6505. https://doi.org/10.3390/s21196505                                                     https://www.mdpi.com/journal/sensors
Applicability of Geomorphic Index for the Potential Slope Instability in the Three River Region, Eastern Tibetan Plateau
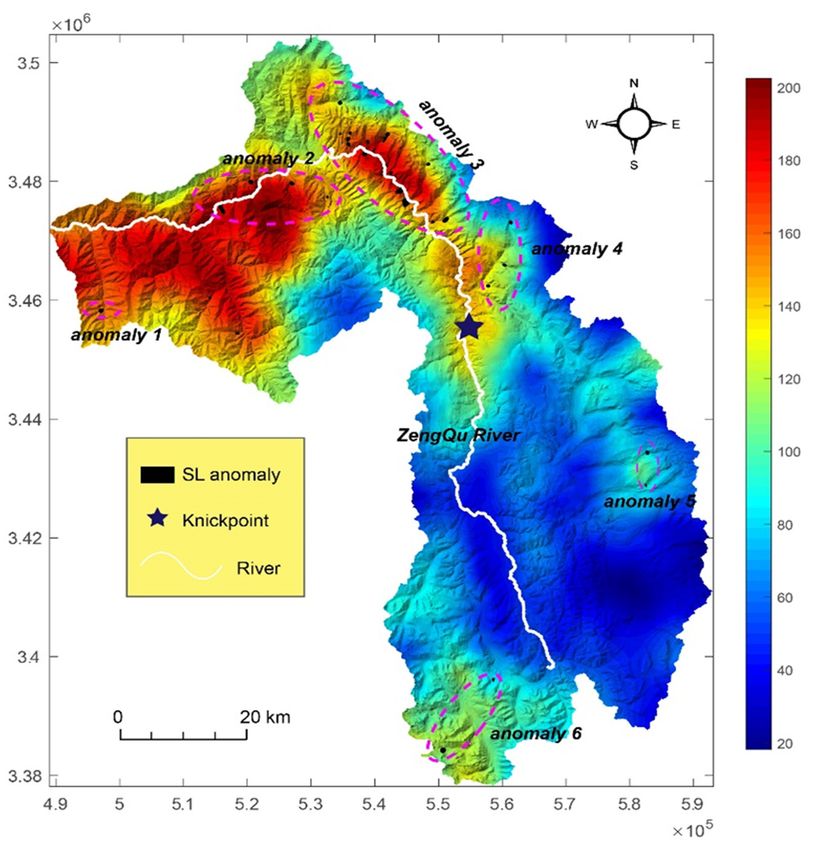
Sensors 2021, 21, x FOR PEER REVIEW                                                                                                           2 of 12

  Sensors 2021, 21, 6505                                                                                                                   2 of 11
                                   to provide a means of diagnosing potential hillslope failure on the valley side and drain-
                                   age divide. The results of this study provide a possible hillslope deformation target for
                                   early landslide identification.
                                    divide. The results of this study provide a possible hillslope deformation target for early
                                    landslide identification.
                                   2. Study Area
                                    2. Study Area Rivers Region (TRR) is located on the southeastern margin of the Tibetan
                                        The Three
                                   PlateauThe (Figure
                                                 Three 1a).
                                                        RiversTheRegion
                                                                   morphology
                                                                           (TRR) isoflocated
                                                                                        the TRR on is characterized
                                                                                                    the southeasternby      the elongate,
                                                                                                                         margin              roughly
                                                                                                                                  of the Tibetan
                                     Plateaudrainages
                                   parallel     (Figure 1a).ofThe
                                                                the morphology      of the TRR
                                                                    Nu River, Lancang             is characterized
                                                                                              River,                  by the The
                                                                                                       and Jinsha River.      elongate,  roughly
                                                                                                                                   tectonic   activity
                                     parallel  drainages  of   the Nu   River,  Lancang    River,  and  Jinsha   River. The
                                   in the TRR has mainly been characterized by strike-slip motion in the north and transten- tectonic  activity  in
                                     the TRR    has mainly   been   characterized    by  strike-slip  motion   in the north  and
                                   sional stress in the south during the Quaternary [16–18]. The most active, fault in the TRR    transtensional
                                   isstress  in theFault
                                      the Ganzi      south   duringa the
                                                         system,            Quaternary
                                                                       left-slip strike-slip[16–18].
                                                                                               systemThe     most
                                                                                                         in the     active, Jinsha
                                                                                                                 northern   fault inwatershed
                                                                                                                                      the TRR is[19].
                                   In addition, the active structures in the TRR also include a series of normal faults[19].
                                     the Ganzi    Fault system,    a left-slip strike-slip   system   in  the northern   Jinsha  watershed      in the
                                     In addition, the active structures in the TRR also include a series of normal faults in the
                                   upper    Jinsha River and Nu River watersheds [19]. The rocks are mainly sedimentary in
                                     upper Jinsha River and Nu River watersheds [19]. The rocks are mainly sedimentary in the
                                   the upper watersheds, and a mixture of sedimentary and deeply exhumed metamorphic
                                     upper watersheds, and a mixture of sedimentary and deeply exhumed metamorphic rocks
                                   rocks are exposed in the lower watersheds in the TRR [20]. The significant geomorpho-
                                     are exposed in the lower watersheds in the TRR [20]. The significant geomorphological
                                   logical
                                     featurefeature   is pervasive
                                               is pervasive             lowhigh-elevation
                                                              low relief,     relief, high-elevation
                                                                                               topography, topography,     which is by
                                                                                                                which is separated     separated
                                                                                                                                          incised by
                                   incised
                                     canyons  canyons   with
                                                 with high       highin
                                                             reliefs   reliefs in SE
                                                                         SE Tibet      Tibet [21–23].
                                                                                     [21–23].   In the TRR,In the
                                                                                                                theTRR,   the low
                                                                                                                    low relief,     relief, high-ele-
                                                                                                                                 high-elevation
                                   vation   surfaces   are   perched    patches    in the  upper    reaches    (Figure
                                     surfaces are perched patches in the upper reaches (Figure 1a), while these surfaces1a),  while  these surfaces
                                                                                                                                             have
                                   have   been    completely     eroded    away   in  the  lower
                                     been completely eroded away in the lower watersheds [20].      watersheds     [20].

       Figure
     Figure  1. 1. Topographicand
                Topographic    andfluvial
                                   fluvialcharacterization
                                           characterization of
                                                            of the
                                                               the Three
                                                                   ThreeRivers
                                                                          RiversRegion
                                                                                  Region(TRR)
                                                                                         (TRR)(After
                                                                                                (AfterYang
                                                                                                       Yanget et
                                                                                                              al.,al.,
                                                                                                                   2015)  (a) (a)
                                                                                                                       2015)  andand
                                                                                                                                   the the
       Zengqu    River watershed (b). Abbreviations  for some  major faults: GZF: Ganzi fault; NJF: Nu Jiang fault;  RRF:
     Zengqu River watershed (b). Abbreviations for some major faults: GZF: Ganzi fault; NJF: Nu Jiang fault; RRF: Red RiverRed   River
       fault;
     fault;   XSHF:
            XSHF:    Xianshuihefault.
                    Xianshuihe  fault.
                                           The Zengqu River is a tributary of the upstream part of the Jinsha River (Figure 1b).
                                          The across
                                     It flows  Zengqu     River is
                                                       different     a tributary of the upstream
                                                                  tectono-stratigraphic    units and part
                                                                                                       faultsof(Figure
                                                                                                                 the Jinsha  River
                                                                                                                        2a). The        (Figure 1b).
                                                                                                                                    lithological
                                   Itboundary
                                      flows across
                                                 and different
                                                       faults do tectono-stratigraphic
                                                                   not result in significantunits
                                                                                              slopeand   faults
                                                                                                     breaks       (Figure
                                                                                                             in the        2a). Theprofile
                                                                                                                      longitudinal       lithological
                                                                                                                                                 of
                                   boundary
                                     the Zengqu and   faults
                                                   River.  Thedolongitudinal
                                                                   not result in  significant
                                                                               profile         slope
                                                                                       indicates   thatbreaks   in theRiver
                                                                                                        the Zengqu      longitudinal        profile of
                                                                                                                             is in a transient
                                   the   Zengqu
                                     state with aRiver.    The longitudinal
                                                    knickpoint    (Figure 2b). profile   indicates
                                                                                Consequently,     thethat the Zengqu
                                                                                                       channel            Riverincised
                                                                                                                  is a deeply     is in a valley
                                                                                                                                            transient
                                     below   the  knickpoint.    In  contrast, the  headwater
                                   state with a knickpoint (Figure 2b). Consequently,            of the  Zengqu     River  has  a  lower
                                                                                                         channel is a deeply incised         relief.
                                                                                                                                                valley
                                     However,
                                   below         the precipitation
                                            the knickpoint.           does notthe
                                                                In contrast,    exhibit  a significant
                                                                                    headwater     of thespatial
                                                                                                          Zengqu  gradient
                                                                                                                      Riverinhas
                                                                                                                               theawatershed
                                                                                                                                       lower relief.
                                     due to thethe
                                   However,       topographic
                                                     precipitationeffects (Figure
                                                                       does        3).
                                                                             not exhibit  a significant spatial gradient in the watershed
                                   due to the topographic effects (Figure 3).
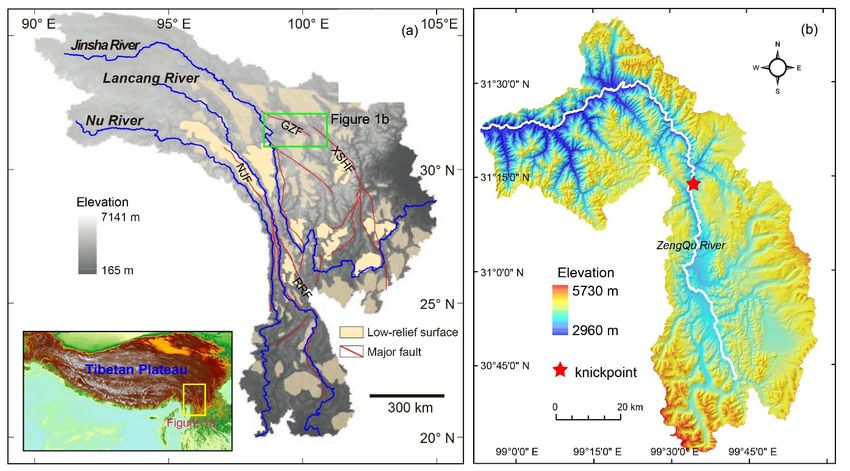
Applicability of Geomorphic Index for the Potential Slope Instability in the Three River Region, Eastern Tibetan Plateau
Sensors2021,
Sensors        21,x6505
         2021,21,   FOR PEER REVIEW                                                                                                            33ofof1112
 Sensors 2021, 21, x FOR PEER REVIEW                                                                                                          3 of 12

                                  Figure 2. Simplified
                                 Figure                    geological
                                                            geologicalmap   (after  1:500,000  Chinese   geological  map)map)
                                                                                                                           (a,b) reconstructed   river
                                  Figure 2.2. Simplified
                                              Simplified geological      map
                                                                         map    (after
                                                                                (after  1:500,000
                                                                                       1:500,000    Chinese
                                                                                                   Chinese     geological
                                                                                                              geological          (a,b)reconstructed
                                                                                                                          map) (a,b)    reconstructed
                                  long
                                 river  profile
                                       long     of the
                                              profile oftrunk
                                                          the  stream
                                                              trunk     of
                                                                     streamthe  Zengqu
                                                                               of the     river
                                                                                       Zengqu   extracted
                                                                                                 river      from
                                                                                                        extracted the 30-m-resolution
                                                                                                                   from  the             SRTM-DEM
                                                                                                                             30-m-resolution
                                  river long profile of the trunk stream of the Zengqu river extracted from the 30-m-resolution SRTM-           SRTM-
                                 DEM
                                  DEM    (derived
                                  (derived
                                         (derived  from    https://earthexplorer.usgs.gov/,
                                             from https://earthexplorer.usgs.gov/,
                                                    from https://earthexplorer.usgs.gov/,          accessed
                                                                                              accessed   on on
                                                                                                  accessed    onOctober
                                                                                                             20   20October
                                                                                                                 20  October  2020)
                                                                                                                          2020)  (red
                                                                                                                             2020)    (red dotted
                                                                                                                                       dotted
                                                                                                                                    (red       line
                                                                                                                                          dotted    line
                                                                                                                                                     is
                                                                                                                                                  line
                                 is paleo-river
                                  paleo-river
                                  is paleo-river  profile
                                                profile and and black
                                                              black    line
                                                                    line is  is  modern
                                                                            modern         river
                                                                                       river     profile)
                                                                                              profile).
                                                                       line is modern river profile)

                                  Figure 3. Swath  profiles
                                              Swathprofiles
                                                     profiles across thethe
                                                                across    Zengqu  River.
                                                                             Zengqu      Upper
                                                                                      River.    plot: location
                                                                                             (Upper              of swathoftopographic profiles.
                                 Figure 3.3.Swath             across  the Zengqu   River. Upper  plot: plot):
                                                                                                       locationlocation      swath topographic
                                                                                                                  of swath topographic   profiles.
                                  Lower   plot:
                                  profiles.     the plot):
                                            (Lower  black the
                                                            lines  are lines
                                                                black   maximum,
                                                                             are    mean, and
                                                                                 maximum,       minimum
                                                                                             mean, and        elevations
                                                                                                         minimum           along along
                                                                                                                      elevations a 10-km   wide
                                                                                                                                        a 10-km
                                 Lower plot: the black lines are maximum, mean, and minimum elevations along a 10-km                         wide
                                  swath
                                  wide   from top
                                        swath      to top
                                                from  bottom,
                                                           to   respectively.
                                                               bottom,         Mean annual
                                                                         respectively.  Mean averaged
                                                                                              annual     precipitation
                                                                                                       averaged          within basins
                                                                                                                   precipitation       (derived
                                                                                                                                  within  basins
                                 swath from top to bottom, respectively.        Mean   annual averaged    precipitation   within basins  (derived
                                  from  TRMM
                                  (derived       data)
                                            fromdata)
                                                  TRMM in mm
                                                           data)
                                                                  −1 colored by mean channel steepness.
                                                                yrin mm yr−by 1 colored by mean channel steepness.
                                 from  TRMM            in mm    yr−1 colored     mean channel steepness.
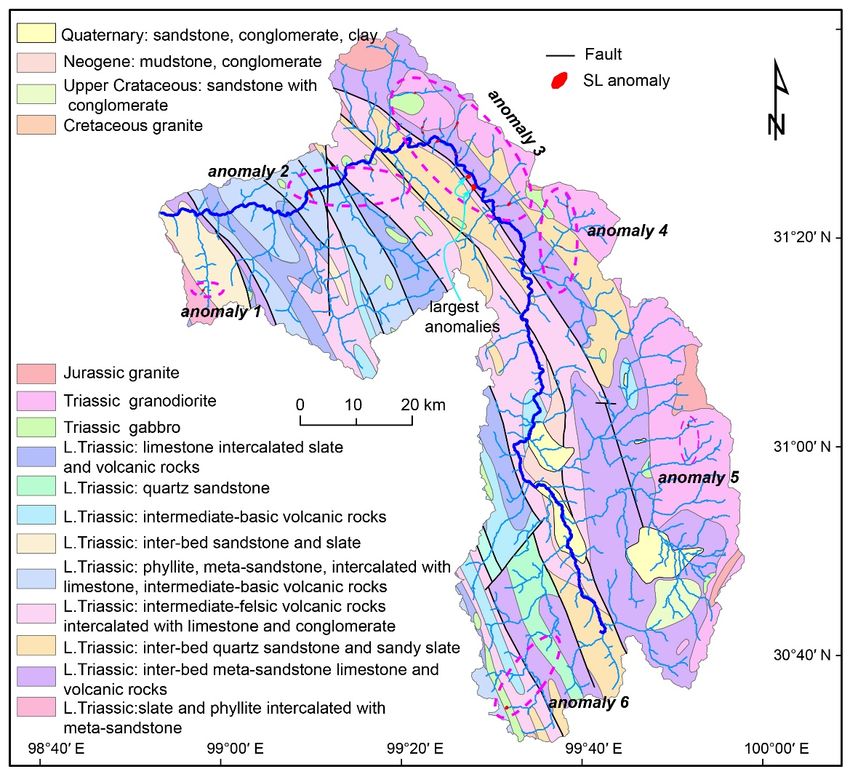
Applicability of Geomorphic Index for the Potential Slope Instability in the Three River Region, Eastern Tibetan Plateau
Sensors2021,
Sensors  2021,21,
               21,6505
                   x FOR PEER REVIEW                                                                                                          44 of
                                                                                                                                                 of 11
                                                                                                                                                     12

                                 3.3.Materials
                                     Materialsand  andMethods
                                                         Methods
                                        Theevolution
                                       The     evolutionofofthe the  topography
                                                                  topography         is coupled
                                                                                  is coupled       to the
                                                                                               to the      changes
                                                                                                       changes        inriver
                                                                                                                 in the  the river
                                                                                                                               channelchannel
                                                                                                                                          networknet-
                                  work    in the  TRR    [24].  The    normalized     channel   steepness     index  (Ksn),
                                 in the TRR [24]. The normalized channel steepness index (Ksn), which is the slope of the     which    is the  slope
                                  of the channel
                                 channel    normalized normalized        by thearea
                                                            by the drainage       drainage
                                                                                      [25,26],area
                                                                                                was [25,26],
                                                                                                     used to mapwas the
                                                                                                                     used    to map
                                                                                                                         spatial        the spatial
                                                                                                                                  changes    in the
                                  changes     in the  fluvial   incision    capacity   along  the   Zengqu     River  (Figure
                                 fluvial incision capacity along the Zengqu River (Figure 4a). Because it is highly sensitive   4a).  Because    it is
                                  highly    sensitive   to  changes     in the  channel   gradient    and  can   highlight
                                 to changes in the channel gradient and can highlight the significant perturbations along a  the  significant   per-
                                  turbations
                                 river  [13], thealong   a river
                                                    SL index       [13],
                                                                 was      thetoSL
                                                                       used        indexthe
                                                                                 detect   was    used to
                                                                                             features   of detect   the features
                                                                                                            the surface   processes of associated
                                                                                                                                        the surface
                                 with landslides in this study (Figure 4b). We assessed the relationship between therelation-
                                  processes     associated    with    landslides    in this study    (Figure   4b).  We   assessed    the   fluvial
                                  ship between
                                 incision   and thethe   fluvial incision
                                                      abnormal                 and the abnormal
                                                                    channel gradient     based on the channel    gradient
                                                                                                         transient          based
                                                                                                                     state of       on the transi-
                                                                                                                              the Zengqu      River.
                                  ent
                                 In    state
                                     the      of the Zengqu
                                         headwater      region, River.     In the
                                                                  the divide       headwaterindex
                                                                                 asymmetry       region,wasthe  divide
                                                                                                             used        asymmetry
                                                                                                                    to determine         index the
                                                                                                                                     whether     was
                                 divide was stable and to predict the possible direction of the divide (Figure 4c). All indicesof
                                  used   to  determine      whether     the  divide   was  stable   and  to  predict  the  possible    direction
                                  the be
                                 can   divide   (Figureby
                                           calculated      4c).
                                                             theAll  indices
                                                                  digital      can be calculated
                                                                             elevation   model (DEM).by theWe digital
                                                                                                                 usedelevation
                                                                                                                       the SRTMmodel  DEM(DEM).
                                                                                                                                             (30 m
                                  We used the
                                 resolution,       SRTMfrom
                                                derived      DEM     (30 m resolution, derived from accessed
                                                                  https://earthexplorer.usgs.gov/,           https://earthexplorer.usgs.gov/,
                                                                                                                        on 20 October 2020) to
                                  accessedthe
                                 calculate     on geomorphic
                                                  20 October 2020)        to calculate
                                                                   indices.   Based on the   geomorphic
                                                                                         these  results, theindices.
                                                                                                               regions Based
                                                                                                                        whereon      these results,
                                                                                                                                 landslides    may
                                  the  regions    where
                                 occur were identified.    landslides     may   occur  were   identified.

                                  Figure4.4.Cartoon
                                 Figure      Cartoon plot
                                                       plot show
                                                            show the
                                                                  the methods
                                                                       methods adopted    in this
                                                                                 adopted in  this study
                                                                                                  study onon basis
                                                                                                              basisof
                                                                                                                    ofbasin
                                                                                                                       basinscale
                                                                                                                             scale(after
                                                                                                                                   (after[25]).
                                                                                                                                          [25]).
                                 (a) The  parameter    X   provides  a  prediction of  divide  motion;    (b)  The Ksn   index derived
                                  (a) The parameter Χ provides a prediction of divide motion; (b) The Ksn index derived from EQ.1         from
                                 Equation   (1) indicate
                                  indicate fluvial       fluvial
                                                    incision andincision  and with
                                                                  associated  associated with
                                                                                   erosion     erosion
                                                                                            rates;      rates;
                                                                                                   (c) The  SL(c) The (EQ.2)
                                                                                                                index SL index  (Equation (2))
                                                                                                                             highlights
                                  anomalous
                                 highlights    changes inchanges
                                             anomalous      river gradients.
                                                                    in river gradients.

                                 3.1.
                                  3.1.Channel
                                       ChannelSteepness
                                                   SteepnessIndex
                                                              Index
                                       The
                                        The fluvial profilesand
                                             fluvial   profiles  andthe
                                                                      thechannel
                                                                          channelsteepness
                                                                                     steepnessindex
                                                                                                  indexare
                                                                                                        arevaluable
                                                                                                            valuabletools
                                                                                                                       toolsfor
                                                                                                                             forevaluating
                                                                                                                                 evaluating
                                 river
                                  river incision in response to tectonics, climate, and rock properties [27–30]. Understeady-
                                        incision    in response   to tectonics,  climate,   and  rock properties   [27–30]. Under    steady-
                                 state
                                  state or
                                         or dynamic      equilibriumconditions,
                                            dynamic equilibrium         conditions,underunderwhich
                                                                                                which  uplift
                                                                                                     uplift andand   erosion
                                                                                                                 erosion  are are spatially
                                                                                                                              spatially  uni-
                                 uniform,    bedrock
                                  form, bedrock          channels
                                                       channels     exhibita apower
                                                                 exhibit       powerlaw lawrelationship
                                                                                             relationship between
                                                                                                          between thethe channel
                                                                                                                         channel slope
                                                                                                                                   slope (S)
                                                                                                                                           (S)
                                 and the drainage area (A) [31,32]:
                                  and the drainage area (A) [31,32]:
                                                                                  S = Ks A−θ                                             (1)
                                                                                      S = Ks A−θ                                           (1)
                                 where Ks is the channel steepness index, and θ is the channel concavity index.
                                  whereTheKsabove-mentioned
                                               is the channel steepness
                                                                     power-lawindex,  and θ isisthe
                                                                                   function         channel
                                                                                                 only        concavity
                                                                                                      valid for          index.
                                                                                                                  drainage  areas above a
                                        The
                                 critical     above-mentioned
                                          threshold                  power-law
                                                        [33]. Generally,            functiondrainage
                                                                           the minimum         is only valid
                                                                                                       area isfor  drainage areas
                                                                                                                determined          above
                                                                                                                             by setting   ana
                                  critical
                                 area            2
                                       of 1threshold
                                            km when[33].       Generally,
                                                          identifying   the the  minimum
                                                                            channel           drainage
                                                                                       initiation pointsarea
                                                                                                         that is determined
                                                                                                              separate        by setting
                                                                                                                        the channels   froman
Applicability of Geomorphic Index for the Potential Slope Instability in the Three River Region, Eastern Tibetan Plateau
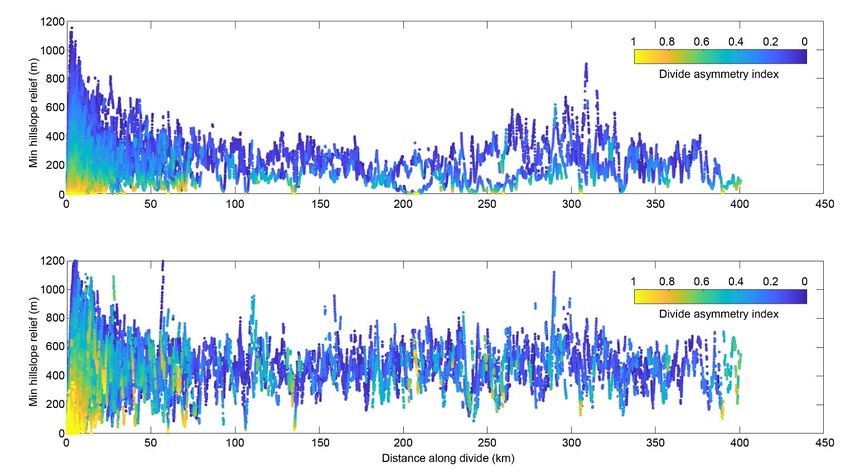
Sensors 2021, 21, 6505                                                                                           5 of 11

                         the hillslopes [34]. The normalized steepness index (Ksn) allows the comparison of the
                         steepness of channels in different drainage areas [29,34]. In addition, the Ksn values exhibit
                         a meaningful correlation with the catchment-mean erosion rates determined from the
                         concentrations of cosmogenic nuclides in river sediments [29,35,36]. Recently, the Caucasus
                         case study revealed that the relative variations in the erosion rate could be inferred by
                         combining the mean catchment normal channel steepness and the hillslope angle without
                         the mean catchment erosion rate [37].
                               The uncertainties of the elevation data and the derived slope data may lead to unre-
                         liable channel steepness index results using the slope-area method [38]. X was proposed
                         as a proxy map of the dynamic evolution of river networks with steady-state river ge-
                         ometry [38]. Under steady state conditions between uplift and erosion, the relationship
                         between the channel elevation and X is expected to be linear, with a slope equal to the
                         channel steepness [39]. Landslides can cause drainage divide migration [40], and erosion
                         rates are balanced across divides in tectonically active landscapes [41,42]. However, the
                         interpretation of χ-anomalies across a divide requires some caution due to the assumption
                         of uniform uplift, rock erodibility, and climatic conditions, which may not occur in natural
                         systems [39]. Previous studies have shown that χ-anomalies can occur even when a divide
                         is immobile [27,43]. As an alternative metric of divide stability, Gilbert’s metrics, which
                         includes the channel elevation, mean upstream gradient, mean upstream relief, and X,
                         was proposed [41]. However, given the manual selection of divides and the across-divide
                         comparisons in these studies, unwanted subjectivity was inevitably introduced [44]. Con-
                         sequently, the divide asymmetry index (DAI) was proposed for the topographic analysis
                         of divide migration [44]. The DAI is defined as the absolute value of the across-divide
                         difference in the hillslope relief (∆HR) normalized by the across-divide sum of the hillslope
                         relief (ΣHR) [44]. The DAI ranges from 0 to 1, i.e., from entirely symmetric to mostly
                         asymmetric, respectively. Thus, we used the DAI to identify the unstable divides in this
                         study. Following the method described by Scherler and Schwanghart (2020), the DAI
                         calculations in this study were conducted in TopoToolbox v2 [45].

                         3.2. SL Index
                              The SL index is another important geomorphic proxy that quantifies the stream
                         profile’s steepness [44]. It is calculated using the following equation at the reach scale:

                                                              SL = (∆H/∆L)∗L,                                       (2)

                         where L is the stream length measured from the headwaters to the reach midpoint,
                         and ∆H/∆L is the local stream gradient. The SL index is typically used to determine
                         the gradient changes along the stream’s longitudinal profile associated with tectonic uplift,
                         rock type, and/or surface processes [46–48]. However, the interpretation of the traditional
                         SL index values is limited by the subjective choice of thresholds for defining the anomalous
                         values along the channel profile [13,14]. Recently, hotspot and cluster analysis of the SL
                         index (SL-HCA) was proposed to improve the visualization of the anomalous values in
                         the identification of tectonic structures and large landslides [14]. The SLix toolbox can be
                         used to obtain the SL index map via the SL-HCA method [48]. Indeed, the SL anomaly
                         zones are associated with rapid changes in the channel gradient (e.g., knickpoint) along the
                         longitudinal profile. For bedrock or mixed bedrock-alluvial channels, interactions between
                         the changes in the bedrock lithology, tectonic structures, and mass movements and the
                         streambed are the potential geological and geomorphological triggers of the anomalous SL
                         values [14].

                         4. Results
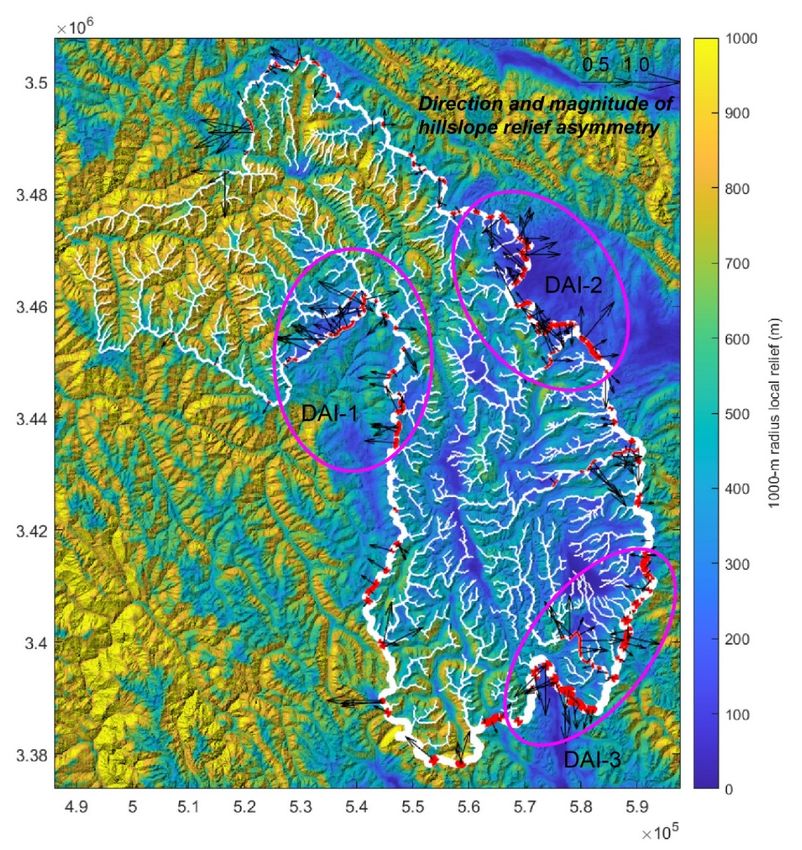
                              The SL-HCA anomaly map presents the distribution of the kernel density values of
                         the SL index. Based on the threshold value equal to 1σ from the mean kernel density
                         values of the SL index [14], the SL index anomaly map of the Zengqu River was produced
                         (Figure 5). Based on this classification, we identified 30 SL-HCA anomalies in the study
Applicability of Geomorphic Index for the Potential Slope Instability in the Three River Region, Eastern Tibetan Plateau
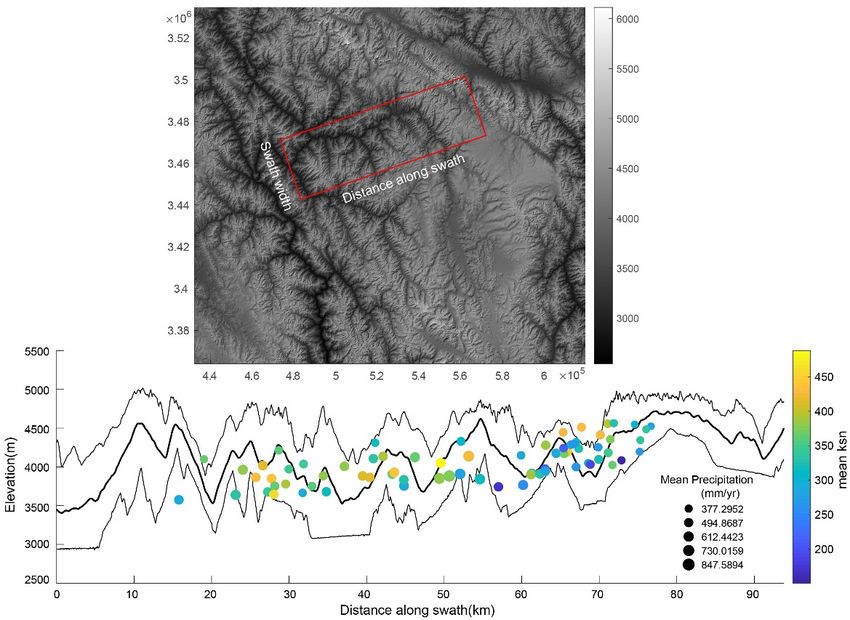
Sensors 2021, 21, x FOR PEER REVIEW                                                                                                          6 of 12
Sensors 2021, 21, 6505                                                                                                                        6 of 11

                                 (Figure 5). Based on this classification, we identified 30 SL-HCA anomalies in the study
                                 area.
                                  area. The
                                        The anomalies
                                             anomalies were
                                                          were mainly
                                                                mainly concentrated
                                                                        concentrated in
                                                                                      in the
                                                                                         the tributary
                                                                                             tributary below
                                                                                                       below the
                                                                                                             the knickpoint
                                                                                                                 knickpoint in
                                                                                                                            in
                                 the
                                  the Zengqu
                                      Zengqu River
                                                River and
                                                       and the
                                                            the two
                                                                two largest
                                                                     largest anomalies
                                                                             anomalies were located along the mainstream in
                                 anomaly
                                  anomaly region
                                            region 33 (Figure
                                                      (Figure 5).
                                                               5). The
                                                                   The anomalies
                                                                       anomalies were
                                                                                 were located
                                                                                        located at the boundaries between
                                                                                                                  between the
                                 lithological
                                  lithological units
                                               units in
                                                     in regions
                                                        regions 1 and 6 (Figure 5).

                                 Figure 5.
                                 Figure     SL index
                                         5. SL  index anomalies
                                                      anomalies and
                                                                and the
                                                                    the catchment
                                                                        catchment geology.
                                                                                  geology. The
                                                                                           The ellipses
                                                                                               ellipses with
                                                                                                        with magenta
                                                                                                             magenta dashed
                                                                                                                     dashed line is
                                 significant
                                 significant SL
                                             SL index
                                                 index anomalous.
                                                       anomalous.

                                        The regional
                                        The   regional distribution
                                                         distribution of   of the
                                                                              the Ksn
                                                                                    Ksn values was highly variable (Figure 6). The mean
                                  Ksn value
                                 Ksn    valuevaried
                                                variedfrom
                                                         from20          200mm0.90.9
                                                                 20toto200            . The
                                                                                   . The     high
                                                                                          high   KsnKsn  values
                                                                                                       values     were
                                                                                                                were       predominantly
                                                                                                                        predominantly         located
                                                                                                                                           located  in
                                  in the
                                 the      northern
                                       northern    partpart
                                                         of of
                                                             thethe   study
                                                                   study       areaalong
                                                                            area       alongthe
                                                                                              thetrunk
                                                                                                   trunkofofthe
                                                                                                              theZengqu
                                                                                                                  ZengquRiver.River. The
                                                                                                                                      The strongest
                                                                                                                                            strongest
                                  incision of
                                 incision    of the
                                                the rivers
                                                     rivers occurs
                                                            occurs in  in the
                                                                           the lower
                                                                                lower andand middle
                                                                                              middle reaches
                                                                                                        reaches ofof the
                                                                                                                      the river,
                                                                                                                           river, which
                                                                                                                                  which isis outlined
                                                                                                                                             outlined
                                  by  the spatial   distribution     of
                                 by the spatial distribution of the Ksn.the   Ksn.
                                        Figure 66 shows
                                        Figure      shows howhow thethe DAI
                                                                          DAI varied
                                                                                  varied with
                                                                                           with distance
                                                                                                   distance along
                                                                                                             along the the divide
                                                                                                                            divide network
                                                                                                                                     network of of the
                                                                                                                                                   the
                                  Zengqu     River  catchment.      Some     notable     deviations    occurred   at  divide
                                 Zengqu River catchment. Some notable deviations occurred at divide distances of ~30–45,       distances   of ~30–45,
                                 ~140, ~200–260,
                                 ~140,   ~200–260, and and ~380–400
                                                            ~380–400km,   km,and andwerewere typically
                                                                                              typically associated
                                                                                                          associated withwith asymmetric
                                                                                                                               asymmetric divides
                                                                                                                                              divides
                                 (Figure 7).
                                 (Figure    7). The
                                                 The most
                                                       most significant
                                                              significant deviations
                                                                               deviations from from the
                                                                                                      the average
                                                                                                           average values
                                                                                                                      values occurred
                                                                                                                                occurred at at divide
                                                                                                                                               divide
                                  distance    of  ~0–25   km.    These      potential     migrated     divides   can
                                 distance of ~0–25 km. These potential migrated divides can be seen in the catchment    be seen   in the  catchment
                                  boundary regions
                                 boundary       regions with
                                                          with significant
                                                                  significant locallocal relief
                                                                                          relief (Figure
                                                                                                  (Figure 8),
                                                                                                            8), and
                                                                                                                and many
                                                                                                                       many clustered
                                                                                                                               clustered along
                                                                                                                                            along the
                                                                                                                                                   the
                                  eastern   and   western   edges    of  the  catchment.      The   predicted   migration
                                 eastern and western edges of the catchment. The predicted migration direction is shown       direction  is shown   in
                                  Figure   8 based    on the  orientations       of  the  divide   segments    and  their
                                 in Figure 8 based on the orientations of the divide segments and their mean DAI magni-     mean    DAI  magnitude.
                                  Consequently, most of the divide migration would result in area loss of the Zengqu River
                                 tude. Consequently, most of the divide migration would result in area loss of the Zengqu
                                  catchment from higher to lower relief.
                                 River catchment from higher to lower relief.
Applicability of Geomorphic Index for the Potential Slope Instability in the Three River Region, Eastern Tibetan Plateau
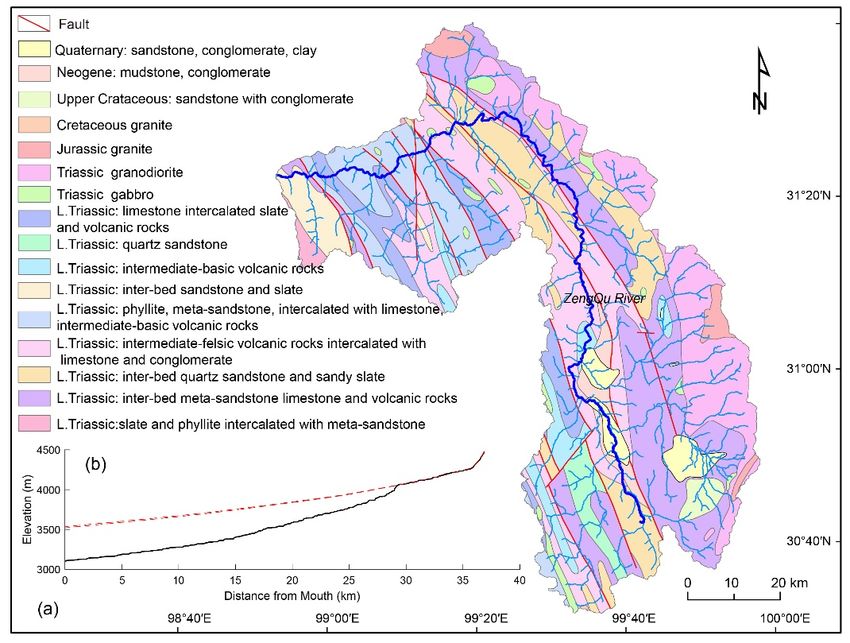
Sensors 2021, 21, x FOR PEER REVIEW                                                                                             7 of 12
 Sensors  2021,21,
  Sensors2021,  21,6505
                    x FOR PEER REVIEW                                                                                             77 of
                                                                                                                                     of 11
                                                                                                                                        12

                                 Figure 6. SL index anomalies and the spatial distribution of Ksn. The ellipses with magenta dashed
                                   Figure
                                   Figure
                                 line       6. SL index
                                            6.       SLanomalies
                                                  index
                                      is significant    anomalies  and
                                                                    and the
                                                                        the spatial
                                                         index anomalous.   spatial distribution
                                                                                    distribution of
                                                                                                 of Ksn.
                                                                                                    Ksn. The
                                                                                                         The ellipses
                                                                                                             ellipses with
                                                                                                                      with magenta
                                                                                                                           magenta dashed
                                                                                                                                   dashed
                                   line
                                   line is
                                        is significant
                                           significant SL
                                                       SL index
                                                           index anomalous.
                                                                 anomalous.

      Figure 7. Minimum flow distance
                             Figure 7.along  the divide
                                       Minimum           networkalong
                                                  flow distance   of the Zengqu
                                                                       the divide River catchment.
                                                                                  network            ColorsRiver
                                                                                           of the Zengqu    denote  the divide
                                                                                                                 catchment. Colors
      asymmetry index (DAI). denote
                              Figurethe
                                      7. Minimum    flow distance along
                                         divide asymmetry index (DAI).   the divide network  of the Zengqu  River catchment. Colors
                                   denote the divide asymmetry index (DAI).
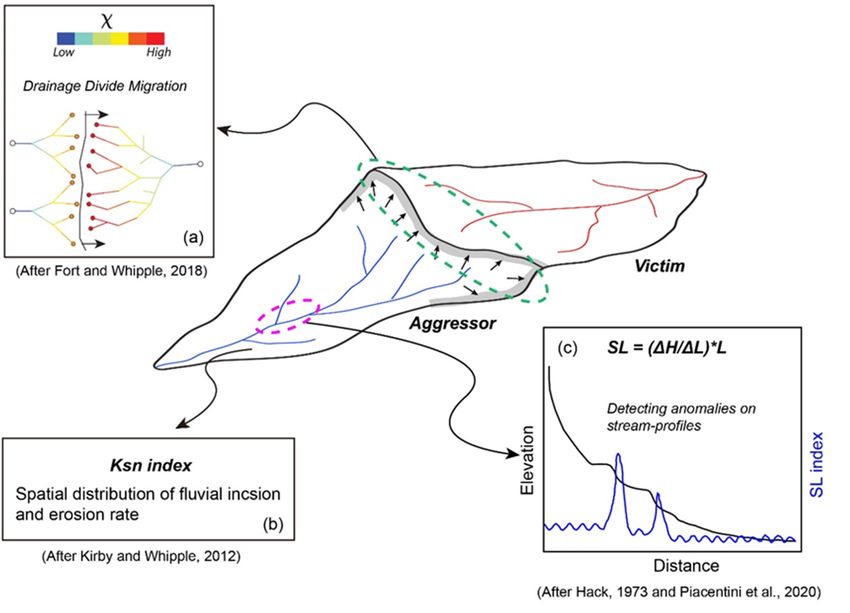
Applicability of Geomorphic Index for the Potential Slope Instability in the Three River Region, Eastern Tibetan Plateau
Sensors   2021,21,
  Sensors2021,  21,6505
                    x FOR PEER REVIEW                                                                                                         8 of 12 8 of 11

                                    Figure 8. Anomalous divides in the Zengqu River catchment. White lines show the divide network,
                                   Figure 8. Anomalous divides in the Zengqu River catchment. White lines show the divide network,
                                    andred
                                   and  redlines
                                             linesdepict
                                                   depictasymmetric
                                                           asymmetric    (DAI
                                                                      (DAI     > 0.4)
                                                                            > 0.4)     divide
                                                                                   divide        edges.
                                                                                            edges.  BlackBlack arrows
                                                                                                          arrows        indicate
                                                                                                                   indicate       the direction
                                                                                                                            the direction and and
                                    magnitudeofofthe
                                   magnitude        theDAI,
                                                        DAI,  with
                                                            with thethe  arrow
                                                                      arrow      pointing
                                                                             pointing        in the
                                                                                        in the      direction
                                                                                                direction      ofinferred
                                                                                                          of the  the inferred  direction
                                                                                                                          direction        of divide
                                                                                                                                    of divide
                                   migration.
                                    migration.The
                                                Theellipses with
                                                     ellipses    thethe
                                                              with   magenta
                                                                        magentalineline
                                                                                    is significant  anomalous
                                                                                         is significant         divides.
                                                                                                        anomalous     divides.

                                   5.5.Discussion
                                       Discussion
                                    5.1. SL-HCA Anomalies and Potential Landslide Zones
                                   5.1. SL-HCA Anomalies and Potential Landslide Zones
                                            Generally,the
                                           Generally,     theanomalies
                                                                anomalies      detected
                                                                            detected         using
                                                                                         using  the the    SL-HCA
                                                                                                      SL-HCA      methodmethod
                                                                                                                             can becanclassified
                                                                                                                                         be classifiedas    as
                                    three    types   related    to  landslides,     lithology,    and    tectonics    [12,47].
                                   three types related to landslides, lithology, and tectonics [12,47]. Based on the spatial dis-Based     on    the   spatial
                                    distribution
                                   tribution    of theof30the   30 anomalies
                                                           anomalies     identifiedidentified     in this
                                                                                       in this study,    we study,
                                                                                                             suggestwe  thatsuggest
                                                                                                                              most of that     most of the
                                                                                                                                       the anoma-
                                    anomalies      are  landslide-type       anomalies.      The  anomalies      related   to faults
                                   lies are landslide-type anomalies. The anomalies related to faults are interpreted as having       are   interpreted     as
                                    having     a tectonic   origin   [49].  The   Zengqu     River   flows   across  several
                                   a tectonic origin [49]. The Zengqu River flows across several fault zones (Figure 2a). How-  fault zones     (Figure    2a).
                                    However,
                                   ever,           thesedo
                                           these faults    faults   do not
                                                              not result   in result
                                                                               obvious  inanomalies
                                                                                           obvious anomalies           along the of
                                                                                                        along the mainstream        mainstream
                                                                                                                                       the Zengquof the
                                    Zengqu       River.   This   can   be  validated     from   the   longitudinal
                                   River. This can be validated from the longitudinal profile of the Zengqu River (Figureprofile  of the   Zengqu   2b). River
                                    (Figure
                                   In   anomaly2b).region
                                                     In anomaly       region
                                                             2, the two        2, theanomalies
                                                                           largest     two largest areanomalies
                                                                                                         distributedare    distributed
                                                                                                                        along  the faultalong
                                                                                                                                            line, notthe fault
                                    line, not
                                   along         along the mainstream
                                            the mainstream       of the Zengqu   ofRiver
                                                                                     the Zengqu       River
                                                                                            (Figure 5).        (Figure
                                                                                                          Tectonic        5). Tectonic
                                                                                                                     anomalies            anomalies
                                                                                                                                   are longer     than are
                                    longer
                                   those      than those
                                            related          related to
                                                     to lithological       lithological
                                                                        contacts           contacts [49].
                                                                                   and landslides       and landslides
                                                                                                              Thus, they [49].    Thus,
                                                                                                                            probably       they
                                                                                                                                        have        probably
                                                                                                                                                 a tec-
                                   tonic
                                    haveorigin.     The origin.
                                            a tectonic    anomalies Thelocated    at thelocated
                                                                          anomalies       lithological
                                                                                                   at the boundaries
                                                                                                            lithological areboundaries
                                                                                                                             classified asare having
                                                                                                                                                   classified
                                   aaslithological   origin [13,14].origin
                                         having a lithological          In anomaly
                                                                               [13,14].regions    2 and 6,regions
                                                                                          In anomaly         few of the
                                                                                                                     2 and anomalies
                                                                                                                              6, few of arethelocated
                                                                                                                                                  anomalies
                                   at
                                    arelithological
                                          located at boundaries
                                                       lithological(Figure
                                                                       boundaries8). The   changes
                                                                                       (Figure         in the
                                                                                                  8). The       bedrock’s
                                                                                                            changes          resistance
                                                                                                                        in the bedrock’s  to resistance
                                                                                                                                               fluvial      to
                                   erosion     cause the
                                    fluvial erosion         morphology
                                                        cause   the morphologyanomalies      along the
                                                                                       anomalies     along channel’s    gradient.
                                                                                                             the channel’s          The landslide
                                                                                                                               gradient.     The landslide
                                   anomalies
                                    anomaliesare   arefrequently
                                                        frequentlyshortshortininlength
                                                                                  length [49]. The
                                                                                            [49]. Theshorter   thethe
                                                                                                         shorter   anomaly,
                                                                                                                        anomaly,thethe
                                                                                                                                     moremorelikely    it it is
                                                                                                                                                   likely
                                    to have a landslide origin [14]. Thus, we suggest that the remaining anomalies in the study
                                    area may be mainly associated with landslides.
                                            The landslide anomalies may be related to the transient state of the Zengqu River.
                                    The longitudinal profile of the Zengqu River indicates that the main trunk is in a transient
Sensors 2021, 21, 6505                                                                                           9 of 11

                         state (Figure 2b). This suggests that an erosional wave will migrate upstream throughout
                         the drainage system [34,50] before the channel reaches a new steady state. During this
                         process, the river incision will most likely predispose the hillslope to mass movement
                         that could dam the valley and induce channel gradient anomalies. If this case is true,
                         the region between anomaly 3 and the knickpoint is a potential landslide zone (Figure 5).
                         Based on the spatial distribution, the channel exhibits significant incision from the outlet
                         to anomaly region 2. However, few landslide anomalies were identified in this region. In
                         contrast, a large quantity of landslide anomalies are distributed along the main trunk and
                         the surrounding tributaries in the anomaly region 3 (Figure 5). This also suggests that
                         anomaly region 3 has already transmitted the erosional wave to its tributaries. That is, the
                         reach below anomaly region 3 is in a nearly steady state. The channel gradient anomalies
                         are minimal or have already disappeared, which may not be captured by the SL-HCA
                         method. As the knickpoint of the trunk migrates upstream over time, the base level of the
                         channel and the surrounding tributaries will change in the zone above anomaly region 3.
                         Consequently, the fluvial incision may generate over-steepened hillslopes that could fail in
                         the future.

                         5.2. Divide Migration and the Potential Landslide Zones
                               The DAI can be used to predict the direction of the divide as the headwaters migrate
                         toward lower relief, higher elevation surfaces (Figure 7). The across-divide difference in
                         the relief is a more direct proxy for erosion, and divides are expected to migrate from high
                         relief to low relief [43]. Figure 7 shows the three main unstable divide regions. We suggest
                         that region DAI-2 is a potential landslide zone. The segment of the divide in region DAI-2
                         is adjacent to a large patch of low-relief surfaces (Figure 7). In the three rivers region,
                         low-relief surfaces at high elevations are transiently produced as a result of the dynamic
                         reorganization of the river networks [51]. They may survive for some time before being
                         degraded or captured as streams erode inwards from their outer perimeters [52]. These low-
                         relief surfaces suggest less exhumation due to lower long-term exhumation rates and/or
                         shorter durations of fluvial incision [20]. The erosion rates derived from low-temperature
                         thermochronometry exhibit variable gradients from downstream to upstream in the three
                         rivers region [24]. A similar spatial pattern of erosion was found based on detrital 10Be
                         data [20]. This regional context implies cross-divide contrasts in erosion, and thus an
                         unstable divide may emerge in region DAI-2.
                               It should be noted that not all of the identified anomalous divides are in fact unstable
                         and migrating with time according to the proxy of the hillslope relief, flow distance, and
                         divide asymmetry [44]. For regions DAI-1 and DAI-3, we are not sure of the cross-divide
                         contrasts in erosion due to the comparatively small area of the low-relief surface compared
                         to that in region DAI-2. Thus, it is not easy to determine whether their divides are unstable.
                         Our approach provides a means of identifying the potential failure of hillslopes due to
                         river incisions on the watershed scale. However, it does not provide a quantitative map of
                         when and where landslides may occur.

                         6. Conclusions
                              The SL index was used to investigate the abnormal gradient along the Zengqu River.
                         We identified 30 anomalies distributed across the study area. Most of them are landslide
                         anomalies. The landslide anomalies mainly cluster in the high fluvial incision area, below
                         the main knickpoint of the Zengqu River. They occurred in response to the base level
                         perturbation caused by the progression of erosion upstream. The fluvial incision may
                         generate over-steepened hillslopes that could fail in the future as the knickpoint of the
                         trunk migrates upstream over time. The DAI can be used to predict the direction of the
                         divide as the headwaters migrate toward the lower relief, higher elevation surfaces. The
                         across-divide difference in the relief is expected to cause landslides as the erosion migrates
                         from high relief to low relief. The proposed methodology can benefit the detection and
                         characterization of potential landslide zones.
Sensors 2021, 21, 6505                                                                                                            10 of 11

                                  Author Contributions: Conceptualization, F.L. and X.Y.; writing-original draft preparation, F.L.;
                                  writing-review and editing, X.Y. and L.L.; funding acquisition, X.Y. All authors have read and agreed
                                  to the published version of the manuscript.
                                  Funding: This work was funded by the National Key Research and Development Program of China
                                  (no. 2018YFC1505002), the second Tibetan Plateau Scientific Expedition and Research Program
                                  (no. 2019QZKK0901) and the National Science Foundation of China (no. 41672204, 41972210).
                                  Institutional Review Board Statement: Not applicable.
                                  Informed Consent Statement: Not applicable.
                                  Data Availability Statement: Not applicable.
                                  Conflicts of Interest: The authors declare no conflict of interest.

References
1.    Densmore, A.L.; Anderson, R.S.; McAdoo, B.G.; Ellis, M.A. Hillslope Evolution by Bedrock Landslides. Science 1997, 275, 369–372.
      [CrossRef]
2.    Roering, J.J. Landslides limit mountain relief. Nat. Geosci. 2012, 5, 446–447. [CrossRef]
3.    Gutiérrez, F.; Soldati, M.; Audemard, F.; Balteanu, D. Recent advances in landslide investigation: Issues and perspec-tives.
      Geomorphology 2010, 124, 95–101. [CrossRef]
4.    Chalkias, C.; Polykretis, C.; Karymbalis, E.; Soldati, M.; Ghinoi, A.; Ferentinou, M. Exploring spatial non-stationarity in the
      relationships between landslide susceptibility and conditioning factors: A local modeling approach using geographically
      weighted regression. Bull. Int. Assoc. Eng. Geol. 2020, 79, 2799–2814. [CrossRef]
5.    Guzzetti, F.; Carrara, A.; Cardinali, M.; Reichenbach, P. Landslide hazard evaluation: A review of current tech-niques and their
      application in a multi-scale study, Central Italy. Geomorphology 1999, 31, 181–216. [CrossRef]
6.    Van Westen, C.J.; Castellanos, E.; Kuriakose, S.L. Spatial data for landslide susceptibility, hazard, and vulnerability assessment:
      An overview. Eng. Geol. 2008, 102, 112–131. [CrossRef]
7.    Ray, R.L.; Lazzari, M.; Olutimehin, T. Remote sensing approaches and related techniques to map and study land-slides. In Land-
      slides; Ray, R., Lazzari, M., Eds.; Intech Open: Rijeka, Croatia, 2020.
8.    Prakash, N.; Manconi, A.; Loew, S. Mapping Landslides on EO Data: Performance of Deep Learning Models vs. Traditional
      Machine Learning Models. Remote Sens. 2020, 12, 346. [CrossRef]
9.    Mondini, A.C.; Guzzetti, F.; Chang, K.-T.; Monserrat, O.; Martha, T.R.; Manconi, A. Landslide failures detection and mapping
      using Synthetic Aperture Radar: Past, present and future. Earth-Sci. Rev. 2021, 216, 103574. [CrossRef]
10.   Solari, L.; Del Soldato, M.; Raspini, F.; Barra, A.; Bianchini, S.; Confuorto, P.; Casagli, N.; Crosetto, M. Review of Satellite
      Interferometry for Landslide Detection in Italy. Remote Sens. 2020, 12, 1351. [CrossRef]
11.   Burbank, D.W.; Anderson, R.S. Tectonic Geomorphology; Blackwell Science: Oxford, UK, 2012.
12.   El Hamdouni, R.; Irigaray, C.; Jiménez-Perálvarez, J.D.; Chacón, J. Correlations analysis between landslides and stream length-
      gradient (SL) index in the southern slopes of Sierra Nevada (Granada, Spain). In Geologically Active; Williams, A.L., Pinches, G.M.,
      Chin, C.Y., McMorran, T.J., Massey, C.Y., Eds.; Taylor and Francis Group: London, UK, 2010; pp. 141–149.
13.   Troiani, F.; Galve, J.P.; Piacentini, D.; Della Seta, M.; Guerrero, J. Spatial analysis of stream length-gradient (SL) index for
      detecting hillslope processes: A case of the Gállego River headwaters (Central Pyrenees, Spain). Geomorphology 2014, 214, 183–197.
      [CrossRef]
14.   Troiani, F.; Piacentini, D.; Della Seta, M.; Galve, J.P. Stream Length-gradient Hotspot and Cluster Analysis (SL–HCA ) to fine-tune
      the detection and interpretation of knickzones on longitudinal profiles. Catena 2017, 156, 30–41. [CrossRef]
15.   Subiela, G.B.; Guinau, M.; Galve, J.P.; Ortuño, M.; Viaplana-Muzas, M.; Pérez-Peña, J.V. Suitability of geomorphological indices
      for the automatic identification of landslides affecting the drainage network: Examples from the Pyrenees. In Proceedings of the
      20th EGU General Assembly, Vienna, Austria, 4–13 April 2018.
16.   Tapponnier, P.; Peltzer, G.; Armijo, R. On the mechanics of the collision between India and Asia. Geol. Soc. Lond. Spéc. Publ. 1986,
      19, 113–157. [CrossRef]
17.   Tapponnier, P.; Zhiqin, X.; Roger, F.; Meyer, B.; Arnaud, N.; Wittlinger, G.; Jingsui, Y. Oblique Stepwise Rise and Growth of the
      Tibet Plateau. Science 2001, 294, 1671–1677. [CrossRef]
18.   Wang, E.; Burchfiel, B.C.; Royden, L.H.; Chen, L.; Chen, J.; Li, W.; Chen, Z.; Wang, E.; Burchfiel, B.C.; Royden, L.H.; et al. Late
      Cenozoic Xianshuihe-Xiaojiang, Red River, and Dali Fault Systems of Southwestern Sichuan and Central Yunnan, China; Geological
      Society of America: Boulder, CO, USA, 1998; pp. 1–108.
19.   Taylor, M.; Yin, A. Active structures of the Himalayan-Tibetan orogen and their relationships to earthquake dis-tribution,
      contemporary strain field, and Cenozoic volcanism. Geosphere 2009, 5, 199–214. [CrossRef]
20.   Henck, A.C.; Huntington, K.W.; Stone, J.O.; Montgomery, D.R.; Hallet, B. Spatial controls on erosion in the Three Rivers Region,
      southeastern Tibet and southwestern China. Earth Planet. Sci. Lett. 2011, 303, 71–83. [CrossRef]
Sensors 2021, 21, 6505                                                                                                               11 of 11

21.   Clark, M.K.; Royden, L.H.; Whipple, K.X.; Burchfiel, B.C.; Zhang, X.; Tang, W. Use of a regional, relict landscape to measure
      vertical deformation of the eastern Tibetan Plateau. J. Geophys. Res. Space Phys. 2006, 111. [CrossRef]
22.   Fox, M.; Carter, A.; Dai, J.-G. How Continuous Are the “Relict” Landscapes of Southeastern Tibet? Front. Earth Sci. 2020, 8.
      [CrossRef]
23.   Liu-Zeng, J.; Tapponnier, P.; Gaudemer, Y.; Ding, L. Quantifying landscape differences across the Tibetan plateau: Implications for
      topographic relief evolution. J. Geophys. Res. Space Phys. 2008, 113. [CrossRef]
24.   Yang, R.; Fellin, M.G.; Herman, F.; Willett, S.D.; Wang, W.; Maden, C. Spatial and temporal pattern of erosion in the Three Rivers
      Region, southeastern Tibet. Earth Planet. Sci. Lett. 2016, 433, 10–20. [CrossRef]
25.   Kirby, E.; Whipple, K. Quantifying differential rock-uplift rates via stream profile analysis. Geology 2001, 29, 415–418. [CrossRef]
26.   Ouimet, W.B.; Whipple, K.X.; Granger, D.E. Beyond threshold hillslopes: Channel adjustment to base-level fall in tectonically
      active mountain ranges. Geology 2009, 37, 579–582. [CrossRef]
27.   Whipple, K.X.; Forte, A.M.; DiBiase, R.A.; Gasparini, N.M.; Ouimet, W.B. Timescales of landscape response to divide migration
      and drainage capture: Implications for the role of divide mobility in landscape evolution. J. Geophys. Res. Earth Surf. 2017, 122,
      248–273. [CrossRef]
28.   Gallen, S.F. Lithologic controls on landscape dynamics and aquatic species evolution in post-orogenic mountains. Earth Planet.
      Sci. Lett. 2018, 493, 150–160. [CrossRef]
29.   Kirby, E.; Whipple, K.X. Expression of active tectonics in erosional landscapes. J. Struct. Geol. 2012, 44, 54–75. [CrossRef]
30.   Murphy, B.P.; Johnson, J.P.L.; Gasparini, N.M.; Sklar, L.S. Chemical weathering as a mechanism for the climatic control of bedrock
      river incision. Nat. Cell Biol. 2016, 532, 223–227. [CrossRef] [PubMed]
31.   Flint, J.J. Stream gradient as a function of order, magnitude, and discharge. Water Resour. Res. 1974, 10, 969–973. [CrossRef]
32.   Howard, A.; Kerby, G. Channel changes in badlands. GSA Bull. 1983, 94, 739–752. [CrossRef]
33.   Montgomery, D.R.; Foufoula-Georgiou, E. Channel network source representation using digital elevation models. Water Resour. Res.
      1993, 29, 3925–3934. [CrossRef]
34.   Wobus, C.; Whipple, K.X.; Kirby, E.; Snyder, N.; Johnson, J.; Spyropolou, K.; Crosby, B.; Sheehan, D. Tectonics from topography:
      Procedures, promise, and pitfalls. In Special Paper 398: Tectonics, Climate, and Landscape Evolution; Geological Society of America:
      Boulder, CO, USA, 2006; pp. 55–74.
35.   DiBiase, R.; Whipple, K.X.; Heimsath, A.M.; Ouimet, W.B. Landscape form and millennial erosion rates in the San Gabriel
      Mountains, CA. Earth Planet. Sci. Lett. 2010, 289, 134–144. [CrossRef]
36.   Safran, E.B.; Bierman, P.R.; Aalto, R.; Dunne, T.; Whipple, K.X.; Caffee, M. Erosion rates driven by channel network incision in the
      Bolivian Andes. Earth Surf. Process. Landf. 2005, 30, 1007–1024. [CrossRef]
37.   Forte, A.M.; Whipple, K.X.; Bookhagen, B.; Rossi, M.W. Decoupling of modern shortening rates, climate, and to-pography in the
      Caucasus. Earth Planet. Sci. Lett. 2016, 449, 282–294. [CrossRef]
38.   Perron, J.T.; Royden, L.H. An integral approach to bedrock river profile analysis. Earth Surf. Process. Landf. 2013, 38, 570–576.
      [CrossRef]
39.   Willett, S.D.; McCoy, S.W.; Perron, J.T.; Goren, L.; Chen, C.-Y. Dynamic Reorganization of River Basins. Science 2014, 343, 1248765.
      [CrossRef]
40.   Dahlquist, M.; West, A.J.; Li, G. Landslide-driven drainage divide migration. Geology 2018, 46, 403–406. [CrossRef]
41.   Whipple, K.X. The influence of climate on the tectonic evolution of mountain belts. Nat. Geosci. 2009, 2, 97–104. [CrossRef]
42.   Whipple, K.X.; Tucker, G. Dynamics of the stream-power river incision model: Implications for height limits of mountain ranges,
      landscape response timescales, and research needs. J. Geophys. Res. Space Phys. 1999, 104, 17661–17674. [CrossRef]
43.   Forte, A.M.; Whipple, K.X. Criteria and tools for determining drainage divide stability. Earth Planet. Sci. Lett. 2018, 493, 102–117.
      [CrossRef]
44.   Scherler, D.; Schwanghart, W. Drainage divide networks—Part 1: Identification and ordering in digital elevation models. Earth
      Surf. Dyn. 2020, 8, 245–259. [CrossRef]
45.   Schwanghart, W.; Scherler, D. Short Communication: TopoToolbox 2—MATLAB-based software for topographic analysis and
      modeling in Earth surface sciences. Earth Surf. Dyn. 2014, 2, 1–7. [CrossRef]
46.   Hack, J.T. Stream-profile analysis and stream-gradient index. J. Res. US Geol. Surv. 1973, 1, 421–429.
47.   Keller, E.A.; Pinter, N. Active Tectonics: Earthquakes, Uplift, and Landscape; Prentice Hall: Upper Saddle River, NJ, USA, 2002.
48.   Piacentini, D.; Troiani, F.; Servizi, T.; Nesci, O.; Veneri, F. SLiX: A GIS Toolbox to Support Along-Stream Knickzones Detection
      through the Computation and Mapping of the Stream Length-Gradient (SL) Index. ISPRS Int. J. Geo-Inf. 2020, 9, 69. [CrossRef]
49.   Bermúdez, M.A.; Velandia, F.; García-Delgado, H.; Jiménez, D.; Bernet, M. Exhumation of the southern transpres-sive Bu-
      caramanga fault, eastern Cordillera of Colombia: Insights from detrital, quantitative thermochronology and geo-morphology.
      J. S. Am. Earth Sci. 2021, 106, 103057. [CrossRef]
50.   Whipple, K.; DiBiase, R.; Crosby, B. 9.28 Bedrock Rivers. In Treatise on Geomorphology; Shroder, J.F., Ed.; Academic Press: San
      Diego, CA, USA, 2013; pp. 550–573.
51.   Yang, R.; Willett, S.D.; Goren, L. In situ low-relief landscape formation as a result of river network disruption. Nat. Cell Biol. 2015,
      520, 526–529. [CrossRef] [PubMed]
52.   Lavé, J. Landscape inversion by stream piracy. Nat. Cell Biol. 2015, 520, 442–443. [CrossRef] [PubMed]
You can also read