Analyzing Covid-19 Data using SIRD Models - ResearchGate
←
→
Page content transcription
If your browser does not render page correctly, please read the page content below
medRxiv preprint doi: https://doi.org/10.1101/2020.05.28.20115527.this version posted May 30, 2020. The copyright holder for this preprint
  (which was not certified by peer review) is the author/funder, who has granted medRxiv a license to display the preprint in perpetuity.
                                     It is made available under a CC-BY-NC-ND 4.0 International license .

                                                          Analyzing Covid-19 Data using SIRD Models                            P age |1

Analyzing Covid-19 Data using SIRD Models
Abhijit Chakraborty1, 2, Jiaying Chen1, 3, 4, Amélie Desvars-Larrive1, 5, Peter Klimek1, 3, Erwin Flores Tames1, David
Garcia1, 3, Leonhard Horstmeyer1, Michaela Kaleta3, Jana Lasser1, 3, Jenny Reddish1, 6, Beate Pinior5, Johannes
Wachs1, 7, Peter Turchin1, 8
1. Complexity Science Hub Vienna, Josefstaedter Strasse 39, 1080 Vienna, Austria
2. Advanced Systems Analysis, International Institute for Applied Systems Analysis (IIASA), Schlossplatz 1, A-2361
Laxenburg, Austria
3. Section for Science of Complex Systems, Center for Medical Statistics, Informatics, and Intelligent Systems,
Medical University of Vienna, 1090, Vienna, Austria
4. Division of Insurance Medicine, Department of Clinical Neuroscience, Karolinska Institutet, SE-171 77,
Stockholm, Sweden
5. Unit of Veterinary Public Health and Epidemiology, Institute of Food Safety, Food Technology and Veterinary
Public Health, University of Veterinary Medicine, Veterinaerplatz 1, 1210 Vienna, Austri
6. Seshat Global History Databank
7. Vienna University of Economics and Business, Institute for Information Business. Welthandelsplatz 1, Vienna
1020, Austria
8. University of Connecticut, Storrs, Connecticut 06269, USA

May 27, 2020
Summary: The goal of this analysis is to estimate the effects of the diverse government intervention measures
implemented to mitigate the spread of the Covid-19 epidemic. We use a process model based on a
compartmental epidemiological framework Susceptible-Infected-Recovered-Dead (SIRD). Analysis of case data
with such a mechanism-based model has advantages over purely phenomenological approaches because the
parameters of the SIRD model can be calibrated using prior knowledge. This approach can be used to investigate
how governmental interventions have affected the Covid-19-related transmission and mortality rate during the
epidemic.

Introduction
An outbreak of “pneumonia of unknown etiology” detected in Wuhan, Hubei Province, China in early December
2019 has induced a large epidemic in China (Li et al. 2020) and has become a worldwide threat, as it was
declared a global pandemic by the World Health Organization (WHO) (WHO Regional Office for Europe 2020).
The causative, newly emerging, agent was identified as a new betacoronavirus and named Severe Acute
Respiratory Syndrome virus coronavirus 2 (SARS-Cov2), as it is genetically related to the SARS-CoV1 that
emerged in 2003. The SARS-Cov2 associated disease has been named “COVID-19” by the WHO on 11 February
2020 (WHO 2020l).
Similarly, to the SARS-CoV1 and Middle East Respiratory Syndrome (MERS) coronavirus, the SARS-Cov2 is
transmitted from person to person principally by respiratory droplets and induces, in most cases, fever and
respiratory symptoms, such as cough, and shortness of breath. The incubation time (latent period) is estimated
to be between 2 and 14 days. To date few cases have been documented in children (Z. Wu and McGoogan 2020;
Cai et al. 2020).
medRxiv preprint doi: https://doi.org/10.1101/2020.05.28.20115527.this version posted May 30, 2020. The copyright holder for this preprint
(which was not certified by peer review) is the author/funder, who has granted medRxiv a license to display the preprint in perpetuity.
It is made available under a CC-BY-NC-ND 4.0 International license .
Analyzing Covid-19 Data using SIRD Models P age |2
China implemented very stringent intervention measures in response to the outbreak. On January 23, 2020, a
cordon sanitaire was set around Wuhan (known as the “Wuhan lockdown”). In the following week, the traffic
was suspended, a home quarantine was enforced, all gatherings were prohibited, and wearing a face mask in
public place became mandatory (Berlinger, George, and Kottasová 2020; Cyranoski and Silver 2020). Despite
these draconian intervention measures, the epidemic continued to spread, with the number of new cases per
day reaching a peak in early February and the epidemic was controlled only in March (for a detailed discussion
of Covid-19 in Wuhan, see section Hubei, China below). Later, worldwide, countries have implemented
unprecedented mitigating interventions, before the introduction of the disease on their respective territories
and in response to the increasing number of cases. However, how those interventions affected the transmission
potential of the Covid-19 is still largely unknown.
Predictive mathematical models for epidemics are essential to understand the course of the epidemic and to
inform preparedness and control strategy plans, as the recent Ebola epidemic made clear (Merler et al. 2015). A
paradigmatic mathematical approach to describe and forecast the course of an epidemic is so-called
compartmental models (Brauer 2008). In the simplest case of such models, the population is segmented into
three different subpopulations or compartments: Susceptible, Infected and Recovered (SIR) individuals
(Kermack, McKendrick, and Walker 1927). There is a constant rate at which susceptibles get infected after a
contact; infected people recover with a constant rate. In these models, epidemic outbreaks only end once the
susceptible population has been depleted to a point where one infected on average transmits the disease to less
than one other person, the threshold of “herd immunity.”
There is a bestiary of model variations in which additional compartments are added to the SIR baseline, such as
an exposed state of individuals that have been infected but are not yet infectious themselves, giving a so-called
SEIR model (Liu, Hethcote, and Levin 1987). If individuals become susceptible again after recovering, one has a
SEIRS model, and so forth. A wide range of epidemic growth patterns can be explained by such models by
including more spatial details, more complex population structures, and how different subpopulations mix
(Chowell et al. 2016). For instance, in many countries the “flattening of the curve” of the COVID-19 epidemic can
be described by extensions of SIR models that model the isolation and quarantine of infected individuals, as well
as lockdown and social distancing measures imposed on the general population (Maier and Brockmann 2020).
Recent years also brought a surge in epidemic models in which susceptible and infected people do not meet
randomly (as in SIR-type models) but interact on social networks (Keeling and Eames 2005), giving rise to
sophisticated agent-based modeling approaches for epidemic forecasts (Ajelli et al. 2010; Balcan et al. 2010).
Here, we use an SIRD model in which individuals either recover or die after being infected. We differ from the
standard textbook formulation of compartmental models by assuming that the rates at which individuals
transition between compartments changes dynamically. These time-dependent rates are often account for
seasonality effects (Stone, Olinky, and Huppert 2007). In this study, we assume that the time-dependence is a
direct consequence of non-pharmaceutical intervention measures. Therefore, the effectiveness of these
interventions can be estimated by measuring the strength of the concurrent reduction in disease transmission
rates.
In this research paper, we propose a model that examine the course of the Covid-19 epidemic and applied it to
29 country case studies. The model considers four stages of infection: susceptible (S), infected (I), recovered (R),
and dead (D).
Materials and MethodsmedRxiv preprint doi: https://doi.org/10.1101/2020.05.28.20115527.this version posted May 30, 2020. The copyright holder for this preprint
(which was not certified by peer review) is the author/funder, who has granted medRxiv a license to display the preprint in perpetuity.
It is made available under a CC-BY-NC-ND 4.0 International license .
Analyzing Covid-19 Data using SIRD Models P age |3
Modeling Framework
The starting point is a discrete-time version of a standard compartmental epidemiological SIRD (susceptible–
infected–recovered–dead) model.
Variables
t time in days
S(t) the number of susceptible at time t
I(t) the number of infected at time t
R(t) the number of recovered at time t
D(t) the number of deaths at time t
N = S + I + R + D, the total population (approximately a constant)
Equations (suppressing time-dependence on the right-hand side, thus, S(t) → S):
S(t+1) = S – βSI/N
I(t+1) = I + βSI/N – γI – δI
R(t+1) = R + γI
D(t+1) = D + δI
Parameters
β transmission coefficient
γ recovery rate
δ death rate
The exponential growth rate during the initial phase of the epidemic, when S ≈ N, is r0 = β – (γ + δ). Note that this
is the (per capita) growth rate per day; thus, its unit is day–1. It is different from the basic reproductive number,
R0 = β/(γ + δ) which is dimensionless. Epidemic grows when r0 > 0 (R0 > 1) and dies out otherwise.
Estimating Intervention Impact on SIRD Parameters
Let ΔS = S(t+1) – S(t) be the daily change in S. ΔI, ΔR, ΔD are defined analogously. Rewriting the discrete SIRD
models in the differenced form we obtain
ΔS = – βSI/N
ΔI = βSI/N – γI – δI
ΔR = γI
ΔD = δI
Solving these equations for parameters we have
β = ΔC/I
γ = ΔR/I
δ = ΔD/I
where ΔC is change per day in the total number of cases, C = I + R + D. We also assumed that S ≈ N (because the
number of total cases so far has been less than 1 percent of the total population).
Thus, if we have data on daily change in I, R, and D we can obtain sequential estimates of the SIRD parameters
on a daily basis. Naturally, these estimates will be very noisy due to both process and observation noise. While
the number of infected are relatively small at the beginning of the pandemic, the process noise is expected to bemedRxiv preprint doi: https://doi.org/10.1101/2020.05.28.20115527.this version posted May 30, 2020. The copyright holder for this preprint
(which was not certified by peer review) is the author/funder, who has granted medRxiv a license to display the preprint in perpetuity.
It is made available under a CC-BY-NC-ND 4.0 International license .
Analyzing Covid-19 Data using SIRD Models P age |4
particularly high. Measurement noise can arise as a result of a number of factors. First, there can be delays in
reporting cases. A constant delay causes no problem for this analysis, because it merely shifts all trajectories by
a constant time lag. However, the delay in reporting may also change. For example, if no data are reported on a
weekend, we will observe zeros infected over the weekend and a cumulative number (over three days) on
Monday. Second, we expect that the detection rate of new cases will be low in the beginning of the epidemic
and then gradually increase as the awareness of the epidemic spreads. Because many individuals infected with
SARS-CoV-2 are asymptomatic, the prevalence of testing asymptomatic cases will affect how many cases are
reported. This affects both new cases and deaths, because initially many deaths due to Covid-19 may be
misclassified as pneumonia caused by other diseases. Third, government agencies responsible for collecting data
may change their definitions of what constitutes “infected” and “recovered”.
All these sources of measurement error will tend to obscure the changes in epidemiological rates resulting from
interventions. Smoothing the daily estimates helps to reveal patterns in the data. This is an effective procedure
for reducing the error arising from variable reporting delays. Ultimately the results reported below are
informative only as long as we can filter out the effect of various errors resulting from inaccurate reports.
Model parameters
The Johns Hopkins University CSSE data repository (Johns Hopkins University Center for Systems Science and
Engineering 2020) provides data on three time-series of Covid-19 indicators: daily counts of confirmed cases (C),
recovered cases (R), and deaths (D). These data allow us to calculate additional time-series, such as:
I(t) = C(t) – [R(t) + D(t)] The number of Infected (aka active cases)
ΔC(t) = C(t+1) – C(t) New cases
ΔD(t) = D(t+1) – D(t) Daily deaths
We use these data to calculate the daily estimates of the SIRD parameters, as described in the preceding
section.
Next, we smooth the data using ksmooth(), a kernel regression function in R. We use the normal kernel and
bandwidth of 10 for β and δ, and 20 for γ. Because data are very noisy when the total number of cases is still
small, we smooth the data only after C(t) exceeds 100 cases and use a constant for the period before, set equal
to the first smoothed estimate.
Using smoothed estimates of the model parameters we solve the SIRD model forward in time for the period of
the epidemic. For initial values we assume S(0) = N, and R(0) = D(0) = 0. For I(0) we use a value that matches
mean model-predicted I(t) to the number of infected in the data for the time period when the cumulative
number of cases exceeds 100. In other words, I(0) is a parameter estimated from the data.
As a measure of model fit, we use the coefficient of prediction R²
predR² = 1 – Σ(Y – X)2/ Σ[X – mean(X)]2
where Y(t) are model predictions (Y stands for C, R, etc), X(t) are data, and mean(X) is the mean of X. This
measure, known as the coefficient of prediction, is similar to the coefficient of determination in regression. It
also reaches a maximum of 1 for perfect prediction. Unlike regression R², however, predR² can be negative,
when the model predicts data worse than the data mean. We calculate predR2 separately for log-transformed
and not-log-transformed data.
Note that the purpose of numerically solving the SIRD equations is not to provide an independent test of the
model. Using raw (unsmoothed) daily parameter values will generate a perfect “fit” of the model to data
because these values were obtained from the data. Calculating trajectories with smoothed parameter curves, on
the other hand, provides a check of internal coherence of the approach. In other words, the question becomesmedRxiv preprint doi: https://doi.org/10.1101/2020.05.28.20115527.this version posted May 30, 2020. The copyright holder for this preprint
(which was not certified by peer review) is the author/funder, who has granted medRxiv a license to display the preprint in perpetuity.
It is made available under a CC-BY-NC-ND 4.0 International license .
Analyzing Covid-19 Data using SIRD Models P age |5
whether smoothing can still generate trajectories close to the data. The second reason to run the predicted
trajectories is that initial counts typically severely underestimate the true number of infected. By chosing I(0)
that fits the later course of the epidemic (after the number of infected exceeds 100) we obtain an estimate of
the course of the epidemic before this threshold is reached. The difference between the predicted and observed
I provides us with an informal estimate of the degree with which the initial numbers were underestimated.
Case studies
In the rest of the document we report analysis results for each country (except for China, where we focus on the
province of Hubei). Each case study begins with Background, which provides a narrative on the overall course of
the Covid-19 epidemic in the focal country. This section is followed by Analysis Results, which are organized as
folllows:
The top two rows show the data (points) and model predictions (curves) for (a) I, (b) D, (c) R, (d) ΔC, (e) ΔD, and
(f) C.
(g) Transmission coefficient (β): daily estimates (points) and smoothed estimate (curve).
(h) Death rate (δ): daily estimates (points) and smoothed estimate (curve).
(i) Exponential growth rate of the epidemic (rt). The dotted line is rt = 0, above which the epidemic grows and
below which it declines.
The final section, Conclusions, provides a brief summary of what has been learned by applying the SIRD model to
the data for the country.
Hubei, China
Background
On 31 December 2019, the WHO China Country Office was informed of a cluster of 27 pneumonia cases of
unknown etiology that had emerged in Wuhan, the capital of Hubei province, China (World Health Organization,
2020a) (although an unverified report from the South China Morning Post suggested that a Covid-19 case traced
back to 17 November 2019, in a 55-year-old from Hubei province, may have been patient zero (Ma 2020)). Cases
within the cluster shared an epidemiological link with the Wuhan Huanan seafood wholesale market, which was
shut down on 1 January 2020. At this stage, there was no clear evidence of human-to-human transmission
(WHO 2020a). On 8 January 2020, results from sequencing analysis from lower respiratory tract samples
revealed a novel coronavirus, which was then named “2019 novel coronavirus (2019-nCoV)” (F. Wu et al. 2020).
On 11 January 2020, the first death from 2019-nCoV was reported in Wuhan (Bryson Taylor 2020). On 20
January 2020, Hubei reported 258 confirmed cases including six deaths (WHO 2020d) and by 29 January the
virus had spread to almost all provinces of mainland China (7,736 confirmed and 12,167 suspected cases, 170
deaths) and to 18 countries around the world (82 confirmed cases) (WHO 2020g). By 8 February, over 723
deaths from the coronavirus infection had been reported in China and 34,598 were confirmed to be infected, of
which 27,100 were in Hubei (WHO 2020k). As of 6 April 2020, the epidemic has led to 67,803 confirmed cases
and 3,212 deaths in Hubei province.
The Chinese health authorities claimed to have promptly enforced intervention measures against the outbreak.
These measures were implemented from 20 January 2020 and included intensive surveillance, epidemiological
investigations of the cluster cases, identification and monitoring of contacts, and active case finding as well as risk
communication to improve public awareness and promote self-protection measures (WHO 2020a). In a press
conference on 20 January, the population was advised to avoid visiting Wuhan unless extremely urgent and to
wear face masks. Moreover, the Chinese New Year celebrations were cancelled and health and temperaturemedRxiv preprint doi: https://doi.org/10.1101/2020.05.28.20115527.this version posted May 30, 2020. The copyright holder for this preprint
(which was not certified by peer review) is the author/funder, who has granted medRxiv a license to display the preprint in perpetuity.
It is made available under a CC-BY-NC-ND 4.0 International license .
Analyzing Covid-19 Data using SIRD Models P age |6
screening was implemented for travelers moving in and out of railway stations (X. W. Wu 2020). Commands for
epidemic control (CEC) were set up in different regions, including Wuhan and Hubei. Many inter-province public
transportation services were suspended. On 23 January 2020, the government of the People's Republic of China
imposed a lockdown in Wuhan and other cities in Hubei province. This was the first known instance in modern
history of a major city with as many as 11 million people being locked down (Crossley 2020; Cyranoski and Silver
2020). The imposed lockdown included travel restrictions to and from Wuhan, a suspension of public transport
within the city, and a mandatory home quarantine (citizens were only allowed to leave their home every two days,
for a maximum of 30 minutes). Social distancing measures were enforced, including the cancellation of events and
gatherings, closure of public places, schools and universities, and prohibition of outdoor activities (Lau et al. 2020;
Zhu, Wei, and Niu 2020). On 23 January, the construction of an emergency field hospital (Huoshenshan Hospital)
to treat patients infected with the coronavirus began, and was completed within 10 days. A second emergency
hospital (Leishenshan Hospital) was built nearby and opened on 8 February (Holland and Lin 2020). New
laboratories were also rapidly set up to increase testing capacity (Miller et al. 2020). Healthcare capacity was
enhanced from 24 January onwards, with more than 30,000 medical workers sent to Hubei, two-thirds of which
were sent to Wuhan (Ye 2020). On Wednesday 18 March, some travel restriction measures were lifted in Hubei.medRxiv preprint doi: https://doi.org/10.1101/2020.05.28.20115527.this version posted May 30, 2020. The copyright holder for this preprint
(which was not certified by peer review) is the author/funder, who has granted medRxiv a license to display the preprint in perpetuity.
It is made available under a CC-BY-NC-ND 4.0 International license .
Analyzing Covid-19 Data using SIRD Models P age |7
Analysis results
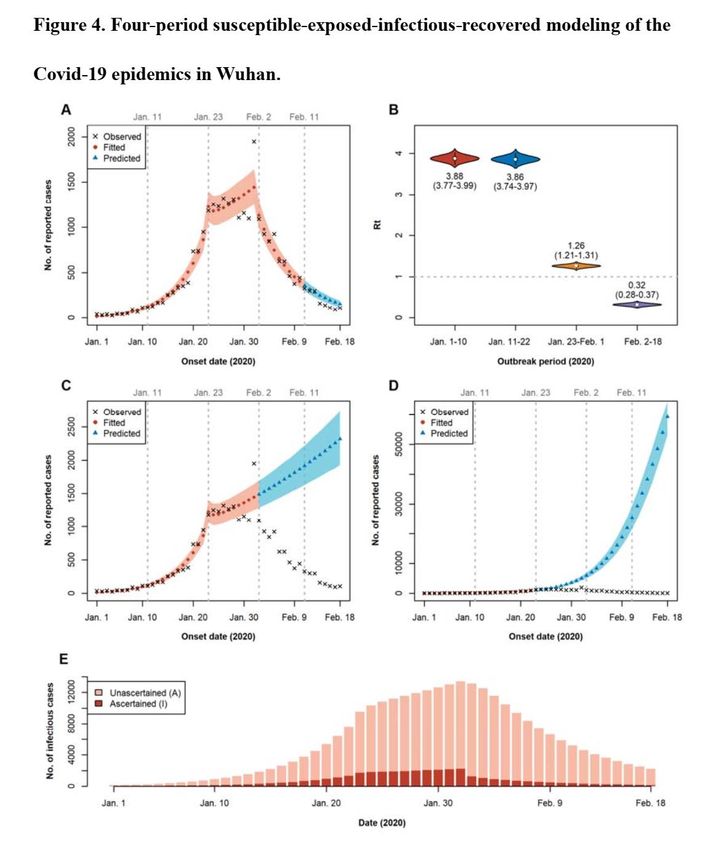
Conclusions
The dataset for China has some limitations. Indeed, the Chinese authorities revised the reporting of cases at
least six times. On April 17 they suddenly accounted for additional >300 cases and >1000 deaths due to Covid-
19. Since diagnostic dates for those additional cases are unknown, the results above were fitted to the data
series ending on April 16. An overall poor fit between model-calculated trajectory and data suggests that the
limitations in the data reporting mentioned above precludes us from obtaining an accurate understanding of the
course of Covid-19 epidemic in Wuhan based on the data reported.
However, we note that Wang et al (2019) obtained a very good fit using a similar mode, which was fitted
to data extracted from the Chinese municipal Notifiable Disease Report System (reference:
https://doi.org/10.1101/2020.03.03.20030593). Below we reproduce a figure from this article. The implication
from this comparison is that our failure to obtain a good fit was due to problems with the data we havemedRxiv preprint doi: https://doi.org/10.1101/2020.05.28.20115527.this version posted May 30, 2020. The copyright holder for this preprint
(which was not certified by peer review) is the author/funder, who has granted medRxiv a license to display the preprint in perpetuity.
It is made available under a CC-BY-NC-ND 4.0 International license .
Analyzing Covid-19 Data using SIRD Models P age |8
available, rather than the course of epidemic in Wuhan deviating from the pattern predicted by the
epidemiological model.
South Korea
Background
The first case of Covid-19 in South Korea was reported on 20 January 2020 and the number of cases increased in
the following weeks (Duddu 2020; Shim et al. 2020). The number of confirmed cases increased significantly after
19 February (Johns Hopkins University Center for Systems Science and Engineering 2020; Shim et al. 2020). By 21
February, the cumulative number of infections had passed 100, with 155 confirmed cases and the first death
from the virus. By a week later, on 28 February, there had been 2,022 cases and 13 deaths (Our World in Data
2020a; 2020d). This explosive growth in infections was linked to “Patient 31,” a member of the ShincheonjimedRxiv preprint doi: https://doi.org/10.1101/2020.05.28.20115527.this version posted May 30, 2020. The copyright holder for this preprint
(which was not certified by peer review) is the author/funder, who has granted medRxiv a license to display the preprint in perpetuity.
It is made available under a CC-BY-NC-ND 4.0 International license .
Analyzing Covid-19 Data using SIRD Models P age |9
Church of Jesus in the city of Daegu who has been described as a “superspreader” (Gregory 2020; Shin and Cha
2020). However, measures taken by the government to contain the Daegu cluster and control the spread of the
virus have been successful. On 15 March, the total number of cases stood at 8,162 and deaths at 75 (Our World
in Data 2020a; 2020d). As of 2 April, there have been 9,976 confirmed cases, of which 169 have died and 5,828
have been reported as recovered (Johns Hopkins University Center for Systems Science and Engineering 2020).
South Korea has therefore achieved an unusually low case fatality rate so far, keeping its Covid-19 death toll
below 300.
The government response to the first cases of Covid-19 in the country focused on contact-tracing and high-tech
surveillance through smartphone data, closed-circuit television footage and credit card data (Sonn 2020).
Mass testing has been a cornerstone of South Korea’s approach. By mid-March around 20,000 people—
including those without symptoms—were being tested per day (Bicker 2020; Edward 2020). Drive-through
testing centres have been used to protect healthcare workers and reduce delays caused by the need to disinfect
hospital facilities after each patient. Both those who test positive and their contacts within the past 14 days
were quarantined and smartphone apps were used to monitor their movements (Kasulis 2020). As of 1 April,
421,547 people have been tested (Statista 2020).
Following the identification of the Daegu cluster, emergency measures were put in place to contain the
outbreak: extra testing centres, contact-tracing and monitoring of Shincheonji members in Daegu and beyond,
and case isolation (Kim 2020; Korean Centers for Disease Control and Prevention 2020). No national lockdown
was implemented: many restaurants and other businesses stayed open but checked customers’ temperature
before admitting them (Choe 2020).
The government has also sought to encourage social distancing and respiratory etiquette among the population.
Schools were closed in late February and as of 2 April they have not yet reopened (BBC News 2020f; Ock 2020;
Shin 2020). Many policies have relied on voluntary public cooperation. Large-scale public information campaigns
promoted wearing masks, washing hands often and thoroughly, and maintaining social distance (Chunghoon
and Soh 2020).medRxiv preprint doi: https://doi.org/10.1101/2020.05.28.20115527.this version posted May 30, 2020. The copyright holder for this preprint
(which was not certified by peer review) is the author/funder, who has granted medRxiv a license to display the preprint in perpetuity.
It is made available under a CC-BY-NC-ND 4.0 International license .
Analyzing Covid-19 Data using SIRD Models P a g e | 10
Analysis results
Conclusions
Although South Korea did not enforce a national lockdown, the measures implemented by the government were
very effective in stopping the disease. The transmission rate declined very rapidly within a ten-day period
centered on 1 March. This caused the exponential rate of disease to cross the zero-line around 10 March.
Currently, all signs indicate that the epidemic is under control (ref).
Japan
Background
On 15 January 2020, the first case of Covid-19 was confirmed in Japan in an adult male, with a history of travel
to Wuhan, China (WHO 2020c; 2020b). Up to 1 February 2020, 17 confirmed cases had been reported to the
WHO (WHO 2020h). The first death due to Covid-19 in Japan was confirmed on 14 February 2020, while 33 casesmedRxiv preprint doi: https://doi.org/10.1101/2020.05.28.20115527.this version posted May 30, 2020. The copyright holder for this preprint
(which was not certified by peer review) is the author/funder, who has granted medRxiv a license to display the preprint in perpetuity.
It is made available under a CC-BY-NC-ND 4.0 International license .
Analyzing Covid-19 Data using SIRD Models P a g e | 11
were confirmed (WHO 2020m). On 1 March 2020, there were 239 confirmed cases and 5 deaths (WHO 2020p).
On 1 April, the total number of confirmed cases was 2,178 with 57 deaths (WHO 2020z). Four days later the
number of new confirmed cases had increased by 66%, counting 3,271 cases and 70 deaths (WHO 2020ab).
Approximately one-third of these confirmed cases were from the Tokyo region (Knüsel 2020). At the end of
March, the new Covid-19 infections could no longer be traced back to known sources, bars, karaoke clubs and
other entertainment venues being the most probable places of infection (Knüsel 2020). Some schools in Japan,
in municipalities with no Covid-19 cases, are set to reopen in April (Siripala 2020). However, many public schools
in Tokyo will remain closed until early May. In the second week of May, a month-long state of emergency for the
Japanese regions of Tokyo, Kanagawa, Saitama, Chiba, Osaka, Hyogo and Fukuoka was declared (Johnston 2020;
McCurry 2020). The state of emergency creates the opportunity to implement at subnational levels (prefectures
and municipalities) more effective and specific measures to mitigate the spread of Covid-19 (Johnston 2020;
McCurry 2020).
As of 3 April 2020, a total of 39,446 people in Japan had undergone PCR tests for COVID-19 (Statista Research
Department 2020) (0.00031% of the total population).medRxiv preprint doi: https://doi.org/10.1101/2020.05.28.20115527.this version posted May 30, 2020. The copyright holder for this preprint
(which was not certified by peer review) is the author/funder, who has granted medRxiv a license to display the preprint in perpetuity.
It is made available under a CC-BY-NC-ND 4.0 International license .
Analyzing Covid-19 Data using SIRD Models P a g e | 12
Analysis resultsmedRxiv preprint doi: https://doi.org/10.1101/2020.05.28.20115527.this version posted May 30, 2020. The copyright holder for this preprint
(which was not certified by peer review) is the author/funder, who has granted medRxiv a license to display the preprint in perpetuity.
It is made available under a CC-BY-NC-ND 4.0 International license .
Analyzing Covid-19 Data using SIRD Models P a g e | 13
Conclusions
The number of cases was low initially in Japan. However, we observe an explosive growth in the number of
infected people around the end of March and the beginning of April 2020. As of 21 April, Japan was able to
reverse the exponential growth rate of epidemic, but it has not crossed the zero line yet. The decay in
exponential growth rate might be related to the strict measures taken by the Japanese government, such as a
state of emergency in seven prefectures on 7 April, which was further extended to the whole country on 16
April.
India
Background
On 30 January 2020, India reported its first case of Covid-19 to the WHO (WHO 2020g; Reid 2020). In total, three
confirmed cases were reported by 1 March 2020 (WHO 2020p), but by 1 April, the number of confirmed cases had
increased to 1,636, with 38 deaths (WHO 2020z). In January, the Indian government announced a travel alert for
Indian citizens, in particular for the city of Wuhan (Yan and Wallen 2020). Screening of people at airports began
on 17 January and approximately 600,000 passengers had been screened for symptoms up to 3 March (Biswas
2020). Between 9 and 23 March, more and more Indian federal states closed their land borders with neighbouring
countries, followed by a travel ban for non-neighboring states, e.g. the European Union. Other countries, such as
Nepal and Bhutan, closed their borders with India (The Hindu 2020; Laskar 2020; ET Bureau 2020). All Indian states
were required to implement social distancing measures from 16 March (Sharma 2020).
On 24 March, the Indian government announced a national lockdown for the next 21 days (BBC News 2020g),
although some Indian states have extended the lockdown until 30 April (Hindustan Times 2020). In this context,
universities, schools, all transports and services have been suspended (exception e.g. essential goods, emergency
services, supermarkets and hospitals). Testing coverage was increased from 20 March: people with symptoms
suggesting possible Covid-19 infection, particularly those of pneumonia, were tested regardless of travel or
contact history (Ghosh 2020). As of 8 April, a total of 127,919 samples have been tested (Findlay 2020) from which
5,194 were positive, and 149 deaths have been reported to the WHO (WHO 2020ac).medRxiv preprint doi: https://doi.org/10.1101/2020.05.28.20115527.this version posted May 30, 2020. The copyright holder for this preprint
(which was not certified by peer review) is the author/funder, who has granted medRxiv a license to display the preprint in perpetuity.
It is made available under a CC-BY-NC-ND 4.0 International license .
Analyzing Covid-19 Data using SIRD Models P a g e | 14
Analysis results
Conclusions
We observe a growth in the number of infected individuals between the middle of March and the first week of
April 2020 in India. As of 11 May, the exponential growth rate of epidemic has decreased, but it has not crossed
the zero line yet. The decay in the exponential growth rate of the epidemic could be related to various
measures, including the enforcement of a national lockdown. What is worrying is that the growth rate of the
epidemic stopped declining in mid-April. Thus, as of 11 May, the government has not succeeded in controlling
the epidemic.
Austria
Background
On 25 February 2020, the first two confirmed cases of Covid-19 in Austria were reported, in Innsbruck. Both
patients had a travel history to Bergamo, Italy (ORF.at 2020a). Both were admitted to hospital and were latermedRxiv preprint doi: https://doi.org/10.1101/2020.05.28.20115527.this version posted May 30, 2020. The copyright holder for this preprint
(which was not certified by peer review) is the author/funder, who has granted medRxiv a license to display the preprint in perpetuity.
It is made available under a CC-BY-NC-ND 4.0 International license .
Analyzing Covid-19 Data using SIRD Models P a g e | 15
discharged, on 5 March (ORF.at 2020b). All contact persons were traced and tested (Al Jazeera 2020a). By 1
March, 1,826 tests had been conducted (Tiroler Tageszeitung 2020). The first Covid-19 death in Austria was
reported on 12 March; the patient had a recent travel history to Italy (ORF.at 2020c; WHO 2020s).[6-7]. One month
later (on 26 March), there were 5,888 confirmed cases and 34 deaths (WHO 2020w). On 3 and 4 April 2020, there
were more newly recovered than newly infected people (on 3 April: 11,383 infected and 2,022 recovered and on
4 April: 11,665 infected and 2,507 recovered (Bundesministerium für Soziales, Gesundheit, Pflege und
Konsumentenschutz 2020a; 2020b)).
On 10 March, the first universities closed, airport and health checks (especially at the border crossings to Italy
(Anschober 2020) were implemented, and people returning from Italy were quarantined. On 10 March, mass
gatherings were prohibited (i.e. of over 100 people indoors or over 500 outdoors) (Kurier 2020). All schools were
closed from 16 March (Peitler-Hasewend and Jungwirth 2020), as of 8 May 2020 they remain closed but are
scheduled to reopen in mid-May 2020 (ORF.at 2020j).
On 13 March, a cordon sanitaire was implemented around the municipalities of Ischgl, Kappl, See, Galtür and St.
Anton am Arlberg in Tyrol (ORF.at 2020e) and four days later (17 March) around the entire federal state of Tyrol
(Van der Bellen and Kurz 2020).[13] On 7 April, the cordons sanitaires were lifted (except for St. Anton, the
Paznaun valley and Sölden) (Kleine Zeitung 2020a). On 14–15 March the Austrian parliament passed the Covid-19
Law, ordering the closure of all non-essential shops from 16 March (ORF.at 2020d). Initially bars, restaurants and
cafes were allowed to open until 3 p.m. (Kleine Zeitung 2020a), but from 17 March all restaurants and bars were
closed completely (ORF.at 2020f). With the Covid-19 Law (ORF.at 2020g), far-reaching restrictions on individual
movement were imposed. Social distancing measures were implemented, e.g. direct patient contact with doctors
was reduced by issuing electronic prescriptions over the phone. The law also required people to keep a distance
of 1–2 meters from others and banned gatherings of more than five people. On 20 March, further social distancing
measures were introduced: children’s playgrounds and sports grounds were closed and working from home was
encouraged. On 25 March, the “Stopp Corona” tracking app was released, which allows users to be notified when
they have come into contact with a person infected with Covid-19 (Österreichisches Rotes Kreuz 2020).
From 6 April, it became compulsory to wear a basic face mask, covering the mouth and nose, inside supermarkets,
and from 14 April this requirement was extended to public transport (ORF.at 2020i; 2020h). Beginning on 14 April,
small shops under 400 m2, hardware stores and garden centres were allowed to reopen with adaptative measures,
i.e. no more than one customer per 20 square meters. From 1 May, other shops and hairdressers will also be able
to reopen in Austria (Der Standard 2020).medRxiv preprint doi: https://doi.org/10.1101/2020.05.28.20115527.this version posted May 30, 2020. The copyright holder for this preprint
(which was not certified by peer review) is the author/funder, who has granted medRxiv a license to display the preprint in perpetuity.
It is made available under a CC-BY-NC-ND 4.0 International license .
Analyzing Covid-19 Data using SIRD Models P a g e | 16
Analysis results
Conclusions
Austria gradually shut down in early March and by 15 March the implemented measure may have decreased the
transmission coefficient. The progress was rapid and by early April the exponential growth rate of the epidemic
crossed the zero line. Under the current conditions the epidemic is showing clear signs of dying out.
USA
Background
The first confirmed case in the United States was reported to the WHO on 23 January 2020 (WHO 2020e). On 1
March 62 cases had been confirmed (WHO 2020p). On 3 May, a total of 1,093,880 confirmed cases and 62,406
deaths had been reported (WHO 2020ah).medRxiv preprint doi: https://doi.org/10.1101/2020.05.28.20115527.this version posted May 30, 2020. The copyright holder for this preprint
(which was not certified by peer review) is the author/funder, who has granted medRxiv a license to display the preprint in perpetuity.
It is made available under a CC-BY-NC-ND 4.0 International license .
Analyzing Covid-19 Data using SIRD Models P a g e | 17
The United States has introduced a series of travel restrictions. Foreign nationals with a travel history within the
past 14 days to specific countries, such as China (from 2 February) and Iran (2 March), were barred from entering
the country, while Americans returning from these countries were ordered to self-quarantine for 14 days
(University of Colorado Boulder 2020; Robertson 2020). On 13 March a national state of emergency was declared
(Liptak 2020a). On 16 March the government advised against meetings of over 10 people (Liptak 2020b).
New York has been particularly severely affected by the epidemic, the state of emergency was declared on 7
March. Several executive orders requiring progressively more non-essential workers to stay at home were issued.
All mass gatherings of over 500 people were cancelled from 13 March, and events with fewer than 500 attendees
were ordered to “cut capacity by 50 percent” (The New York State Governor 2020). Effective from 22 March, the
“New York State on PAUSE” executive order ordered “all non-essential businesses statewide” to close (NY State
Department of Health n.d.). This order also directed the population to suspend all non-essential social contact,
maintain a distance of six feet from other people in public, limit the use of public transport to “when absolutely
necessary,” and to self-isolate at home if they became sick.
Ohio’s state government closed all bars and restaurants on 15 March, and was followed by Illinois (Conradis 2020),
New York, New Jersey, and Maryland (Education Week 2020). On 16 March, the national government announced
that citizens should stay home and avoid contact for 15 days, and these social distancing measures were then
extended until the end of April (Keith et al. 2020). Lockdowns were implemented at different times in different
states, such as in Idaho on 25 March and Alabama on 4 April (Education Week 2020). The majority of schools
nationwide have been closed since 10 April (Education Week 2020). At the beginning of April, the governments of
several states and cities, including New York, Los Angeles, Colorado, and Pennsylvania, have asked citizens to wear
face masks in public spaces (Education Week 2020; Durkin 2020; Briggs, Wolfman-Arent, and MacDonald 2020).medRxiv preprint doi: https://doi.org/10.1101/2020.05.28.20115527.this version posted May 30, 2020. The copyright holder for this preprint
(which was not certified by peer review) is the author/funder, who has granted medRxiv a license to display the preprint in perpetuity.
It is made available under a CC-BY-NC-ND 4.0 International license .
Analyzing Covid-19 Data using SIRD Models P a g e | 18
Analysis results
Conclusions
The early course of the Covid-19 epidemic in the USA (before March) cannot be resolved with the present data.
The reporting rate clearly improved after 1 March. For the first three weeks in March, the epidemic grew nearly
exponentially with a transmission rate of nearly 0.25 per day. Beta started to decline only towards the end of
March. Unfortunately, by 11 May beta was still at 0.025, which was enough to slow down the growth of
epidemic but not enough to bring it to an end. As of 11 May, the exponential growth parameter, r(t), is still
positive.medRxiv preprint doi: https://doi.org/10.1101/2020.05.28.20115527.this version posted May 30, 2020. The copyright holder for this preprint
(which was not certified by peer review) is the author/funder, who has granted medRxiv a license to display the preprint in perpetuity.
It is made available under a CC-BY-NC-ND 4.0 International license .
Analyzing Covid-19 Data using SIRD Models P a g e | 19
Taiwan
Background
The first confirmed case in Taiwan was reported on 21 January, and according to the Central Epidemic Command
Center (CECC), set up on 22 January, 124 separate measures have been implemented since the beginning of the
pandemic (Wang, Ng, and Brook 2020). Taiwan began to respond to the pandemic early on, before the first
confirmed cases. The government introduced inspection measures for all incoming flights from Wuhan, China
from 31 December 2019. Health screening was implemented for all incoming travellers from Wuhan on the
same date (Wang, Ng, and Brook 2020).
Contact tracing started on 5 January: the government started monitoring travellers who had been to Wuhan,
China in the past 14 days. Individuals classified as high-risk according to their recent travel history were ordered
to self-quarantine (Wang, Ng, and Brook 2020). On 14 February the government launched the Entry Quarantine
System for contact tracing, an online health declaration platform for all incoming travellers upon arrival (Wang,
Ng, and Brook 2020).
The government promoted the wearing of face masks as a preventative measure and banned the export of face
masks on 24 January. To prevent citizens from hoarding face masks and raising the price, the government
implemented a mask rationing system, which limited the quantity each citizen could buy and when they could
buy them, based on their health insurance number (Ku and Kao 2020). The government increased face mask
production to 8 million per day and formed 60 new production lines to meet the demand (Yang 2020). By 7
April, daily testing capacity had increased to 3,800 (Taiwan Centers for Disease Control 2020b).
Travel tours from China were suspended in February, and this restriction was subsequently extended to other
high-risk regions. The number of confirmed cases rose rapidly in March due to the high volume of incoming
travelers (The Straits Times 2020). The government tightened its airport and border control by denying entry to
foreign nationals from 19 March and imposing a 14-day self-quarantine for all incoming travelers (Chang, Huang,
and Chen 2020). Social distancing measures have also been implemented, including the cancellation of mass
gatherings of over 100 people on 25 March (Taiwan Centers for Disease Control 2020c; 2020a).
Analysis resultsmedRxiv preprint doi: https://doi.org/10.1101/2020.05.28.20115527.this version posted May 30, 2020. The copyright holder for this preprint
(which was not certified by peer review) is the author/funder, who has granted medRxiv a license to display the preprint in perpetuity.
It is made available under a CC-BY-NC-ND 4.0 International license .
Analyzing Covid-19 Data using SIRD Models P a g e | 20
(a) Infected (Active Cases) (b) Total Deaths (c) Recovered
6
300
200
5
250
150
4
200
150
3
100
100
2
50
50
1
0
0
0
Feb 01 Mar 01 Apr 01 Feb 01 Mar 01 Apr 01 Feb 01 Mar 01 Apr 01
(d) New Cases (e) Daily Deaths (f) Total Confirmed Cases
3.0
400
25
2.5
20
300
2.0
15
1.5
200
10
1.0
100
0.5
5
0.0
0
0
Feb 01 Mar 01 Apr 01 Feb 01 Mar 01 Apr 01 Feb 01 Mar 01 Apr 01
(g) beta(t) (h) delta(t) (i) r(t)
0.15
0.06
0.6
0.05
0.10
0.5
0.04
0.4
0.03
0.05
0.3
0.02
0.2
0.01
0.00
0.1
0.00
0.0
Feb 01 Mar 01 Apr 01 Feb 01 Mar 01 Apr 01 Feb 01 Mar 01 Apr 01
Conclusions
The time series runs from 22 January to 21 April 2020, with confirmed cases ranging from 1 to 422. The
relatively low active cases and infection rate may be due to the Taiwanese government’s early interventions:
case identification and health checks at airports from 31 December 2019, travel restrictions denying entry to
people who had been in Wuhan from 22 January 2020, and social distancing measures (event cancellations and
closure of educational institutions) in February 2020. Additional quarantine measures were introduced on 19
March 2020.The government has increased testing capacity since 24 January 2020 (when there were just three
confirmed cases), which is an important measure for targeting the source of the spread.medRxiv preprint doi: https://doi.org/10.1101/2020.05.28.20115527.this version posted May 30, 2020. The copyright holder for this preprint
(which was not certified by peer review) is the author/funder, who has granted medRxiv a license to display the preprint in perpetuity.
It is made available under a CC-BY-NC-ND 4.0 International license .
Analyzing Covid-19 Data using SIRD Models P a g e | 21
The overall trend of the R(t) and the SIRD model suggests that the infection rate and number of active cases rose
rapidly after day 40. The SIRD model-fitting did not perform too well using data from Taiwan, with a mean R2 of
0.76. In particular, the daily death rate was estimated poorly. The confirmed cases were underestimated prior to
day 40. Taiwan implemented a series of measures early on during the pandemic, which may be the reason for
the low number of cumulative active cases, and relatively low R(t) until 8 March. The surge in the number of
cases was mostly due to imported cases, which cannot be addressed by one or two intervention measures
alone. The transmission rate in the country decreased around mid-March. The effectiveness of increased testing
capacity and contact-tracing measures may be reflected in the rising infected cases from day 58. The
exponential growth rate of the epidemic decreased rapidly from around the end of March to mid-April, and the
growth rate has crossed the zero-line. The fitted model suggests that the epidemic is slowing down in the
country and that the interventions were effective.
Australia
Background
The first confirmed case in Australia was reported on 25 January 2020 (Australian Government Department of
Health 2020), and as of 13 April there were 6,322 confirmed cases (Our World in Data 2020b). The government
barred entry to travellers from China on 1 February as the virus spread rapidly there, and subsequently imposed
an additional travel ban from other high-risk countries, such as Italy and South Korea (Bagshaw 2020; Bagshaw
and McCauley 2020; Pannett 2020). Prime Minister Scott Morrison declared a human biosecurity emergency on
18 March, which allowed the government to enforce restrictions on individual movement and regional
lockdowns (Pandey 2020). On the following day, Australia closed its border to all foreign nationals not resident
in the country (Brockett and Scott 2020). On 22 March it was announced that no more than one person per four
square metres would be allowed in indoor public places such as bars and restaurants, while other social
distancing measures (including closing educational institutions and non-essential services) varied from county to
county (Boseley and Knaus 2020). Mass gatherings of more than 500 people were suspended on 13 March, and
more stringent measures limiting gatherings to two people came into force on 29 March (ABC News 2020;
Worthington 2020). In addition to travel restrictions and social distancing, measures designed to prepare the
healthcare system have been introduced, such as increasing the number of ventilators available and enhancing
testing capacity (Lawson 2020; Tadros, McIlroy, and Margo 2020).
Analysis resultsmedRxiv preprint doi: https://doi.org/10.1101/2020.05.28.20115527.this version posted May 30, 2020. The copyright holder for this preprint
(which was not certified by peer review) is the author/funder, who has granted medRxiv a license to display the preprint in perpetuity.
It is made available under a CC-BY-NC-ND 4.0 International license .
Analyzing Covid-19 Data using SIRD Models P a g e | 22
(a) Infected (Active Cases) (b) Total Deaths (c) Recovered
5000
60
4000
4000
50
3000
3000
40
2000
30
2000
20
1000
1000
10
0
0
0
Feb 01 Mar 01 Apr 01 Feb 01 Mar 01 Apr 01 Feb 01 Mar 01 Apr 01
(d) New Cases (e) Daily Deaths (f) Total Confirmed Cases
500
5
1000 2000 3000 4000 5000 6000
400
4
300
3
200
2
100
1
0
0
0
Feb 01 Mar 01 Apr 01 Feb 01 Mar 01 Apr 01 Feb 01 Mar 01 Apr 01
(g) beta(t) (h) delta(t) (i) r(t)
0.20
0.7
0.06
0.15
0.6
0.05
0.5
0.10
0.04
0.4
0.05
0.03
0.3
0.00
0.02
0.2
−0.05
0.01
0.1
0.00
−0.10
0.0
Feb 01 Mar 01 Apr 01 Feb 01 Mar 01 Apr 01 Feb 01 Mar 01 Apr 01
Conclusions
The model fitted with mean R2=0.91. The infected cases reached a peak around day 70, and the number of
active cases began to decrease after this point. The total deaths showed similar a pattern to the new cases. The
death rate was very low and flat during the observation period, and the transmission rate has been decreasing
from the beginning of March. There was a growth in the number of infected cases around 15 March, which may
due to the increasing testing capacity. Subsequently the growth rate of the epidemic declined rapidly and
crossed the zero-line. The fitted model showed signs that the epidemic is slowing down and is under control in
the country.medRxiv preprint doi: https://doi.org/10.1101/2020.05.28.20115527.this version posted May 30, 2020. The copyright holder for this preprint
(which was not certified by peer review) is the author/funder, who has granted medRxiv a license to display the preprint in perpetuity.
It is made available under a CC-BY-NC-ND 4.0 International license .
Analyzing Covid-19 Data using SIRD Models P a g e | 23
Italy
Background
On 20 February 2020, the first case of Covid-19 was notified in Italy, in the Lombardy region. In the following
week, the number of cases increased rapidly in the southern part of Lombardy (Cereda et al. 2020). On 22
February 2020, 60 additional cases as well as the first two deaths were notified (Dong, Du, and Gardner 2020).
As the epidemic progressed, it spread to other Italian regions. On 19 March 2020, the number of deaths due to
Covid-19 in Italy surpassed that of China. As of 7 April 2020, Italy is one of the biggest active hotspots of Covid-
19 worldwide, with a total of 132,547 confirmed cases and 16,523 deaths (Dong, Du, and Gardner 2020).
However, the true number of cases has probably been underestimated due to limited testing capacity (Flaxman
et al. 2020).
On 31 January, the Italian government declared a state of emergency and all flights to and from China were
suspended. On 21 February a cordon sanitaire was imposed around 10 municipalities in northern Italy (Desvars-
Larrive et al. 2020). The cordon sanitaire around the epicentre of the outbreak in Codogno appears to have
played a critical role in controlling the infection (Cereda et al. 2020). On 2 March 2020, as Italy reached 100
deaths, the government announced the complete closure of all educational institutions. On 9 March 2020, a
national lockdown was imposed (Desvars-Larrive et al. 2020). Two days later, the government ordered the
closure of all bars, restaurants and non-essential shops (Sylvers and Legorano 2020). On 19 March 2020 non-
essential individual movements were prohibited, including all outdoor activities, and public places closed down.
On 23 March 2020, all non-essential companies and industries were closed (Desvars-Larrive et al. 2020).medRxiv preprint doi: https://doi.org/10.1101/2020.05.28.20115527.this version posted May 30, 2020. The copyright holder for this preprint
(which was not certified by peer review) is the author/funder, who has granted medRxiv a license to display the preprint in perpetuity.
It is made available under a CC-BY-NC-ND 4.0 International license .
Analyzing Covid-19 Data using SIRD Models P a g e | 24
Analysis results
Conclusions
Although Italy has declared a state of emergency on 31 January, effective measures to slow down the rate of
spread of the epidemic required more than a month to take effect. The transmission rate began declining after 1
March. Meanwhile, the death rate increased, reaching a peak in mid-March, probably because the healthcare
system of Italy was overwhelmed by the number of patients requiring intensive care and respirators. The
measures taken by the government finally bore fruit when the exponential growth rate of the epidemic crossed
the zero line in late April.
Spain
Background
Spain has been one of the countries worst-hit by the pandemic. The first few cases of Covid-19 were identified
outside peninsular Spain and were linked to tourism in the Canary Islands. On 31 January, a German tourist onmedRxiv preprint doi: https://doi.org/10.1101/2020.05.28.20115527.this version posted May 30, 2020. The copyright holder for this preprint
(which was not certified by peer review) is the author/funder, who has granted medRxiv a license to display the preprint in perpetuity.
It is made available under a CC-BY-NC-ND 4.0 International license .
Analyzing Covid-19 Data using SIRD Models P a g e | 25
the island of La Gomera tested positive (Linde 2020). In late February a doctor from Lombardy (northern Italy)
on holiday in Tenerife was found to have contracted the virus, causing the hotel he had been staying in to be
locked down for two weeks (Jones, Boseley, and Burgen 2020; BBC News 2020c). Cases on the Spanish mainland
began to take off in early March. The number of confirmed cases for the whole country by 29 February was 34;
this had risen to 5,753 just two weeks later (15 March), and by 31 March 78,797 people had tested positive (Our
World in Data 2020c). Spain overtook China in the number of confirmed cases on 30 March (Laudette and
Landauro 2020). With 140,511 cases as of 7 April, the country is now second only to the USA in the scale of its
epidemic (Johns Hopkins University Center for Systems Science and Engineering 2020). Its death rate is also very
high: again as of 7 April, 13,897 people have died and 43,208 have been recorded as recovered (Johns Hopkins
University Center for Systems Science and Engineering 2020).
Both the Spanish government and the governments of the autonomous communities have been criticized in the
international press for a delayed response to the pandemic, despite the crisis unfolding in nearby Italy (Tremlett
2020; Ward 2020). An Interministerial Coordination Committee (Comité de Coordinación Interministerial) was
created on 4 February to spearhead the country’s response (Ministerio de Sanidad, Consumo y Bienestar Social
2020; Desvars-Larrive et al. 2020). However, testing was initially slow to take off, and medical professionals
warned that they lacked the resources needed to test all those showing symptoms (Güell, Sevillano, and Linde
2020).
Border restrictions were introduced gradually: flights between Spain and Italy were suspended on 11 March
(Ministerio de la Presidencia, Relaciones con las Cortes y Memoria Democrática 2020), and on 16 March Spain
announced that it would not allow foreign nationals to enter through its land borders except in special cases (Al
Jazeera 2020c).
An important turning point in Spain’s approach was the declaration of a state of alarm on 14 March. Before that
point, some social distancing measures had been implemented, such as the closure of schools by all autonomous
communities between 9 and 12 March (Mateo and Ferrero 2020; RTVE.es 2020) and a ban on events with over
1,000 people by the Catalan government on 11 March (Rodríguez 2020). But on 8 March, “sports events,
political party conferences and massive demonstrations to mark International Women’s Day all took place”
(Tremlett 2020). The state of alarm signaled a much more restrictive approach, effectively a complete lockdown:
citizens were ordered to stay at home unless going to work, shopping for necessities or helping others; cafes,
restaurants and entertainment venues were closed (Zafra, Galocha, and Alonso 2020). Even leaving the house
for exercise (such as a short walk, jog or bike ride) was banned. On 29 March the lockdown was tightened: all
non-essential workers were ordered to stay at home (Marcos 2020). Prime Minister Pedro Sánchez announced
on 4 April that the state of alarm would be extended until the 26th of the month (Cué, Junquera, and Vizoso
2020).You can also read