Distinguishing Tidal Disruption Events from Impostors
←
→
Page content transcription
If your browser does not render page correctly, please read the page content below
ISSI Book on TDEs manuscript No.
                                              (will be inserted by the editor)

                                              Distinguishing Tidal Disruption Events from
                                              Impostors

                                              Ann Zabludoff · Iair Arcavi · Stephanie
                                              La Massa · Hagai B. Perets · Benny
                                              Trakhtenbrot · B. Ashley Zauderer ·
                                              Katie Auchettl · Jane L. Dai · K. Decker
                                              French · Tiara Hung · Erin Kara ·
                                              Giuseppe Lodato · W. Peter Maksym ·
                                              Yujing Qin · Enrico Ramirez-Ruiz ·
arXiv:2103.12150v2 [astro-ph.HE] 8 Apr 2021

                                              Nathaniel Roth · Jessie C. Runnoe ·
                                              Thomas Wevers
                                              Received: date / Accepted: date

                                              Abstract Recent claimed detections of tidal disruption events (TDEs) in
                                              multi-wavelength data have opened potential new windows into the evolu-
                                              tion and properties of otherwise dormant supermassive black holes (SMBHs)
                                              in the centres of galaxies. At present, there are several dozen TDE candidates,
                                              which share some properties and differ in others. The range in properties is
                                              broad enough to overlap other transient types, such as active galactic nuclei
                                              (AGN) and supernovae (SNe), which can make TDE classification ambiguous.
                                              A further complication is that “TDE signatures” have not been uniformly
                                              observed to similar sensitivities or even targeted across all candidates. This
                                              chapter reviews those events that are unusual relative to other TDEs, in-
                                              cluding the possibility of TDEs in pre-existing AGN, and summarises those
                                              characteristics thought to best distinguish TDEs from continuously accreting
                                              AGN, strongly flaring AGN, SNe, and Gamma-Ray Bursts (GRBs), as well as
                                              other potential impostors like stellar collisions, “micro-TDEs,” and circumbi-
                                              nary accretion flows. We conclude that multiple observables should be used to
                                              classify any one event as a TDE. We also consider the TDE candidate pop-
                                              ulation as a whole, which, for certain host galaxy or SMBH characteristics,
                                              is distinguishable statistically from non-TDEs, suggesting that at least some
                                              TDE candidates do in fact arise from SMBH-disrupted stars.

                                              A. Zabludoff (University of Arizona, aiz@arizona.edu) · I. Arcavi (Tel Aviv University) ·
                                              S. La Massa (STScI) · H. Perets (Technion) · B. Trakhtenbrot (Tel Aviv University) · B.
                                              A. Zauderer (NSF) · K. Auchettl (University of Melbourne) · J. L. Dai (HKU) · K.D.
                                              French (Carnegie Obs) · T. Hung (UCSC) · E. Kara (MIT) · G. Lodato (Milan) · W.P.
                                              Maksym (Harvard-Smithsonian CfA) · Y. Qin (Arizona) · E. Ramirez-Ruiz (UCSC) · N.
                                              Roth (Maryland) · J. Runnoe (Vanderbilt) · T. Wevers (ESO)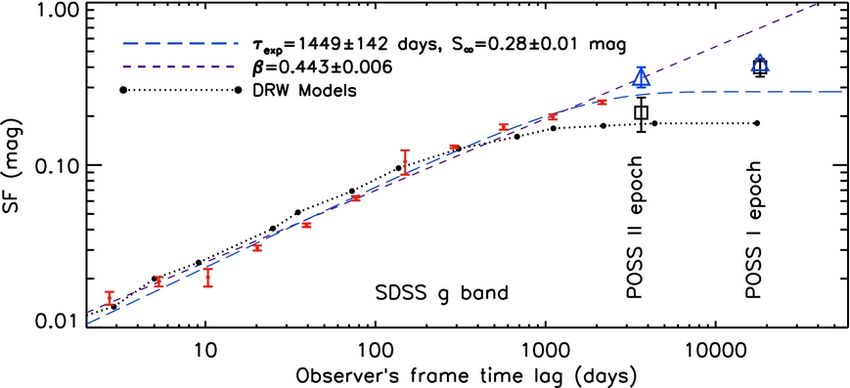
2                                                                  Zabludoff et al.

1 Introduction

A TDE is a star disrupted by a SMBH. The TDEs discussed in previous chap-
ters span a range of observed characteristics, including candidates detected
first or only in X-rays, optical, or UV light, and with or without broad H/He,
coronal, or Bowen emission lines. All are energetic transient events consistent
with arising from galactic nuclei and are not known to have re-occurred.
    Yet there are non-TDE transients—large AGN flares, SNe near or pro-
jected on the nucleus—with potentially similar features. Even some “normal,”
continuously accreting AGN may vary over timescales longer than some TDE
candidates have so far been monitored. The range of TDE properties, which
can overlap those of other transient types, suggests that there is no one ob-
servable that distinguishes TDEs unambiguously from impostors. Nor has
the developing field of modelling TDE formation and emission found such
a “smoking-gun.”
    For the time being, we must rely on the standards of jurisprudence and
require a preponderance of evidence, a suite of distinguishing features. We also
can employ statistical arguments to test the authenticity of at least some TDE
detections. What are those features and arguments?
    In this chapter, we first discuss those current TDE candidates whose prop-
erties are rare or new among claimed TDEs and examine the reasons to favour
the TDE explanation. Then, for the remaining TDE candidates, we review
those observables that are generally interpreted as TDE signatures, compar-
ing them to what is known about continuously accreting AGN, AGN with
strong flares arising from disk instabilities, SNe, and GRBs, as well as other
potential impostors like stellar collisions, “micro-TDEs,” and circumbinary
accretion flows. Lastly, we explore using TDE demographics, specifically the
projected offset relative to the galactic nucleus, the SMBH mass, and the stel-
lar mass and star formation history of the host galaxy, to distinguish them
statistically from non-TDE sources.

2 Unusual TDE Candidates

On-going time-domain surveys, and comprehensive follow-up campaigns, are
continuously revealing new flares and transients in galactic nuclei. Some ob-
jects initially thought to be TDEs have been reclassified due to the subse-
quent detection of similar, non-TDE transients, e.g., F01004-2237 (Tadhunter
et al. 2017), after the discoveries of OGLE17aaj (Gromadzki et al. 2019) and
AT 2017bgt (Trakhtenbrot et al. 2019b, see Section 3.2.2), illustrating the chal-
lenge of disentangling TDE emission from other peculiar nuclear transients.
Here we discuss unusual classes of objects that are still considered TDE can-
didates, but that are represented by only one or a handful of members. The
coming era of RubinObs/LSST and eROSITA, when thousands of new TDE
candidates will be identified, should reveal the true nature of these classes.
Unusual and Impostor TDEs                                                        3

2.1 PS1-11af

PS1-11af is interpreted as a partial TDE (i.e., a disruption of the envelope
of the star, leaving the core intact) by Chornock et al. (2014). Absorption
features became apparent in the UV spectrum 24 days post flare that bear
a similarity to P-Cygni troughs observed in SNe. Yet the apparent velocities
of these features (∼13,000 km s−1 ) are too high for material in homologous
expansion near a SN photosphere. Furthermore, fits to the SED with a black-
body model show that the radius of the emitting ejecta does not increase and
the temperature does not decrease, as would be expected for SN evolution.
PS1-11af has a blue colour that evolves weakly over time, a common charac-
teristic of optically-detected TDEs (e.g., van Velzen et al. 2011; Gezari et al.
2012). The amount of accreted mass needed to power the observed luminos-
ity is low (∼ 0.002M ), which Chornock et al. (2014) ascribe to the partial
stellar tidal disruption. In this scenario, optical photons would be reprocessed
from the accretion disk to higher (X-ray) energies (e.g., Strubbe and Quataert
2009; Guillochon and Ramirez-Ruiz 2013), which requires contemporaneous
X-ray coverage to confirm this hypothesis. Lacking the observations at this
energy range, Chornock et al. (2014) can only propose that a partial stellar
tidal disruption explains the available data, but the picture remains necessar-
ily incomplete, underscoring the importance of simultaneous multi-wavelength
coverage in unveiling the physics driving transient phenomena.

2.2 ASASSN-15lh

ASASSN-15lh was first interpreted as the most luminous SN ever detected
(Dong et al. 2016). Its optical spectrum is devoid of hydrogen and helium fea-
tures and contains broad absorption features between 3000 - 4100 Å. One such
feature is attributed to OII λ4100, which is also seen in hydrogen-poor super-
luminous SNe (e.g., Quimby et al. 2011). However, an additional OII λ4400
feature observed in SNe is not present. This discrepancy, together with the
location of ASASSN-15lh in the center of a non-starforming massive galaxy,
prompted Leloudas et al. (2016) to consider ASASSN-15lh as a TDE (see also
Krühler et al. 2018; van Velzen 2018; Mummery and Balbus 2020). The inferred
SMBH mass from simple galactic scalings exceeds 108 M , implying that a
solar-mass, solar-radius star would be swallowed whole rather than disrupted,
but Leloudas et al. (2016) point out that a spinning SMBH would tidally dis-
rupt the star and produce a transient (see also Margutti et al. 2017). As a
result, ASASSN-15lh, if indeed a TDE, could then be used to infer the SMBH
spin, a property that is challenging to constrain with most other methods.
    Another peculiar property of ASASSN-15lh is its double-peaked UV light
curve (its optical light curve is single-peaked). This bimodality, also observed in
the TDE candidate AT2018fyk (Wevers et al. 2019, see below), is unusual and
difficult to explain under both the SN and TDE interpretations. Leloudas et al.
(2016) propose that the first peak is powered by circularisation of the debris,
4 Zabludoff et al.
while the second is from accretion; the timescales are roughly consistent with
those expected from a spinning SMBH. Alternatively, Coughlin and Armitage
(2018) and Vigneron et al. (2018) argue that both the double peaked light
curve and the apparent high SMBH mass can be explained if the TDE is due
to the secondary in a SMBH binary system. Still, the nature of this TDE
candidate is disputable; Godoy-Rivera et al. (2017) argue that the evolution
of ASASSN-15lh’s photospheric radius, its radiated energy, and the implied
event rate are all more consistent with those of H-poor superluminous SNe
than TDEs.
2.3 PS16dtm
The transient PS16dtm, discovered in a Narrow Line Seyfert 1 (NLSy1) galaxy,
was interpreted as a TDE rather than as a SN or arising from intrinsic AGN
variability (Blanchard et al. 2017). The light curve exhibits no colour evolution
during the ∼100 day plateau, similar to other optical TDEs (see van Velzen et
al. 2021, Optical Chapter). The optical spectrum has traits similar to NLSy1s,
with Balmer and multi-component FeII emission lines, further arguing against
a SN interpretation. Blanchard et al. (2017) rule out AGN variability, given the
two orders-of-magnitude increase in optical/UV flux within ∼50 days and the
decrease in X-ray flux after the optical/UV flare; they ascribe this behaviour
to obscuration of the pre-existing AGN X-ray corona by the stellar debris
disk formed by the disrupted star. The rise in the light curve is followed by a
plateau at roughly the Eddingtion luminosity inferred for the SMBH and then
a decline.
While this source is a strong TDE candidate, its spectrum, which is AGN-
like, is very different than those of many optical TDEs (see van Velzen et al.
2021, Optical Chapter). Indeed, Moriya et al. (2017) point out that PS16dtm’s
flare can be explained by AGN activity: increases in the accretion disk lumi-
nosity can spur radiatively driven winds that cause shock waves to propagate
within the BLR. Interactions between the shocks and BLR clouds can convert
kinetic energy of the ejecta into radiation, producing transient luminosities
and timescales that match those observed in PS16dtm.
2.4 AT2018fyk
AT2018fyk is a TDE candidate with a photometric UV/optical evolution re-
markably similar to ASASSN–15lh, i.e., with a secondary maximum in its
light curve. Margutti et al. (2017) ascribe the second peak in ASASSN–15lh’s
light curve to temporal evolution in the opacity of the ejecta, which allows
UV radiation to escape and produce the secondary maximum. They point out
that the observations are consistent with a spinning black hole disrupting a
main-sequence star as a trigger for the ASASSN-15lh flare. Despite the simi-
larities in light curve evolution, the timescales for AT2018fyk are significantlyUnusual and Impostor TDEs 5
shorter than for ASASSN–15lh, and high amplitude, erratic X-ray variability
is observed for AT2018fyk from the early phases.
AT2018fyk’s optical-to-X-ray luminosity ratio (Lopt /LX ) evolves like that
of ASASSN–15oi, suggesting that similar physical processes are at play. Wev-
ers et al. (2019) argue that both the Lopt /LX evolution and the secondary
maximum in the UV/optical light curve can be explained as a tidal disruption
with a relativistic pericenter, as Leloudas et al. (2016) suggested led to the
double-humped light curve in ASASSN–15lh. A relativistic pericenter favours
disk formation on short (∼ months) timescales, compared with the typical
timescale of ∼years (van Velzen et al. 2019). Gezari et al. (2017) note that the
formation of an accretion disk on similarly short timescales may explain the
peculiar Lopt /LX observed in ASASSN–15oi.
Another peculiarity of AT2018fyk is the apparent decoupling of the X-
ray from the UV/optical emission, about 80 days after peak. This is reminis-
cent of the late time X-ray detection in ASASSN–15lh, while the UV/optical
lightcurve steadily declines. Margutti et al. (2017) postulate that in ASASSN–
15lh, the X-ray emission may not in fact be related to the transient and may
arise instead from the host galaxy nucleus, which would favour an interpre-
tation that the flare was caused by a stellar explosion rather than a TDE.
Should the X-ray emission be due to a TDE from a massive spinning black
hole, the X-ray emission would fade over time. A similar observational test
can be brought to bear on AT2018fyk by monitoring its X-ray emission over
the time span of years.
In the optical spectra of AT2018fyk, Wevers et al. (2019) detect low ion-
isation potential Fe ii emission lines like those identified in ASASSN–15oi at
late times. These lines are thought to form in dense, optically thick gas in
an accretion disk-like structure, favouring the rapid disk formation scenario.
These lines are observed frequently in high accretion rate NLSy1s, suggesting
that the physical conditions in some TDEs and AGN are similar. Arguments
against the AGN interpretation for this event include the absence of galac-
tic (narrow or broad) emission lines, a pre-flare X-ray non-detection, and IR
colours consistent with a quiescent galaxy.
2.5 Summary
There is not one selection mechanism that can be used to distinguish among
potential explanations for transient events. Classification instead relies on the
preponderance of evidence and may still not be definitive (e.g., ASASSN-15lh).
Some transient phenomena have characteristics of both SNe and TDEs (e.g.,
PS1-11af), AGN and TDEs (e.g., AT2018fyk), or are hosted in known active
galaxies (e.g., PS16dtm), requiring care in distinguishing among flares in a pre-
existing accretion disk within the high variability tail of the AGN population,
the tidal disruption of a star in the vicinity of an already active black hole, or
a supernova in the centre of a galaxy.6 Zabludoff et al.
The next several sections discuss how we might differentiate TDEs from
the signatures of AGN (and strongly flaring AGN), SNe, GRBs, and other
potential impostors, based on photometric and spectroscopic clues as well as
statistical arguments.
3 Distinguishing TDEs from AGN
Dozens of TDEs are now claimed to have been detected. The uncertainty in
this number reflects the inhomogeneity of TDE definitions, incompleteness in
the TDE observables, and the lack of a unifying theoretical framework. TDEs
should differ from AGN in the details of their accretion, i.e., the disruption
of a single star leading to the quick, inside-out formation of a small, initially
inclined disk (or flow) that then disappears on a shorter timescale than typical
of the more continuous nature of AGN accretion.
Yet there is much we do not know about AGN variability, particularly
about the extremes of continuous variability and about instabilities in the
accretion disk that may produce transient flaring. The discovery of new vari-
able AGN classes such as hyper-variable and “changing-look” AGN, which
show dramatic weakening and/or strengthening in their broad Balmer emis-
sion lines, complicates efforts to identify TDEs unambiguously. Even long-term
AGN variability may be a problem; the relevant timescales for TDEs with
evolved stellar progenitors (which are not the main focus here) could be far
longer than for main sequence stars. Much theoretical work remains to predict
TDE observational signatures and to ascertain which, if any, are unique to
TDEs.
In the following discussions, we consider what may distinguish TDEs from
continuously accreting AGN, including those that are highly variable, and,
more problematically, from the flaring caused by AGN disk instabilities. An
even bigger challenge is presented by a new class of events—combining TDE-
and AGN-like observables—that may arise when a TDE occurs in a pre-
existing AGN (e.g., Merloni et al. 2015; Chan et al. 2019; Ricci et al. 2020).
In §3.2.2, we briefly discuss the few such objects detected to date, reflecting
our limited knowledge at the time of this writing.
The guidelines presented below tend to err on the conservative side: we are
more interested here in purity than completeness in TDE classification. As a
result, TDEs that occur in galaxies with even mild signs of nuclear activity,
e.g., Seyfert-like emission line ratios, otherwise strong [O iii] λ5007 emission,
or persistent archival X-ray emission, would be excluded by our criteria. Yet
counting hybrid systems will be critical in building complete and unbiased
TDE samples.
3.1 TDEs versus Continuous AGN
The obvious difference between TDEs and steady-state AGN is that TDEs are
fundamentally transient phenomena, transitioning from quiescence to near-Unusual and Impostor TDEs 7
Eddington luminosities in a few weeks, and then back to quiescence within
a few years to even decades (Rees 1988; Stone et al. 2013; van Velzen et al.
2019). This opens the possibility of monitoring several state transitions in the
accretion flow, which goes from near- (or super-) Eddington to sub-Eddington
and eventually becomes radiatively inefficient at low accretion rates (Jonker
et al. 2020). Long term monitoring of TDEs should be pursued to reveal the
details of such state transitions.
Debris disks from the tidal disruption of main sequence stars are very com-
pact, as the star is disrupted near the SMBH with low angular momentum. If
the stellar debris circularises efficiently, the size of the compact disk formed is
twice the tidal disruption radius, or ∼ 10 − 100Rg where Rg = GMBH /c2 . In
contrast, AGN disks are expected to be much more extended, as gas is sup-
plied from farther distances (e.g., Alexander and Hickox 2012, and references
therein).
Another difference between TDE and stable AGN is that TDE disks may
be fed at super-Eddington rates, while (low-redshift) AGN are usually con-
sidered to be accreting at sub-Eddington levels. As a result, TDEs and these
AGN would have different disk structures, i.e., the super-Eddington TDE disks
would be geometrically and optically thick and produce optically thick winds
(Strubbe and Quataert 2009; Lodato and Rossi 2011; Dai et al. 2018). As the
accretion rate drops with fallback rate, the disk and wind densities will also de-
crease, lowering the electron scattering opacity. This behaviour can explain the
narrowing of the TDE hydrogen and He ii λ4686 emission lines with decreas-
ing luminosity described below, as the line width in a scattering dominated
medium scales with the opacity (Roth and Kasen 2018). The higher He ii/Hα
ratio observed in TDEs (also discussed below) can arise from the higher accre-
tion levels and inner disk temperatures compared to AGN, although detailed
modelling on using this ratio to directly probe the disk structure is still lacking.
The absence of hard X-ray emission in the TDEs observed so far, com-
pared with the X-ray power-law spectrum with Γ ∼ 1.9 common to AGN (as
discussed below), suggests fundamental differences in the disk corona. Possible
explanations include: 1) the typical duration of AGN accretion is much longer
than a TDE lasts, so the corona forms only for AGN; 2) the magnetic field
strength and configuration is different in TDEs than in AGN, leading to less
efficient coronal production.
3.1.1 Summary of Observable Distinctions
Some continuously accreting, but variable, AGN may be identified as new,
blue, and/or X-ray detected nuclear transients and thus misclassified as TDE
candidates. Consequently, it is essential that we consider the breadth of known
AGN properties—light curves, colors, spectral shapes and lines, and variabil-
ity, across optical, UV, and X-ray wavelengths—in defining criteria that may
distinguish TDEs. In what follows, we discuss possible criteria and demon-
strate how they may be used to assess the data for the two best-studied TDE
candidates, ASASSN-14li and ASASSN-15oi. Given that strongly flaring AGN8 Zabludoff et al.
may have properties distinct from the continuous AGN population, posing a
different and perhaps greater challenge to TDE classification, we discuss other
appropriate strategies in 3.2.
Features that may favour a TDE over other AGN activity include:
1. steeper (month-long) and brighter (change of several magnitudes) rise in
optical/UV flux;
2. relatively narrow luminosity peak, with characteristic timescale of months;
3. smooth, power-law decline in light curve, sometimes following a t−5/3 trend;
4. ∼0.2 mag bluer in g-r around peak emission;
5. hot, constant T ∼ 2-4 × 10⁴ K blackbody in optical/UV emission;
6. absent to weak [O iii] λ5007 emission, and narrow emission line ratios sug-
gestive of star formation rather than AGN photoionisation;
7. very broad (>15,000 km s−1 ) He ii λ4686 and Balmer optical emission lines
that narrow as they weaken;
8. luminous He ii λ4686 line emission, with He ii/Hα flux ratio & 1;
9. weak, or even absent, Mg ii λ2800 line emission;
10. softer X-ray spectrum, in terms of photon index (Γ ≥ 3) and/or promi-
nence of low-temperature emission component (kTbb = 0.04–0.12 keV; see
the Saxton et al. 2021, X-ray Chapter)
11. less rapid (> hours) X-ray variability;
12. no recurrence of transient behaviour1 .
No TDE candidate observed to date has been shown to possess all these
features. Indeed, depending on the conditions, some TDEs may not generate
certain features. Those TDEs with the most features above, e.g., ASASSN-14li
and ASASSN-15oi, are considered the strongest TDE candidates. We discuss
these two events in light of the list given above, before addressing each of the
listed features in more detail.
ASASSN-14li:
Here is how the optical, UV, and X-ray observations of ASASSN-14li map to
the criteria listed above. 1) It displayed a ∆UVW2 (Swift) of -4.1 and a ∆g
of only -0.4, where these variations in magnitudes were measured with respect
to the host galaxy pre-flare archival measurements (Holoien et al. 2016b); 2)
The peak of this event was not observed; 3) The UV/optical decline over the
first six months of monitoring was initially fit with an exponential (Holoien
et al. 2016b), but this emission was later fit with a t−5/3 decline over a longer
time interval of approximately 250 days. After this, the UV/optical light curve
levelled off to a more shallow decline (Brown et al. 2017); 4) The g − r colour
was roughly 0.4 mag during early monitoring, but was highly affected by host
contamination. The event was still quite blue, with UVM2 brighter than U
(Swift) by a difference exceeding 0.5 mag, for at least the first 100 days of
1 One possible exception is if a TDE occurs in a binary SMBH. In this case, the TDE
may be perceived as recurring transient behaviour when the X-ray light dims due to the
interaction with the second SMBH.Unusual and Impostor TDEs 9
monitoring (Holoien et al. 2016a); 5) The optical/UV continuum can be fit
with a blackbody with T ≈ 3.5×10⁴ K, and this temperature remained almost
unchanged for the first 175 days of monitoring (Hung et al. 2017).
Furthermore, 6) optical spectra indicate [O iii] λ5007/Hβ
1 (Holoien
et al. 2016b, and see also Figure 2 in this chapter); 7) The optical emission
lines initially showed broad wings with widths of ∼ 10, 000 km s−1 , although
these widths narrowed significantly, with only a narrow component of width
∼ 1500 km s−1 after 100 days (Holoien et al. 2016b). The optical emission lines
in the later spectra from this event are among the narrowest seen in TDEs;
8) While He ii/Hα varies, this ratio was > 1 for several epochs and generally
exceeded 0.5 (Hung et al. 2017); 9) No Mg ii λ2800 emission was seen in UV
spectroscopy (Cenko et al. 2016).
Lastly, 10) the X-ray spectrum was soft and could be fit with a kT = 51
eV blackbody (Miller et al. 2015); 11) X-ray variability was detected in this
event: a stable quasi-periodic oscillation of roughly 131 seconds was identified
(Pasham et al. 2019); 12) No recurrence has been observed.
In summary, 14li meets most of the criteria for distinguishing a TDE from
other AGN activity. The most prominent exceptions are for criteria 4 and 11:
the earliest (closest to peak) g − r measurement was only 0.2 (but this might
be due to host contamination), and the event exhibited rapid X-ray variability
in the form of a QPO. Additionally, since the peak was not observed, it is not
possible to assess whether the characteristic rise and fall timescales are on the
order of months (criterion 2). Finally, optical emission lines were somewhat
narrow compared to other putative TDEs (criterion 7), although these lines
did narrow over time in a manner that seems characteristic of TDEs.
ASASSN-15oi:
Next, we consider ASASSN-15oi. 1) It displayed a ∆UVW2 (Swift) of -6.8 and
a ∆V of only -1.2 (Holoien et al. 2016a), where once again these variations in
magnitudes were measured with respect to the host galaxy pre-flare archival
measurements; 2) The peak of this event was not observed; 3) A UV/optical
decline similar to t−5/3 could be fit to the first 100 days of observation, before
the flux at these wavelengths dropped precipitously. While the flux initially
declined steadily in all bands, the inferred bolometric flux (from a thermal fit
to the optical/UV data) remained steady for approximately the first 50 days
before entering a decline (Holoien et al. 2018). As with ASASSN-14li, the initial
UV/optical decline could alternatively be fit with an exponential (Holoien et al.
2016a); 4) The g-r measurement was not published, but UVM2 was brighter
than U (Swift) by at least 1.0 mag during the first 50 days of monitoring
(10 - 60 days post-discovery) and by at least 0.5 mag for 40 days after that
(Holoien et al. 2016a). 5) During roughly the first 15 days of monitoring, the
optical/UV continuum could be fit with a blackbody of roughly T ∼ 2 × 10⁴
K. The inferred temperature increased to about 4 × 10⁴ K over the next 15
days and stayed at that temperature for at least the next 70 days (Hung et al.
2017).10 Zabludoff et al.
In addition, 6) the [O iii] lines do not appear prominently in the spectra,
although there is an unidentified broad feature near 5000 Å, which can be seen
at 21 days post-discovery in the host-subtracted spectrum. Likewise, Hβ does
not appear prominently, although it may be blended with He ii in the earliest
spectrum (Holoien et al. 2016a, and see also Figure 2 in this chapter). 7) The
He ii λ4686 emission line had a width (FWHM) of roughly 20,000 km s−1 in a
spectrum taken seven days after discovery, which narrowed to approximately
10,000 km s−1 at 21 days (Holoien et al. 2016a). 8) While He ii appears promi-
nently in the spectrum, no clear detection of any hydrogen lines can be made
(Holoien et al. 2016a); 9) No Mg ii emission was seen in UV spectra (Alexander
Dittmann et al., in prep.).
Finally, 10) the X-ray spectra were soft and could be fit with blackbodies
with kT ∼ 40 − 50 eV; 11) No rapid X-ray variability has been reported; 12)
No recurrence has been observed.
In summary, 15oi meets nearly all the aforementioned criteria to distinguish
a TDE from other AGN activity, except for those specific to the peak of the
light curve (criteria 2 and 4), which was not captured for this event.
3.1.2 UV to Optical Light Curve
The light curves of TDE candidates are characterised by a dramatic increase
in optical and UV luminosity, with an observed variability of over three mag-
nitudes (e.g., van Velzen et al. 2011), a narrow luminosity peak spanning a
timescale of months (e.g., Gezari et al. 2009; Guillochon and Ramirez-Ruiz
2013), and a smooth power-law decline, which sometimes follows t−5/3 , the
predicted mass fall-back rate (Rees 1988; Phinney 1989b).
In comparison, the light curves of variable AGN are dominated by more
stochastic variability that lacks such dramatic increases in brightness. On
timescales of months, the variability of the continuous AGN population rarely
exceeds 0.1 mag (Fig. 1; see, e.g., Vanden Berk et al. 2004; MacLeod et al.
2010; van Velzen et al. 2011; MacLeod et al. 2012; Caplar et al. 2017, and
references therein). Although this typical AGN optical variability amplitude
increases towards longer timescales, it does not exceed ∆mag ∼ 1, even over
decades. Indeed, only the most extreme tail of AGN variability distribution,
with few sources in wide-field surveys, reaches ∆mag ∼ 2 (top panels of Fig. 1;
see, e.g., MacLeod et al. 2012; Graham et al. 2017; Rumbaugh et al. 2018).
Likewise, AGN typically do not show smooth and steady variability structure,
such as the power-law decline seen in TDEs.
Some observed changing-look AGN stay at their peak optical luminosity
for years (e.g., Runnoe et al. 2016). While there are TDE candidates detected
in X-rays over a similar timescale (Lin et al. 2017; Jonker et al. 2020), the
optical flare fades much more quickly. Furthermore, although the decays in
some changing-look AGN light curves approximate a t−5/3 decline (e.g., Mer-
loni et al. 2015; Trakhtenbrot et al. 2019a) or permit a t−5/3 solution (e.g.,
Runnoe et al. 2016), perhaps suggesting triggering by TDEs, many of these
extremely variable AGN wane differently (Ruan et al. 2016) and/or lack theUnusual and Impostor TDEs 11
smooth decline expected from the fallback of debris from a TDE (Gezari et al.
2017).
The evolution of optical colours can also be used as a selection criterion for
TDEs in ground-based optical surveys. Optically-discovered TDEs are char-
acterised by a long-lasting blue continuum that resembles a blackbody of a
few ×104 K. Unlike SNe, which typically undergo significant colour evolution
over a few weeks, TDEs and AGN can keep a constant colour for a longer
period of time (∼years). The g-r colour of TDEs at peak emission (< −0.2
mag) is typically bluer than for AGN (> −0.1 mag; Fig 12 in van Velzen et al.
2011). The observed bluer-when-brighter trend for AGN is consistent with the
simple scenario of a geometrically-thin, optically-thick (i.e., Shakura-Sunyaev
like) disk with variable accretion rates (e.g., Pereyra et al. 2006; Hung et al.
2016). If the observed AGN flare is an intrinsic property of the accretion disk,
the classic thin disk model would predict a g-r of ∼ −0.1 mag. Although in-
trinsic extinction in AGN is hard to estimate, it will only make the g-r colour
in AGN flares redder than the predicted value, separating them further from
TDEs in the optical colour space.
3.1.3 Optical Spectrum
A few key features in the optical spectra of TDE candidates can be used
to differentiate them from persistent AGN. Vanden Berk et al. (2001) and
the references therein provide more information about the typical UV/optical
spectral energy distribution (SED) and emission lines in AGN. For comple-
mentary composite spectra in the NIR and UV, see Glikman et al. (2006) and
Shull et al. (2012), respectively.
Hot, Constant Blackbody Continuum:
The continuum colour variability also differs between AGN and TDEs. Quasars
are known to be bluer when brighter (e.g., MacLeod et al. 2010; Ruan et al.
2014). Although there is substantial scatter in this relationship, it provides
additional leverage in identifying TDEs where no colour evolution is observed
due to the constant black body temperature that produces the optical/UV
continuum emission.
Weak [O iii] Line:
The AGN narrow line region (NLR) is primarily ionised by the accreting black
hole, and can span scales of order ∼ 0.1-1 kpc, with some dependence on the
AGN continuum luminosity (e.g., Bennert et al. 2002, 2006; Mor et al. 2009;
Hainline et al. 2013, 2014). The [O iii] λ5007 emission line is one of the most
prominent in the NLR and has been used both to map out the size of the
NLR (e.g., Schmitt et al. 2003b,a) and as a proxy of the intrinsic (bolometric)
AGN luminosity (Kauffmann et al. 2003; Heckman et al. 2005; LaMassa et al.
2010; Pennell et al. 2017). Due to the much larger size scale of the [O iii] λ5007
emitting region (and thus of the NLR) compared with the broad line region12 Zabludoff et al. Fig. 1: Optical variability of normal, persistent (non-flaring) AGN. Top-Left: Distribution of UV/optical flux variations of quasars in the SDSS+POSS study of MacLeod et al. (2012). In each panel, different solid lines trace quasar variability on timescales spanning 1-30 days, 50-150 days, 200-400 days, and 1400-3000 days—the former being relevant to the rise-time of most TDEs. Top- Right: Distribution of optical flux variations in DES+SDSS broad-line AGN, over a period of ∼15 years (adopted from Rumbaugh et al. 2018). The cumu- lative distribution function (red line) indicates that only ∼10% of AGN show |∆mag| > 1 over this long period and are claimed to be highly variable on all timescales. Bottom: AGN variability on multiple timescales described through a structure function (SF), a measure of the rms variability of an AGN sample over any given time separation. This example (again from MacLeod et al. 2012) shows SDSS measurements over several years (red points) and combines them with POSS data for the longer-timescale measurements (large symbols). The different lines are phenomenological fits to the data. On timescales of months, AGN typically vary by < 0.1 mag, while TDEs show up as & 1 mag transients (i.e., corresponding to SF & 1 mag over < 100 days). Thus, normal, persistent (non-flaring) AGN essentially never show the month-long sharp optical flux increase seen in TDEs.
Unusual and Impostor TDEs                                                     13

(BLR), this line responds slower to the change in the ionising continuum than
the broad emission lines (i.e.,  100 years; see, e.g., Peterson et al. 2013).
    TDEs tend to have weak to no [O iii] λ5007 emission, with [O iii]/Hβ and
[N ii]/Hα emission line ratios consistent with photoionisation from star forma-
tion or LINER-like activity on the BPT (Baldwin et al. 1981; Kewley et al.
2006) diagram. Even TDE hosts with Seyfert-like line ratios, e.g., ASASSN-
14ae (French et al. 2017), ASASSN-14li (French et al. 2017), and iPTF16fnl
(Onori et al. 2019), generally have weak line strengths that would classify them
as LINER-like on a WHAN (Cid Fernandes et al. 2010) diagram. We explore
the range of AGN signatures in TDE host galaxies in the French et al. 2021,
Host Galaxies Chapter.
    On the other hand, galaxies with significant nuclear photometric and spec-
troscopic variability and strong [O iii] emission are more likely to be host-
ing highly variable AGN, especially if the emission line ratios are within the
Seyfert region of the BPT diagram. The emission line ratios of many changing-
look AGN are generally consistent with those of AGN (e.g., Runnoe et al.
2016; Ruan et al. 2016). Thus, our guideline 6 in §3.1.1 would exclude most
strong AGN and most changing-look AGN. We note that, while some lumi-
nous quasars have relatively weak [O iii] emission (e.g., Netzer et al. 2004),
their UV/optical continuum luminosities tend to be far higher than those of
TDEs and could be used as a discriminant.
    What do we miss with this conservative cut, where we have prioritised TDE
sample purity over completeness by selecting against strong [O iii] emission?
We would neglect, for example, the TDE candidate PS16dtm (Blanchard et al.
2017), whose host is a NLSy1. Also excluded would be transients in the 2017-
bgt class (Trakhtenbrot et al. 2019b; see below), whose nature is unclear. The
presence of some activity in a galaxy does not eliminate a priori the possibility
of a TDE, although caution should be used in such cases.

Broad, Narrowing Balmer and He ii Lines:
The emission line velocity widths and their time-dependent changes provide
another way of distinguishing between AGN and TDEs. Near peak, the typical
Hα and He ii λ4686 FWHM of TDEs are both of order 104 km s−1 and often
exceed 15, 000 km s−1 (Figure 2). Only a fraction of a percent of the Hα and
Hβ lines in SDSS AGN (which may have problematic spectral decompositions)
are as broad as in TDEs, i.e., & 15, 000 (Figure 3). This distinction may arise
from the structure and dynamics of the BLR around SMBHs with certain
masses (Laor 2003). Thus, line width is a reasonably good discriminator, but,
depending on the overlap in the distributions for TDEs and AGN, may not be
iron-clad.
    Whenever AGN spectra do have noticeable He ii λ4686 emission, the line
profiles and widths are generally comparable to those of Hβ (and thus also
Hα). While accurate measurements for individual AGN are often challenging,
given the weakness of the He ii feature and the fact that it is blended with
several [Fe ii] emission features, the resemblance between He ii and Hβ can be
seen in stacked spectra (e.g., Fig. 3 of Boroson 2002).
14 Zabludoff et al.
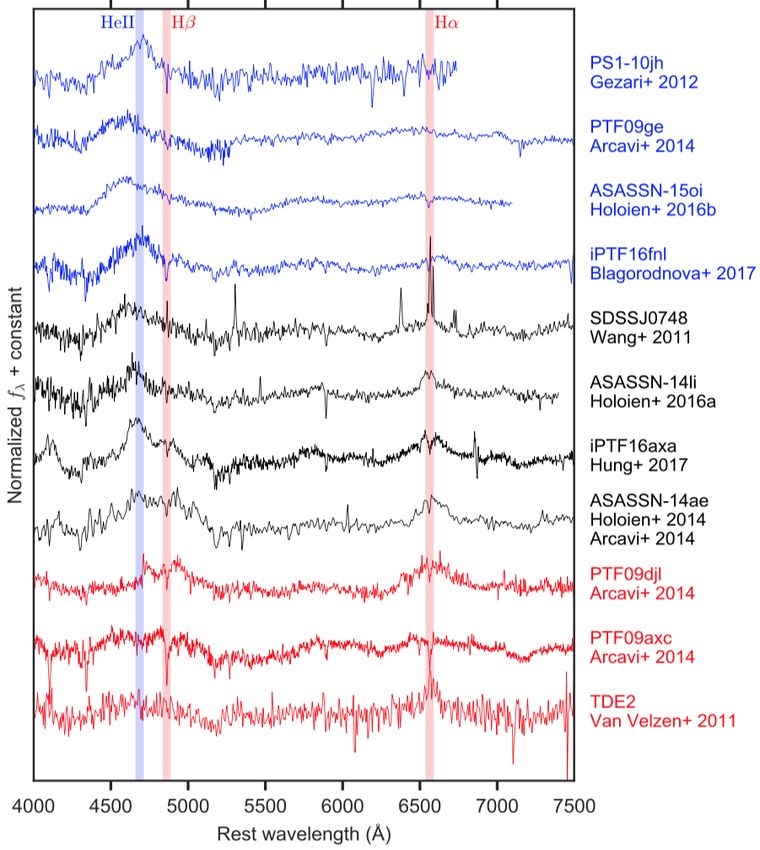
Fig. 2: Continuum-subtracted optical spectra of UV/optical-bright TDEs,
most of which show He ii line emission of comparable luminosity and FWHM
to Hα.
The temporal evolution of the velocity line widths in response to changes
in the photoionising continuum provides an even better way of distinguish-
ing between TDEs and AGN. In changing-look quasars, which are likely to
contaminate TDE searches, the broad emission lines broaden as they weaken
(LaMassa et al. 2015; Runnoe et al. 2016). This is the basis for reverberation
mapping in AGN (e.g., Peterson 1993) and the opposite of what is observed
for TDEs (Holoien et al. 2016b).
High He ii/Hα Ratio:
The spectra of many UV/optical-bright TDEs have prominent He ii λ4686 lineUnusual and Impostor TDEs 15
1.0 1.0
0.8 0.8
0.6 0.6
N
N
0.4 0.4
0.2 0.2
0.0 0.0
10 20 30 40 10 20 30
FWHM Hα [103 km s−1] FWHM Hβ [103 km s−1]
Fig. 3: The FWHM distributions for the Hα and Hβ broad emission lines in
SDSS DR7 quasars, taken from the spectral decompositions of Shen et al.
(2011). Only a small fraction of sources have Balmer lines that are broader
than ∼ 15, 000 km s−1 . Given that such extremely broad Balmer lines are
often seen in TDEs, Balmer line width can serve as a discriminant between
TDE candidates and persistent AGN.
emission. The line luminosity is typically of order 1041 erg s−1 at its brightest,
much stronger than Hβ and comparable to (or even stronger than) Hα (Fig-
ure 2). Therefore, a He ii/Hα flux ratio & 1 in at least one spectral epoch is a
hallmark of UV/optical-bright TDE candidates, as is He ii/Hβ ∼ 1.
There are potential exceptions. One possible case is TDE2 (van Velzen
et al. 2011, the bottom spectrum in Figure 2), but its spectrum is low signal-
to-noise. Another is PS1-11af (Chornock et al. 2014), although that event
showed no emission lines at all in its spectrum. Because the He ii/Hα flux
ratio is observed to evolve with time, we note that a single spectral epoch may
miss the He ii line if it appears at a different time (Figure 4).
In comparison, while AGN spectra do exhibit broad He ii λ4686 emission,
it is typically weak compared to the Balmer lines. The He ii/Hα flux ratio
in the SDSS quasar composite is ∼ 0.005 (Vanden Berk et al. 2001). From
the theoretical side, photoionisation modelling of the BLR in AGN also gives
He ii/Hα < 1, although the goal of such work is usually to reproduce normal
AGN spectra and not extreme outliers.
Like other high-ionisation species and transitions, He ii comes from closer
to the central engine than the Balmer lines (e.g., Grier et al. 2013) and is
extremely responsive to continuum changes in the AGN (as in Korista and
Goad 2004), whereas Hα is the least responsive of the Balmer lines. Thus,
with a large (UV) flare in the AGN continuum (even if the SED shape does
not change), it may be possible to boost the He ii/Hα ratio temporarily. That
said, while Peterson and Ferland (1986) describe a (moderate) flare in the AGN16 Zabludoff et al. Fig. 4: The variation in the He ii/Hα flux ratio over time for a collection of TDEs. Observing this flux ratio & 1 in at least one spectral epoch distinguishes optical/UV TDE candidates from most AGN. However, the ratio evolves with time, and so a single spectral epoch may miss the He ii line if it appears at a different time. Figure reproduced from Hung et al. (2017). reverberation-mapping poster child, NGC 5548, that substantially boosts the He ii emission, it is always weaker than Hβ. As a caveat to the above, we must mention the measurement of the flux of the He ii λ4686 line can be affected by blending with the N iii λ4640 line which can be excited by Bowen fluorescence (e.g., Leloudas et al. 2019; Onori et al. 2019; Nicholl et al. 2020). Medium resolution spectroscopy may be helpful in deblending these two components. 3.1.4 UV Spectrum The UV spectra collected of TDEs so far (Figure 5) have revealed striking differences with respect to other AGN, although the sample is currently small. As of this writing, there are only two TDE in quiescent galaxies with published UV spectra: iPTF15af (Blagorodnova et al. 2019) and AT2018zr (Hung et al. 2019), also known as PS18kh (Holoien et al. 2019). There is at least one more event with an unpublished UV spectrum, ASASSN-15oi (Alexander Dittmann et al., in prep.). Additionally, there is a near UV spectrum of PS16dtm (Blan- chard et al. 2017), but, because that event took place in a narrow-line Seyfert I, we exclude it for the present purpose of distinguishing TDE from AGN. ASASSN-14li (Cenko et al. 2016) and iPTF16fnl (Brown et al. 2018) also have published UV spectra, but are not in quiescent host galaxies.
Unusual and Impostor TDEs                                                    17

Fig. 5: Ultraviolet spectra from four TDEs, including two epochs for AT2018zr,
compared to a low-ionisation broad absorption line QSO (LoBALQSO) com-
posite spectrum. At least three of the TDE spectra lack Mg ii λλ 2796, 2804
emission. This figure appears in Hung et al. (2019) and is reproduced here
with the permission of the American Astronomical Society.

    These systems generally lack certain low-ionisation emission lines that are
common in most AGN, in particular Mg ii λλ 2796, 2804. The exception is
AT2018zr, which displayed a broad emission feature consistent with Mg ii in
five spectra taken between roughly 20 to 60 days after r-band peak. However,
the equivalent width of Mg ii dropped steadily in time, and, by the final spec-
trum, the line had all but disappeared, while an absorption feature appeared
at a blueshifted velocity consistent with the velocity (15,500 km s−1 ) inferred
from the Balmer lines in the optical spectrum (Hung et al. 2019). This rapid
spectral variability distinguishes the event from most AGN in its own right.
    Equally interesting is the general absence of C iii] λ 1909 emission in the
TDEs, a line seen in most AGN UV spectra. Adding to the differences is the
general strength of N iii] λ 1750 emission, a line which shows up prominently in
only approximately 1% of SDSS AGN. Here again AT2018zr is an exception,
but only in the sense that its N iii does not show up clearly in emission,
although it may be contributing to absorption at that wavelength. While the
rare, so-called “N-rich QSOs” do have have this emission line, they generally
also have a strong C iii] line accompanying it, as well as Mg ii , which is not
the case for TDEs (Jiang et al. 2008; Cenko et al. 2016).
18 Zabludoff et al.
There are broad absorption features in some UV TDE spectra, although
these too distinguish themselves from broad absorption line quasars (BALQSO).
TDEs with clear or tentative absorption include iPTF16fnl, iPTF15af, and
AT2018zr (PS18kh). In these cases, the absorption seems to correspond to the
C iv λλ1548,1551, Si iv λλ1394, 1403, and N v λλ 1239,1243 lines.
The FWHM of these lines is roughly in the range 5000-10,000 km s−1 , quite
similar to BALQSOs. However, in iPTF16fnl and iPTF15af, the centroid of
the absorption lines is near enough to the line centre so that the absorption
represents velocities from nearly 0 to 10,000 km s−1 , blending smoothly into
the emission on the red side. In contrast, the centroid of the absorption lines
in BALQSOs is often blueshifted by at least 10,000 km s−1 , and so the ab-
sorption is completely detached from the emission, with a broader wing on
the higher velocity side (Blagorodnova et al. 2019). AT 2018zr (PS 18kh)
once again displays its own unique behaviour, with possible broad absorption
centroid velocities of 15000 km s−1 ; these absorption lines were also highly
variable, becoming increasingly prominent with time in the five spectra taken
over approximately 40 days.
Of the TDEs with published UV spectra in quiescent hosts, both exhibit
broad absorption lines at some point in time. This fraction is higher than
that of BALQSOs. Blueshifted BALs in QSOs are thought to arise from fast-
moving outflows. If the QSO/BALQSO dichotomy is largely due to viewing
angle effects, then outflows in TDEs may subtend a larger solid angle than in
AGN (Hung et al. 2019).
3.1.5 X-ray Spectrum
AGN activity could potentially mimic the X-ray emission arising from TDEs.
In this section, we compare observations of X-ray emission from AGN and
TDE candidates, focusing on those that might help us distinguish between
the two types of sources. The Saxton et al. 2021, X-ray Chapter has more
information on the X-ray properties of TDEs.
Thanks to its high-sensitivity and good sky coverage, the ROSAT X-ray
Observatory (Truemper 1982) discovered the first TDE candidates. These nu-
clear transients had a peak X-ray luminosity of Lx ∼ 1044 erg s−1 , were
associated with galaxies that showed no evidence of (prior) AGN emission,
produced light curves that decayed following a t−5/3 power-law, and had X-
ray spectra that were best described with a ∼ 105−6 K blackbody or with a
very steep power-law index (Γ = 3-7, Figure 6; Grupe et al. 1995; Brandt et al.
1995; Bade et al. 1996; Komossa and Bade 1999; Grupe et al. 1999; Greiner
et al. 2000). Since ROSAT, the capabilities of the Neil Gehrels Swift Gamma-
ray Burst Mission, the Chandra X-ray Observatory, and XMM-Newton Space
Observatory, including increased effective area, spectral coverage, spatial reso-
lution, and/or spectral resolution, have dramatically changed our ability to
characterise the detailed spectral evolution of TDE candidates, leading toUnusual and Impostor TDEs 19
1.0
0.8
0.6
CDF
0.4
0.2
■ AGN
■ X-ray TDE
■ Likely X-ray TDE
0.0
-2 0 2 4 6 8 10 12
Powerlaw Index (Γ)
Fig. 6: Comparison of power-law photon index Γ for the X-ray spectra of AGN
and TDEs. Left: Distribution of photon indices of ∼ 2500 AGN observed with
XMM-Newton. The AGN have non-thermal spectra with power law photon
indices ranging from 1.7–2.4. Figure adapted from Liu et al. (2016). Right:
Cumulative Γ distributions for events classified as X-ray TDEs (cyan curves)
or likely X-ray TDEs (orange) by Auchettl et al. (2017) compared with AGN
detected in the Chandra Deep Field South (magenta; Tozzi et al. 2006; Xue
et al. 2011). Both TDE distributions from Auchettl et al. (2017) include jetted
TDE candidates, which tend to have harder X-ray spectra than thermal TDEs
and photon indices more like AGN. Observing a nuclear transient with steeper
(softer) X-ray SED (Γ & 3) may strongly favour a TDE interpretation.
discoveries including rapid variability and, in Swift J1644+572 , possible jet
formation (Bloom et al. 2011; Burrows et al. 2011).
AGN and TDEs are quite different in the nature and appearance of their
broad-band X-ray spectra. In AGN, around 10% of the bolometric luminosity
is released as non-thermal X-ray continuum up to ∼100 keV, as magnetic
processes in and/or above the disk form a relativistic electron cloud that is
partly cooled due to the inverse Comptonization of the thermal disk photons.
In the 2-10 keV band, this continuum is typically modelled as a simple power-
law, whose index is determined by the temperature distribution of the electrons
and by the number of electrons that each UV seed photon encounters. In AGN,
the average 2–10 keV spectral index is 1.9, with a spread from ∼1.7 to 2.4 at
the most extreme (Figure 6; Liu et al. 2016).
In contrast, most thermal TDEs show X-ray emission that is dominated
by a multicolor blackbody component with a temperature of 50-100 eV, e.g.,
ASASSN-14li (Miller et al. 2015; Holoien et al. 2016b; Brown et al. 2017).
In some cases, there is an additional weak hard X-ray tail, e.g., ASASSN-
14li (Kara et al. 2018) and XMMSL1 J074008.2-853927 (Saxton et al. 2017).
2 See the Zauderer et al. 2021, Gamma-ray Chapter.20 Zabludoff et al.
1.0
0.8
0.6
CDF
0.4
0.2
■ AGN
■ X-ray TDE
■ Likely X-ray TDE
0.0
19 20 21 22 23 24 25
Log10(NH [cm-2])
Fig. 7: Cumulative distribution function of line-of-sight hydrogen column den-
sity (NH ) for TDEs classified as a X-ray TDEs (cyan curves) or likely X-ray
TDEs (orange) by Auchettl et al. (2017). These TDEs are significantly less
absorbed compared to AGN found at similar redshifts in the Chandra Deep
Field South (magenta; Tozzi et al. 2006; Xue et al. 2011). It is not yet clear
whether this difference is real or due to observational bias.
For ASASSN-14li, Kara et al. (2018) suggest that the hard excess beyond the
blackbody arises from additional inverse Compton scattering of disk photons
by relativistic electrons in an X-ray corona. This additional Comptonization
component appears to contribute more to the spectrum as the source evolves
over time, either due to the accretion rate dropping or due to the delayed
formation of an X-ray corona. Most recently, Wen et al. (2020) show that a
“slim disk” accretion model adapted to SMBHs can successfully describe the
multi-epoch X-ray spectra of ASASSN-14li.
Another observed distinction is that TDEs are significantly less absorbed
compared to AGN found at similar redshifts (Figure 7). We note, however,
that this difference may arise from observational bias. A column density of
1022 cm−2 would completely absorb the emission of soft TDEs with a 50 eV
thermal spectrum and hinder their detection.
The thermal-dominated X-ray spectra of TDEs such as ASASSN-14li differ
from those of a wide range of AGN, from Type 1 (unabsorbed) to Type 1.9 (ab-
sorbed), all of which have non-thermal emission (Figure 8). Two Narrow-Line
Seyfert 1 AGN, 1H0707-495 and Ark 564, have been proposed as Eddington-
limited or even super-Eddington AGN. Even these extreme accretion AGN
show non-thermal X-ray emission and are distinct from ASASSN-14li.
While thermal TDEs have softer X-ray spectra than AGN (Lin et al. 2011;
Auchettl et al. 2017), the seemingly separate class of jetted TDEs, such as
Swift J1644+57, is characterised by strong X-ray emission up to ∼ 100 keV
and an AGN-like photon index (Bloom et al. 2011; Burrows et al. 2011, seeUnusual and Impostor TDEs 21
Fig. 8: Comparison between the X-ray spectra of the well-known thermal
TDE ASASSN-14li (black) and AGN of different types, including MCG-6-
30-15 (red), NGC 1365 (green), 1H0707-495 (blue), and Ark 454 (cyan). Even
Eddington-limited Narrow-line Seyfert 1 AGN (in blue and cyan) do not show
as steep an X-ray spectrum as thermal TDEs. Figure from E. Kara.
also Section 5). Complicating the picture further are observations showing that
some thermal TDEs spectrally harden as they evolve (e.g., ASASSN-14li; Kara
et al. 2018), while others show little variation. For the time being, we conclude
only that a nuclear transient with a steeper (softer) X-ray SED (Γ & 3) is more
likely to be a TDE than an AGN.
3.1.6 X-ray Variability
The variable X-ray emission observed in persistent AGN spans timescales from
seconds to months and years, with an amplitude often much larger than at
optical wavelengths (for the same source; e.g., Lanzuisi et al. 2014, and refer-
ences therein). In contrast, the X-ray (and optical/UV) light curves of TDEs
show a steady, months-long structure. Hence, measuring a transient’s X-ray
light curve with a short cadence and over years, and comparing it to the
UV/optical light curve, may prove an important tool in identifying TDEs by
excluding those AGN that vary on much shorter or longer timescales.
It is not yet clear how strongly the observed decay rate of the X-ray light
curve discriminates between TDE and variable AGN. The self-regulating na-
ture of the SMBH accretion in AGN can produce an X-ray light curve that
declines as t−(1.5−2.0) (e.g., Hopkins and Hernquist 2009). While a power-law
of t−5/3 has been associated with some TDE optical/UV light curves and the
first X-ray light curves, the observed temporal evolution of soft X-ray emission
from current X-ray and likely X-ray TDE candidates (Auchettl et al. 2017)
follows a wide variety of power-laws, consistent with fall-back, accretion, and
disk emission (e.g., Evans and Kochanek 1989; Phinney 1989a; Cannizzo et al.22 Zabludoff et al.
1990; Cannizzo and Gehrels 2009; Cannizzo et al. 2011; Lodato and Rossi
2011; Guillochon and Ramirez-Ruiz 2013), with the majority shallower than
t−5/3 . Guillochon and Ramirez-Ruiz (2013) suggest that such shallow declines
arise when TDEs are viscously delayed (i.e., the time it takes for material to
accrete is slow).
Many AGN of extreme X-ray variability have been discovered thanks to
the photon-counting nature of X-ray facilities, as well as the long integration
times used for some sources and for certain extragalactic fields. These AGN
remain poorly understood, due to the frequent lack of simultaneous data at
other wavelengths. The X-ray spectra of “X-ray changing-look” AGN (Matt
et al. 2003; Bianchi et al. 2012; Ricci et al. 2016) have been well modeled
by occulting clouds transiting into and out of the line-of-sight towards the
AGN, alternately masking and uncovering the central engine. However, the
X-ray spectra of some optical changing-look AGN, with their weakening or
strengthening of broad Balmer lines, cannot be ascribed to variable extinction.
When observed in the dim state, the X-ray spectra do not show features of
obscuration that extinguishes and reprocesses the X-ray emission, but rather
are consistent with a model where the the intrinsic X-ray emission diminished
significantly (e.g., LaMassa et al. 2015, 2017; Husemann et al. 2016). The
processes responsible for driving the X-ray variability are unknown, but there
may be a link between the Eddington ratio and spectral state of the AGN due
to mechanisms that operate at the scales of the inner accretion disk, similar
to the spectral state transitions observed in stellar mass black hole binaries
(e.g., Noda and Done 2018; Ruan et al. 2019).
TDEs tend to show relatively little variation in column density with time
(Auchettl et al. 2017); after an initial drop, NH remains roughly constant over
at least several hundred days in both ASASSN-14li and -15oi (Wen et al. 2020).
Thus, observing an evolving column density is a possible way of distinguishing
some AGN from TDEs. We note, however, that the X-ray TDEs discovered
to date tend to have lower NH than AGN (Figure 7), which may limit the
measured NH variation. For cases where declining absorption can be excluded
as the cause of X-ray brightening, the distinction between TDE and X-ray
variable AGN is less apparent. For instance, in the Seyfert 1.9 galaxy IC 3599,
TDEs were alternately invoked (Campana et al. 2015) and ruled out (Grupe
et al. 2015) to explain the observed, recurring X-ray flares.
3.2 Differentiating TDEs from Flaring AGN
3.2.1 Accretion due to Disk Instabilities
In contrast with steady-state AGN disk accretion, accretion events arising from
AGN disk instabilities might be relatively quick and deplete only the innermost
AGN disk, a scale comparable to that expected for TDEs. Indeed, fast and
coherent instabilities in the innermost parts of the disk seem to be required
to explain significant variability events in accreting SMBHs, as this is whereUnusual and Impostor TDEs 23
most of the (continuum) radiation is produced (see, e.g., Lyubarskii 1997, King
et al. 2004, and the discussion in Cannizzaro et al. 2020). Such events might
even produce higher accretion rates and luminosities than during the steady-
state and/or quiescent stages. In other words, AGN flares might share many
similarities with TDEs.
Thermal, viscous, gravitational, and radiation-pressure instabilities have
all been suggested to occur in AGN disks (e.g., Janiuk et al. 2002; Jiang et al.
2013 and references therein). Below is a brief review of the main aspects of
such instabilities and their implications. We generally follow the discussion in
Saxton et al. (2015).
Accretion disks may attain a limit-cycle behaviour, which can be generally
divided into three phases: in the 1) quiescent phase, material initially accumu-
lates at a slow rate and fills the inner region of the disk. The disk structure and
properties then slowly evolve until the disk becomes unstable, leading to the
2) rise and outburst phase, where the instability typically leads to a runaway
heating, increasing the local viscosity, scale height of the disk, and the local
accretion rate (Cannizzo 1996). This process eventually changes the accretion
rate and produces a rapid depletion of the unstable region, whose material
then accretes onto the SMBH. Such a fast accretion episode leads to a flaring
of the SMBH. As the inner disk depletes, when the matter is accreted into the
black hole faster than it is replenished, the accretion flare goes through the
3) decay phase, leading to a new quiescent phase and the next accumulation
cycle.
The disk-instability model thus predicts repeated flares. The possibility of
observing multiple flares depends on the typical duty-cycle timescale. For an
unstable disk model to explain the known TDE candidates, the timescale for
the limit-cycle must be sufficiently long, given the non-detection of repeated
TDEs to date.3
The overall depletion of the inner unstable disk is likely to occur on the
timescale τdep for material to viscously accrete from the truncation radius,
the outermost part of the unstable region down to innermost stable circular
orbit (ISCO). The initial rise should be fast, as the accretion begins from the
innermost region, and then slower, up to the timescales for the material in the
outermost truncation radius region to accrete down to the SMBH. Given the
mass enclosed in this region and the accretion rate, one can estimate a typical
timescale for the overall rise and fall:
τdep = Minner /Ṁ . (1)
The enclosed mass of the inner disk is given by
Z Rtrunc
Minner = ρ(r) 2πr H(r) dr, (2)
R0
3 The (in)ability to detect such repeated flares naturally also depends on their amplitudes,
which are not necessarily as high as the flare that led to the identification of the TDE
candidate.You can also read