WORKING DOCUMENT, MARCH 2019 - World Health Organization
←
→
Page content transcription
If your browser does not render page correctly, please read the page content below

ANALYSIS AND USE OF HEALTH FACILITY DATA: Guidance for HIV programme managers
                                WORKING DOCUMENT, MARCH 2019

WORKING DOCUMENT, MARCH 2019
ANALYSIS AND USE OF HEALTH FACILITY DATA: Guidance for HIV programme managers
                        WORKING DOCUMENT, MARCH 2019
ANALYSIS AND USE OF HEALTH FACILITY DATA: Guidance for HIV programme managers
                             WORKING DOCUMENT, MARCH 2019

ANALYSIS AND USE OF HEALTH FACILITY DATA

Guidance for HIV
programme managers

WORKING DOCUMENT, MARCH 2019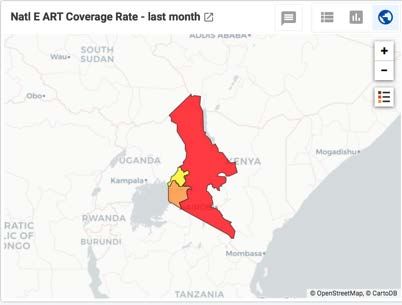
ANALYSIS AND USE OF HEALTH FACILITY DATA: Guidance for HIV programme managers
                                   WORKING DOCUMENT, MARCH 2019

© World Health Organization 2019

All rights reserved. This is a working document and should not be quoted, reproduced, translated or
adapted, in part or in whole, in any form or by any means.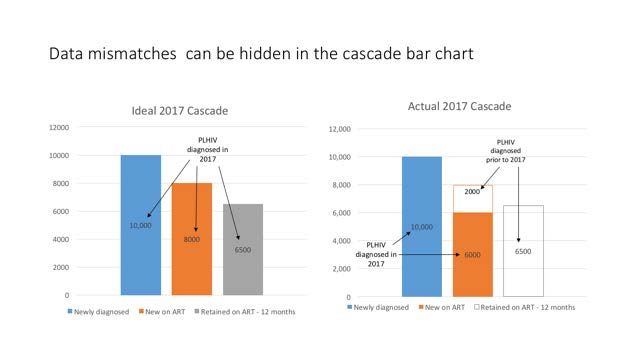
ANALYSIS AND USE OF HEALTH FACILITY DATA: Guidance for HIV programme managers
                        WORKING DOCUMENT, MARCH 2019
MODULE 4. Guidance for HIV
programme managers
LEARNING OBJECTIVES
The overall goal of this guidance document is to extend existing guidance in the 2015 WHO
consolidated HIV strategic information guidelines familiarize HIV and HMIS programme managers with
the tremendous potential of using standard dashboards to routinely analyse and use programme data
to more effectively monitor and manage HIV programs By the end of this module, participants will be
able to:
Describe the essential, or “core” HMIS indicators recommended for use in routine programme
management and how they relate to the recommended national and global indicators.
Interpret each of the figures included in the reference HIV programme dashboard and apply them
to improve programme management.
Assess the quality of HIV programme HMIS data and understand implications for interpreting
dashboard figures.
AUDIENCE
This module is relevant for different members of the health workforce and end-users of data within the
health system working on HIV including:
HIV programme managers, and
Health management information system (HMIS) managers
at both the national (e.g. ministry of health) level and at subnational health offices including managers
in charge of HIV service delivery at health facilities.
SUGGESTED REFERENCES
Consolidated strategic information guidelines for HIV in the health sector. WHO, Global Task Force
on Impact Measurement, Geneva, May 2015.
Indicator Guidance Sheet for HIV. The Global Fund, Geneva, updated regularly and accessed from
http://www.theglobalfund.org/en/me/documents/indicatorguidance/
http://www.who.int/hiv/pub/guidelines/person-centred-hiv-monitoring-guidelines/en/
ANALYSIS AND USE OF HEALTH FACILITY DATA: Guidance for HIV programme managers
WORKING DOCUMENT, MARCH 2019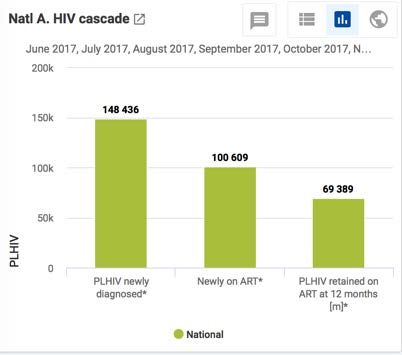
ANALYSIS AND USE OF HEALTH FACILITY DATA: Guidance for HIV programme managers
                                       WORKING DOCUMENT, MARCH 2019

Contents

1. About the data ............................................................................................ 1

2. Data quality ................................................................................................ 4

3. Core facility indicators................................................................................. 6

4. Core analysis ............................................................................................... 8

5. Data limitations......................................................................................... 18

6. References ................................................................................................ 20
ANALYSIS AND USE OF HEALTH FACILITY DATA: Guidance for HIV programme managers
                                    WORKING DOCUMENT, MARCH 2019

Acknowledgements
This guidance document has been developed by the World Health Organization, with the support of
grants from Bloomberg Philanthropies Data for Health Initiative, Gavi, the Vaccine Alliance, The Global
Fund to Fight AIDS, Tuberculosis and Malaria, and The Norwegian Agency for Development
Cooperation.
ANALYSIS AND USE OF HEALTH FACILITY DATA: Guidance for HIV programme managers
                                     WORKING DOCUMENT, MARCH 2019

1. About the data
THE HIV CASCADE OF SERVICES – DATA TO IDENTIFY & FILL
PROGRAMME GAPS
HIV health sector services can be depicted as a “cascade”, encompassing prevention, diagnosis (testing),
care and treatment, and patient and laboratory monitoring. The term cascade highlights how services
must be linked to achieve desired impacts for patient- and programme-level success. The cascade
illustrates the performance of an HIV response based on service coverage and quality. By focusing on
the “90-90-90” coverage targets whereby 90% of all PLHIV will have been diagnosed; 90% of all people
living with HIV (PLHIV) diagnosed will receive ART; and 90% of all PLHIV on ART will have suppressed viral
load; national programmes can identify critical bottle necks that slow a country’s progress toward
epidemic control. Figure 1 shows the HIV cascade of services.

Figure 1. The HIV service cascade and “90-90-90” Treatment Targets

While the graphic shows a complete cascade as a sequence of steps, in the real world, individuals may
follow a nonlinear progression through services. For example, PLHIV on treatment may start and then
drop out of ART and return to it months or years later. These variations naturally add complexity to the
analysis and interpretation of these indicators. This is particularly true in the context of facility-based
data reported in a cross-sectional, aggregate manner.

WHO HIV SI guidelines address multiple inter-connected use-cases for routine HIV programme data,
including: patient monitoring, program monitoring and management, national reporting, and global
reporting. This guidance and toolkit package focuses on program monitoring and management.

Monitoring and assessment of the cascade of services for real-time program management requires
identification of a standardized set of essential indicators covering the entire service spectrum. The
WHO Consolidated Strategic Information Guidelines for HIV in the health sector recommends 92 “core”
national indicators, including 10 identified for global monitoring, to gauge the health sector response
to HIV.

                                                   –1–
ANALYSIS AND USE OF HEALTH FACILITY DATA: Guidance for HIV programme managers
WORKING DOCUMENT, MARCH 2019
The prioritized list of global indicators allows national HIV M&E and program teams to focus on the
issues that require more extensive analysis, disaggregation and quality data to improve the impact of
programmes.
The list of 10 global indicators (Table 1) aims to offer focused, consistent information for all partners,
in lieu of fragmented information due to many non-standardized indicators. This approach helps align
national HIV programme managers and global partners on key issues in the health sector response and,
thus, to improve dialogue toward improving service coverage and quality. The WHO Consolidated
Strategic Information Guidelines are consistent with the Global AIDS Monitoring (GAM) system, the
primary mechanism by which countries contribute to global tracking of the HIV epidemic and response.
Table 1. WHO 10 global indicators for HIV programmes
Short name Short definition Measured
with Facility -
based data?
1. People with HIV Number and % of people living with HIV No
2. Domestic finance % of HIV resources financed domestically No
3. Prevention % of condom use among key and general No
populations
4. Knowing HIV status % of people who have been diagnosed Yes
5. Linkage to care 1 # and % of PLHIV with HIV care (including ART) Yes
6. Currently on ART % of PLHIV on ART Yes
7. ART retention % of PLHIV retained and surviving on ART Yes
8. Viral suppression % on ART virally suppressed Yes
9. AIDS deaths Deaths per 100,000 population attributed to AIDS No
10. New infections # and % of new HIV infections No
Of the 10 global indicators shown, five are indicators which are measured using data primarily
provided by health facilities, either directly or via linkages with community-based service delivery.
As such, these five indicators form the basis of core facility indicators that are recommended for
routine collection by facilities and collated through health management information systems (HMIS).
Some modifications of the global indicator definitions are necessary due to the cross-sectional,
aggregate nature of most data collected through an HMIS, 2 which is in contrast to the longitudinal or
cumulative perspective inherent to the HIV cascade. But the primary advantage of routine facility data
is that by routinely analysing these HMIS indicators programme managers will have the essential
1
As countries move to a “Treat All” policy this indicator will become redundant with % currently on ART and will
likely no longer be collected separately. However, until countries reach that stage of programming, % on HIV
care may continue to be an important indicator.
2
In 2017, WHO published a guideline for HIV case surveillance and patient monitoring that promotes the use of
routine data for patient care and to enable reporting on most programme, national and global indicators,
including key global targets for HIV. These guidelines aim to improve the routine collection of HIV data from
health facilities using a patient-level approach. Instead of collecting aggregated service-level data (e.g. the
number of HIV tests provided), this approach follows individuals through a cascade of linked services to improve
patient care and outcomes. As countries begin to adopt and, where existing, improve upon these types of routine
facility data systems, guidance for the recommended HMIS data analysis will include options for analyzing
individual-level, longitudinal and cumulative data. The document and annexes with all the annexes can be found
at : http://www.who.int/hiv/pub/guidelines/person-centred-hiv-monitoring-guidelines/en/
–2–ANALYSIS AND USE OF HEALTH FACILITY DATA: Guidance for HIV programme managers
WORKING DOCUMENT, MARCH 2019
information needed to track the effectiveness of the response and to trigger corrective actions to
address bottle necks in the HIV service cascade at national, district, and health facility levels. At
district and facility level, the ability to conduct routine analysis provides managers with a data-driven
decision-making process and greater focus on access to and quality of care.
–3–ANALYSIS AND USE OF HEALTH FACILITY DATA: Guidance for HIV programme managers
WORKING DOCUMENT, MARCH 2019
2. Data quality
One of the challenges to interpreting HMIS data is that responsibility for data entry, cleaning, and
management is distributed across many individuals and facilities. Unlike special studies or surveys, there
are often limited resources available for cleaning data impacting the quality and usability of routine
monitoring data. As for all data sources, in addition to establishing systems and protocols to enhance
good data collection and reporting, any analysis must consider whether the results are affected by data
quality issues.
The WHO data quality review toolkit provides guidance for defining measures of data quality,
conducting a desk review to assess data quality, and conducting data verification of routine facility data
systems. 3 The five domains used for periodic assessments of data quality as recommended by this
toolkit are summarized here:
Timeliness refers to whether reporting units submit their data according to the timeline set by national
HMIS guidelines. And completeness measures the extent to which priority data elements are included
in each report. Both timeliness and completeness of reporting can be assessed at national level and at
any SNU level (e.g. facility, district, regional, etc.). Both timeliness and completeness can also be
assessed separately for specific data forms used in reporting. For example, if HIV testing sites submit
reports separately from ART sites, then completeness of HIV testing reports can be assessed as distinct
from completeness of ART reports.
Internal consistency takes multiple forms: from identifying outliers, i.e. reported values which are
unusually high or low compared to other reporting units or compared to historical performance.
Indicators which are related to each other can also be used to develop internal consistency checks, e.g.
if a country has a Treat All policy and no backlog of patients, the number of people enrolled in ART in a
given month should be a subset of the number of people who got diagnosed with HIV that month.
External consistency and comparisons provide useful validation of routinely collected data against data
sources which may be more rigorous but are collected less frequently due to the high resource
requirements for that type of data collection. Such comparisons should be made as and when updated
external data become available, e.g. annually or less frequently.
Table 2 describes example metrics for each domain. Note that metrics for each domain can be
calculated using either “report” as the unit or “SNU” (e.g. % of reports submitted on time vs. % of
districts submitting 100% of reports on time)
Table 2. Data quality review domains for routine facility data
Domain Example Metric Metric using sub-national level (SNU)
as the unit
Timeliness % of submitted district monthly reports # and % of SNU that submitted on
(previous 1 year) that are received on time at least 75% of the monthly
time. Target: >75% reports received at national level
3 Data quality review: a toolkit for facility data quality assessment. Data quality review: a toolkit for facility data quality
assessment. Module 1. Framework and metrics; Module 2. Desk review of data quality; Module 3. Data verification and
system assessment. Geneva: World Health Organization; 2017. Licence: CC BY-NC-SA 3.0 IGO.
–4–ANALYSIS AND USE OF HEALTH FACILITY DATA: Guidance for HIV programme managers
WORKING DOCUMENT, MARCH 2019
Completeness % of expected district monthly reports # and % of SNU that submitted 75% of
(previous 1 year) that are actually expected monthly reports
received. Target: >75%
% of 1) non-zero values; 2) non missing # and % of SNU with >90% 1) non-
values (in the reporting period) per zero values; 2) non missing values for
priority indicator priority indicators
Evaluate the trend in completeness of reporting over the past 3 years
Internal % of reported values for priority indicators # and % of SNU which 1 or more
consistency that are extreme outliers (>3 SD* from reported value over the course of 1
(outliers, the mean) year is an extreme outlier.
consistency over Ratio of current year value to the average # and % of SNU whose current year-
time, consistency of the 3 preceding years) for indicators to-average of the preceding three
between expected to remain constant (e.g. ART years is >33% different from national
indicators) retention) ratio
Ratio of # enrolled on treatment: # tested # and % of SNU meeting the test of
positive in the previous reporting period < consistency between testing and
1 in a TREAT ALL setting treatment indicators
External Consistency between routinely reported # and % of SNU meeting test of
consistency with data and population-based surveys of consistency between routinely
other data comparable populations. reported data and population-based
sources surveys (among SNU with population
based survey data).
External Consistency between the population data # and % of SNU meeting test of
comparison of used for calculating coverage and other consistency between population data
population data sources of population estimates. used for calculating coverage and
other sources of population data.
*SD = standard deviation
Every country’s HMIS governance bodies will adopt their own specific data quality standards that are
appropriate for their data flow, reporting frequency, and supervisory structure. However, the standard
should address each of the domains described above.
Quality assessments of timeliness/completeness and internal consistency of HMIS data for the core HIV
indicators should be examined monthly by the reporting unit itself as well as for each supervisory level,
e.g. districts should review % completeness of all facilities expected to report in their jurisdiction,
regions should review % districts with reporting rates that meet target, and national level should
review reporting rates of regions, etc.
Routine data review activities such as those described here should be complemented by periodic,
intensive data quality assessments such as those characterized in the guidelines on Data Quality
Assessment of National and Partner HIV Treatment and Patient Monitoring Systems (WHO, 2018).
–5–ANALYSIS AND USE OF HEALTH FACILITY DATA: Guidance for HIV programme managers
WORKING DOCUMENT, MARCH 2019
3. Core facility indicators4
The following table presents a sub-set of the core facility indicators for use in the recommended HIV
programme dashboards. This list reflects a minimum set of data elements which can be analyzed to
produce figures which will help HIV programme managers in assessing programme performance and
taking actions to strengthen or accelerate service delivery. This set of indicators is aligned with global
guidance developed by WHO and its partners including the Global Reference List of 100 Core Health
Indicators (2018) and the Consolidated Strategic Information Guidelines for HIV in the health sector (2015).
Core Indicators Definition Disaggregations*
HIV tests performed Number of HIV tests Age (ANALYSIS AND USE OF HEALTH FACILITY DATA: Guidance for HIV programme managers
WORKING DOCUMENT, MARCH 2019
PLHIV on newly enrolled in HIV N: Total number of PLHIV newly enrolled in HIV Age (ANALYSIS AND USE OF HEALTH FACILITY DATA: Guidance for HIV programme managers
WORKING DOCUMENT, MARCH 2019
4. Core analysis
THE HIV DASHBOARD
–8–ANALYSIS AND USE OF HEALTH FACILITY DATA: Guidance for HIV programme managers
WORKING DOCUMENT, MARCH 2019
To provide managers with an overview of key areas of programme performance, an HIV dashboard, i.e.
standardized presentation of the core indicator data, is described in this module. One of the key
advantages of integrating a standardized dashboard into the routine reports generated by an HMIS is
that it can be made immediately available to the many different users of the HMIS at different levels of
the health system. Alternatively, the dashboard can be sent to groups of non-HMIS users on a routine
periodic basis (e.g. monthly or quarterly), to further encourage use of the information.
The Main HIV dashboard recommended in this module has four types of figures:
Bar charts showing the HIV clinical cascade and three “90s” indicators
Tables for showing SNU performance against key indicators in ranked order
Maps for key indicators to identify which geographic areas are performing well and which are
falling below expectations
Line charts showing time trends of performance for key indicators
The most useful analysis of HIV data in an HMIS helps managers identify: the type of person who is and
is not receiving services; the the places where programmes are most or less effectively provided; and
whether performance is improving over time.
This document provides description of each figure in the Main HIV dashboard including the
recommended disaggregation by person, place, and time and the alternative views for managers
conducting more in-depth analysis of performance. This module focuses on a version of the main
dashboard appropriate for managers at the national level. Variations of the main dashboard appropriate
for sub-national unit (SNU) use, e.g. at regional, district, and facility level, are also described briefly.
ANALYZING PERFORMANCE WITH DISAGGREGATED DATA
The most powerful form of disaggregation of these core indicators is by place. Using maps or tables to
show performance of these indicators by sub national unit is a critical view for managers to identify
high performing and low performing areas, whether defined by relative disease burden or
programmatic targets. Through this type of analysis managers can determine where to put more
supervision and resources and where lessons can be drawn to strengthen performance in other areas.
In order to use HMIS data to identify who may be underserved, disaggregation by demographic
characteristics is important. In line with the principle of focusing on a few, core indicators this module
recommends a limited set of other variables for standard disaggregation including gender; special
populations, such as pregnant women and key populations; and age (i.e. distinguishing between
pediatric and adult populations). Having more and more fine-grained disaggregation would make both
collection and management of the data more burdensome. However, countries with robust systems,
already collecting data disaggregated by additional variables, can incorporate these variables into their
customized dashboards. 5 In addition, implementation of case-based surveillance functionality with
national HMIS should enable such disaggregated analyses to be performed more expediently.
5
Considerations for which finer level age-disaggregations to introduce should include: 1) the multiplicative burden of
reporting disaggregation by more than one variables, e.g. Age by Sex:ANALYSIS AND USE OF HEALTH FACILITY DATA: Guidance for HIV programme managers
WORKING DOCUMENT, MARCH 2019
In many contexts, HMIS can disaggregate data by service type (e.g. ANC/PMTCT, TB, other), facility
level (e.g. hospital, health centre, dispensary, etc.), ownership (public, non-governmental, private,
etc.), or programme/funding source (e.g. PEPFAR, Global Fund, etc.). These variables are easy to
include in HMIS because they reflect characteristics of the reporting unit and need only be entered at
the time the unit is registered in the HMIS or updated with a new planning cycle (e.g. every 5 years, if
changes in funding occur). Programme managers may find these types of disaggregation of the data
helpful for examining the impact of different operational models, management structures, or
necessary to produce reports consistent with funders’ reporting requirements.
Compared to non-routine data sources, a critical advantage of HMIS data is the ability to review and
display data over different time periods to assess performance trends. This module assumes data is
collected with a monthly frequency, i.e. that the value of each indicator is known for each month.
Doing so allows each indicator to be calculated cumulatively for different time periods (e.g. last month,
last quarter, last year, etc.) and for indicators to be displayed as a trend to show progress or drop off in
services. The analytic approach in this module assumes that managers may want to review the most
recent performance. For this reason, charts and tables are presented for relative time periods, e.g. the
12 months or 3 months prior to the time the chart is generated. In practice, managers may also need
access to dashboards which show data for fixed time periods corresponding to the planning and review
cycle or reporting cycle, e.g. January – December 2016 or June-August 2016. Each user group of the
dashboards will need to identify the timeframes that are most useful for their context and dashboards
can be modified to serve those needs.
INCORPORATING TARGETS INTO THE DASHBOARD
Charts and figures used for performance monitoring should ideally incorporate the targets set for each
indicator for each SNU. For some indicators, the target is a threshold percentage, e.g. 90% ART
retention rate – 12 months. These types of targets are easily incorporated into standard dashboard
figures through color coding table cells or maps or as a line appearing across a figure showing bar
charts or trends. For other indicators, specific targets have been set using a formula applied to a local
area or service provider’s context. These types of targets can also be visualized in standardized
dashboard figures but require countries to routinely import targets for local SNUs into the HMIS as and
when they are updated in planning documents. This module details how absolute level targets can be
incorporated into some figures and notes about how area/facility specific targets can be visualized.
TIPS FOR DASHBOARD CUSTOMIZATION
As mentioned earlier, the recommended dashboard in this module provides a standardized approach
to considering key programme performance questions managers typically need to answer. The Main
dashboard can be further customized for users at national/SNU1, SNU2, and facility levels. Many of
the same indicators are used but the style of visualization has been adapted to reflect the perspectives
of different users. In a few cases, some figures are not meaningful at the facility or SNU2 level.
Types of Dashboards Primary User Frequency of #
Use Figures
HIV 2.0 National/SNU1 (e.g. Regional or Natl/SNU1 programme Quarter/ Annual 8
Provincial) level manager
HIV 2.0 SNU2 (e.g. District) Level SNU2 programme manager Month to Month 7
HIV 2.0 Facility Level Facility programme manager Month to Month 6
– 10 –ANALYSIS AND USE OF HEALTH FACILITY DATA: Guidance for HIV programme managers
WORKING DOCUMENT, MARCH 2019
Even the “standard” dashboards used by a country may need to be further adapted for the AIDS
control programme organizational structure, package of service, data availability, and differences in
epidemic conditions. Customization of standard dashboards should include the following key steps:
1) Map recommended core indicators and data elements (and disaggregation variables) to what
is collected in the country-specific HMIS;
2) Identify indicator definition modifications and implications for adopting the recommended HIV
main dashboard figures. Note in some cases, an indicator cannot be disaggregated to the
lowest level, e.g. ART coverage rate requires the estimated number of PLHIV, but in most
countries estimates are not available below district level.
3) Identify critical indicators or based on routine facility data that are included in the national
strategic plan but not in the recommended HIV main dashboard.
4) Identify the different groups of users at national and sub-national level
5) Determine the frequency and main uses of the dashboard for each user group (e.g. quarterly
review, annual reporting, semi-annual supervisory site visits, monthly staff meeting, etc.);
Identify uses that require additional or different dashboard figures for specific groups.
6) Modify dashboard configuration according for different user group and main uses, including
figures displaying critical country-specific indicators not included in the standard dashboard.
Sometimes customization of a dashboard for a specific user group is simply creating the same
dashboard figure but at a different level of granularity or different type of disaggregation. For
example, maps which show the performance of specific facilities within a district, or that limit the
dataset to only pregnant women. Or for some users, trend analysis may be more informative when
displaying monthly changes, while for other levels of managers may find quarterly or annual changes
more useful for the same indicator.
As greater granularity or disaggregation is applied, the number of service events (e.g. tests performed,
PLHIV new on ART, number of viral load tests performed, etc.) becomes smaller. Caution should be
taken when interpreting trends or comparing geographic areas when the number of events is small
(e.g.ANALYSIS AND USE OF HEALTH FACILITY DATA: Guidance for HIV programme managers
WORKING DOCUMENT, MARCH 2019
collected data may not indicate when reporting is incomplete for the last months’ data. For example, if
a country gives reporting units a 2-week period after the last day of the month to submit reports, a
chart generated before that window has closed showing the last month’s data may show lower
numbers in automatically generated dashboards and be misinterpreted as declining performance.
THE HIV CASCADE BAR CHARTS
Purpose
Provides managers with a summary of the HIV care cascade and the 90-90-90 targets using routine
monitoring data.
Analysis
A: HIV Cascade
Data elements & How do Managers Use It
Indicators 6
• PLHIV newly diagnosed Summary of performance
• Newly on ART against 3 key cascade measures;
• Number of PLHIV Gender comparison identifies
retained on ART – 12 inequity in linkage between
months 7 services.
Person, Place, Time Alternate Views
Disaggregation
All and by sex Generated for specific sub
National national units, especially low
Last 12 months (relative performing areas. Useful to
to date dashboard generate for fixed periods
generated) corresponding to
planning/budget cycle or for
more recent time periods (e.g.
last 3 months). Cascades can
be constructed for specific sub-
groups, such as pediatric,
ANC/PMTCT, key populations,
or by implementation partners.
Targets – Chart can appear as stacked columns showing achievements as a portion of targets. Or as a set of
“shadow” columns side by side, if they are color coded in a corresponding way, e.g. same colored outlines but
not filled in.
B: 2nd 90s and 3rd 90
Indicators How do Managers Use It
• Crude ratio linkage to Measures for 2nd 90 (Linkage to
treatment ART and ART Coverage), and for
• ART coverage rate 3rd 90 (% VL suppression or ART
6
In these tables, the term data element refers to a single variable directly entered into an HMIS data base, while
an indicator refers to a measure calculated from multiple data elements in an HMIS data base.
7
See Considerations/issues for interpretation section below to understand why VL suppression is not used as the
last bar in this cascade figure.
– 12 –ANALYSIS AND USE OF HEALTH FACILITY DATA: Guidance for HIV programme managers
WORKING DOCUMENT, MARCH 2019
• ART retention rate – retention – 12 months as a
12 months proxy).
• HIV viral load (Countries with less reliable VL
suppression rate testing data will use ART
• VL testing coverage retention – 12 months) To
rate - annualized interpret VL suppression data,
managers must know whether a
majority of patients on ART are
getting VL testing every year.
Person, Place, Time Alternate Views
Disaggregation
National Generated for specific sub
Last 12 months (relative national units, especially low
to date dashboard performing areas or for specific
generated) – for Crude facility types. Useful to
Ratio, ART retention rate generate for fixed periods
– 12 months, HIV viral corresponding to
load suppression and VL planning/budget cycle or for
esting coverage rate; more recent time periods (e.g.
Last month (relative to last 3 months). Figure can be
date dashboard constructed for specific sub-
generated) – for ART groups, such as pediatric,
coverage rate ANC/PMTCT, key populations,
or by implementation partners.
Targets – Target of 90% can be shown as a line running across the figure.
Considerations/issues for interpretation
• Cascade analysis using facility-based data for cascade analysis are limited to cross-sectional
views of patient experience
• Data from countries transitioning to a “treat-all” policy may result in atypical cascades.
• In countries where VL testing is not routine in all areas, should rely on ART retention data rather
than VL suppression data for cascade analysis based on facility-based data.
The bar chart showing cascade indicators as absolute numbers replicates the ideal HIV care cascade using
data available from routine monitoring data. In a mature well-functioning “treat all” ART programme,
the numbers of newly on ART would be expected to be 90% or more of those PLHIV newly diagnosed.
And the number retained on ART for 12 months should be 90% or more of the number newly on ART
(i.e. assuming the rate of diagnoses is similar from one year to the next).
However, the cross sectional, unlinked way that data are captured in most HMIS means that using these
indicators may not always result in a typical cascade. This is due to inclusion of different groups of PLHIV
in each bar. For example, some patients newly starting ART in the year represented by the figure may
have been diagnosed more than a year earlier and have been waiting to enroll in treatment. And
individuals included in the measure for ART retention for 12 months (third bar) by definition would have
been diagnosed and initiated ART in the year prior to those people included in the second bar.
– 13 –ANALYSIS AND USE OF HEALTH FACILITY DATA: Guidance for HIV programme managers
WORKING DOCUMENT, MARCH 2019
In the figure above, an example is given illustrating how the time-lag mismatch can be masked because
the bars shown in the cascade have a relationship that looks as expected. However, in many countries
these anomalies can result in a cascade charts where the second or third bars are larger than the previous
bars. As ART programmes stabilize and reduce the backlog of diagnosed patients waiting to initiate
treatment (expanding same-day ART initiation, etc.), the cascade figures will become more
interpretable. Help end-users of the dashboard by adding notations about programmatic transitions or
shifts to dashboard figures, when the information is critical to interpreting the results.
The cascade ratios shown in Figure B. display the coverage indicators related to the “2nd 90” and “3rd 90”
indicators: a Crude Linkage measure for % of those diagnosed linked to care, the % of estimated PLHIV
on ART, the % retained on ART for 12 months, and the % of ART patients with viral load suppression
among those who had a viral load test. Because VL testing is not yet universal among all ART patients in
most countries, the VL testing coverage is also shown in this figure to help interpret the generalizability
of the “3rd 90.”
With respect to interpreting possible inequity in service utilization through separate male and female
cascades, analysts should also consider reviewing the data separately for ANC/PMTCT clients. Because
PMTCT programmes follow a different set of guidelines and often have separate management, budgets
and infrastructure for providing testing and treatment services, there may be a difference in HIV care
cascades for women who are diagnosed in ANC settings and those who are diagnosed in non-ANC
settings. At the same time, for program managers it may be useful to compare HIV testing services
(HTS) across different service venues and modalities, including ANC/PMTCT, TB, out-patient, in-patient,
and other PITC-focused settings.
HIV TESTING AND ART PERFORMANCE TABLES
Purpose
Displays SNUs in ranked order for the key indicators for testing performance and ART performance
– 14 –ANALYSIS AND USE OF HEALTH FACILITY DATA: Guidance for HIV programme managers
WORKING DOCUMENT, MARCH 2019
Analysis
C. Testing Performance by SNU1
Indicators Needed How do Managers Use It
• HIV tests performed Allows manager to sort by any
• PLHIV newly diagnosed testing indicator in the table to
• HIV test positivity identify high and low SNU2
• Crude ratio linkage to performers. Side by side data
treatment on # of tests and test positivity
allow managers to better assess
efficiency of case finding.
Person, Place, Time Alternate Views
All Generated by sex or age by
SNU1 (regional district level or specific facility
Last 12 month (relative to types. Useful to generate for
date dashboard fixed periods corresponding to
generated) planning/budget cycle or for
more recent time periods (e.g.
last 3 months).
Targets: Table can be expanded to have separate column for % achievement against testing targets, then color
coded according to which areas achieved or surpassed their targets.
D. ART Performance by SNU1
Indicators Needed How do Managers Use It
• Newly on ART Allows manager to sort by any
• Crude Ratio linkage to ART indicator in the table to
treatment identify high and low SNU2
• Currently on ART performers.
• ART retention rate – Achieved % are color coded by
12 months standard measures of
• HIV viral load performance (90%)
• VL testing coverage
Legend: Green =90%, Yellow = 75-89%, Orange = 60-75%, rate – annualized
and Red =ANALYSIS AND USE OF HEALTH FACILITY DATA: Guidance for HIV programme managers
WORKING DOCUMENT, MARCH 2019
Considerations/issues for interpretation
• Tables of indicators display programme performance in a scorecard format which is helpful for
ranking geographic areas or reporting units.
• Different managers may benefit from sorting high and low performing areas according to
different indicators.
These tables function as a type of score card, presenting a summary view of programme performance
across geographic areas (i.e. SNU) for the key indicators of the HIV testing programme and the ART
programme. These lists can be sorted by any variable shown in the table. Color coding values in the
table according to expected performance helps managers to easily scan for low and high performing
geographic areas. It is also possible to determine which aspect of a testing programme or the ART
programme creates challenges for large groups of SNU. Or to see patterns in low performance across
multiple dimensions of the programme.
Scorecards made available to SNU level managers or facilities can see how their facility/SNU performs
compared to other sites. The generation of these tables for specific sub-groups (e.g. by gender, for key
populations, for specific types of facilities, or those funded using a specific service delivery model) can
also be helpful in exploring inequity or under-performance.
The indicators selected for the tables reflect the key questions managers may have: where is HIV
testing promotion and service expansion working and where are testing resources being used (i.e. # of
tests performed)? where is case finding highest and been most efficient (i.e. # of PLHIV newly
diagnosed, test positivity)? Where are the most number of new ART patients (i.e. # newly on ART)?
Where is ART linkage to care poor (i.e. Crude Ratio of Newly on ART to newly diagnosed)? Where is
ART enrollment highest (i.e. # currently on ART, ART coverage rate)? Where is ART quality high (e.g.
ART retention rate >90%, VL suppression rate >90%)?
Note that assessment of testing performance relies on the number of tests performed, which is only a
proxy for number of individuals tested for HIV. Facility based testing data that are reported in
aggregate cannot distinguish repeat testers in different time periods. Managers may need to adjust
their testing coverage estimates based on the average number of times a person may get tested for
HIV over a given period.
CURRENTLY ON ART AND RETENTION ON ART MAPS
Purpose
Summarizes the size and quality of ART service provision by SNU across the country
Analysis
E. ART coverage map by SNU1
Indicators Needed How do Managers Use It
• ART coverage rate Identifies underperforming
areas on ART coverage,
assuming estimates for PLHIV
are reliable. Managers can
reference broader ART
performance in parallel table
(D)
– 16 –ANALYSIS AND USE OF HEALTH FACILITY DATA: Guidance for HIV programme managers
WORKING DOCUMENT, MARCH 2019
Person, Place, Time Alternate Views
Disaggregation
All Generated by sex or age
SNU1
Last month(relative to date
dashboard generated)
Targets – Currently targets are shown through the color coding of areas (>90%, 75-89%, 90%, 75-89%,ANALYSIS AND USE OF HEALTH FACILITY DATA: Guidance for HIV programme managers
WORKING DOCUMENT, MARCH 2019
• Use of the ART coverage indicator in maps is limited to the level of granularity for which
estimates of PLHIV are available in a country.
• Maps can highlight performance at multiple sub-national levels simultaneously using a
combination of choropleth and spot maps.
The map of current ART coverage shows which SNUs have done a good or poor job in diagnosing and
linking PLHIV to ART. Unlike most other indicators used in these dashboards, the current number on ART
refers to the cumulative number of patients on ART at a specific point in time (i.e. by the end of the
month for which it is generated). It is not meaningful when summed over different periods of time, such
as a quarter, a year, or multiple years. When the indicator is “calculated over a period of time,” the HMIS
should be taking an average value across the time period. Calculating the coverage rate requires
estimates of PLHIV for different SNUs, e.g. District estimates from Spectrum, be available and imported
into the HMIS. In addition to being critical program performance data, ART coverage at SNU levels help
program managers to define relative geographic and sociodemographic gaps in service access which may
be addressed by operational and financial adjustments.
The map of ART retention is designed to show ART retention rates at two SNU levels simultaneously
(i.e. SNU2 and facility level). The figure can summarize what parts of the country have high retention
and which are underperforming. It can also identify specific facilities which disproportionately
contribute to the SNU2 retention rate. For example, a low performing facility will have a very different
marker color (red) than the background color of the SNU2 that is performing well (green).
CASE FINDING, LINKAGE AND ART QUALITY TRENDS
Purpose
Shows changes in performance for case finding, linkage to treatment and ART retention/ VL
suppression over time. Identifies unusual activity or interruption in service.
Analysis
G: Trend in newly diagnosed and new on ART
Indicators Needed How do Managers Use It
• PLHIV newly diagnosed Shows whether case finding and
• Newly on ART new ART enrolment are steady
and the month-to month
pattern of linkage to treatment.
Person, Place, Time Alternate Views
Disaggregation
All Generated by gender, age, key
National populations, service delivery
Monthly modes (e.g. PMTCT, TB), or
specific sub-national units,
especially those identified as
underperforming through maps
or tables. Time periods can be
calculated to show values by
quarterly performance for fixed
periods corresponding to
budget or planning cycles.
– 18 –ANALYSIS AND USE OF HEALTH FACILITY DATA: Guidance for HIV programme managers
WORKING DOCUMENT, MARCH 2019
H: Trend in ART retention and VL suppression
Indicators Needed How do Managers Use It
• ART retention rate– 12 Shows whether ART retention
months and VL suppression rates remain
• HIV viral load high or fall below expected
suppression rate thresholds. 90% Target line is
• VL testing coverage shown to identify gap in
rate – annualized performance. VL testing
coverage rate line indicates
whether % VL suppression is
likely to be generalizable to all
ART patients.
90% Target line is shown to
identify gap in performance for
ART retention -12 months and
VL suppression rates.
Person, Place, Time Alternate Views
Disaggregation
All Generated by sex, age, key
National populations, or for specific sub-
Monthly national units, especially those
identified as underperforming
through maps or tables.
Time periods can be calculated
to show values by quarterly
performance for fixed periods
corresponding to budget or
planning cycles.
Targets: In this figure the assumption is that both retention and VL suppression should be at 90%.
Considerations/issues for interpretation
• Trend analysis helps managers identify anomalies in performance or reporting that can trigger
timely investigation or intervention.
• Specific areas of poor performance can be identified by observing divergence in trends
between indicators which are expected to track together, such as ART retention and VL
suppression.
These two figures provide useful side-by-side comparison of indicators that are expected to have a
relationship to each other. In well-functioning programmes, trends in newly on ART should shadow
trends in newly diagnosed, especially in countries with a “treat all” policy in place. Large deviations
between the lines or cross-overs (i.e. where the number newly on ART is much larger than the newly
diagnosed) should have programmatic explanations that are incorporated as notes into the figure to
aid interpretation. For example, in Figure G, the number newly on ART exceeds the number of cases
diagnosed in August 2018. This occurred due to concerted campaign in August to reduce the list of
patients waiting to enroll in ART as this country completed its transition to implementing a “treat-all”
programme.
Similarly, at any level, programmes with consistently low crude linkage should have a clear explanation
(e.g. inadequate ART service coverage within the SNU), or prompt management follow-up to ascertain
the root causes and solutions to improve linkage. Similarly, ART retention and VL suppression should
– 19 –ANALYSIS AND USE OF HEALTH FACILITY DATA: Guidance for HIV programme managers
WORKING DOCUMENT, MARCH 2019
follow similar trends. However, when discrepancies between these two lines are identified, managers
and analysts must further investigate whether the issue is related to data quality, low levels of VL
testing coverage or a substantive issue with non-adherence or drug resistance.
Another useful aspect of trend analysis that builds on score-card type ranking is to determine whether
areas that are underperforming against targets show a consistent underachievement, or whether a
recent programmatic event or barrier occurred. Facilities or geographic areas which are able to
bounce back from underperformance in a single reporting period indicates a functioning system that
can identify problems and respond independently. Consistent lags or declining levels of performance
suggest that local managers are unable to diagnose and respond on their own. In this way trend
analysis provides insight into whether supervisory intervention is needed and what type of follow up
may be effective.
5. Data limitations
The key advantage of using HMIS data over survey or special study data to measure programme
performance is that these data are systematically captured for all patients receiving services resulting in
an comprehensive view of services provided. A common limitation of HMIS data based on aggregate
reporting is the tendency for data to be collected in a cross-sectional manner. Especially when used for
cascade analysis, the important insights gained by a longitudinal view of patient experience are not easily
displayed using routine facility-based HMIS data [NB: in many settings, health facilities will have HIV
electronic medical records or reporting systems which contain individual-level, longitudinal data,
however the data reported into the HMIS are usually aggregate]. The unlinked nature of cross-sectional
data makes interpretation of some figures complex, especially in settings where patients access services
at different facilities over time. The figures recommended in the main dashboard presented in this
document attempt to represent the most useful ways to display the data which are typically available
(based on global and national core indicator standards) and given the most common limitations of most
HMIS used by HIV programmes. To account for these limitations in data interpretation country-level
analysts and managers must contextualize expectations of performance in terms of how services are
actually provided and choose the appropriate level of disaggregation used for the standard charts they
adopt.
6. References
Consolidated strategic information guidelines for HIV in the health sector. WHO, Global Task Force
on Impact Measurement, Geneva, May 2015
Indicator Guidance Sheet for HIV. The Global Fund, Geneva, updated regularly and accessed from
http://www.theglobalfund.org/en/me/documents/indicatorguidance/
http://www.who.int/hiv/pub/guidelines/person-centred-hiv-monitoring-guidelines/en/
– 20 –ANALYSIS AND USE OF HEALTH FACILITY DATA: Guidance for HIV programme managers
WORKING DOCUMENT, MARCH 2019
– 21 –ANALYSIS AND USE OF HEALTH FACILITY DATA: Guidance for HIV programme managers
WORKING DOCUMENT, MARCH 2019
– 22 –You can also read