Analysing capacity challenges in the Multi-Airport System of Mexico City
←
→
Page content transcription
If your browser does not render page correctly, please read the page content below

Analysing capacity challenges in the Multi-Airport System of
Mexico City

Author(s)
Mujica Mota, Miguel; Izco Berastegui, Irene ; Faulin, Javier

Publication date
2022
Document Version
Author accepted manuscript (AAM)
License
CC BY-NC-ND
Link to publication

Citation for published version (APA):
Mujica Mota, M., Izco Berastegui, I., & Faulin, J. (2022). Analysing
capacity challenges in the Multi-Airport System of Mexico City. Paper
presented at European Modeling & Simulation Symposium 2022,
Rome, Italy.

General rights
It is not permitted to download or to forward/distribute the text or part of it without the consent of the author(s)
and/or copyright holder(s), other than for strictly personal, individual use, unless the work is under an open
content license (like Creative Commons).

Disclaimer/Complaints regulations
If you believe that digital publication of certain material infringes any of your rights or (privacy) interests,
please let the Library know, stating your reasons. In case of a legitimate complaint, the Library will make the
material inaccessible and/or remove it from the website. Please contact the library:
https://www.amsterdamuas.com/library/contact/questions, or send a letter to: University Library (Library of the
University of Amsterdam and Amsterdam University of Applied Sciences), Secretariat, Singel 425, 1012 WP
Amsterdam, The Netherlands. You will be contacted as soon as possible.

Download date:17 Mar 2023
34th European Modeling & Simulation Symposium
                     19th International Multidisciplinary Modeling & Simulation Multiconference

                     2724-0029 © 2022 The Authors.
                     doi: xx.xxxx/xxxx

Analysing capacity challenges in the Multi-Airport
System of Mexico City
Miguel Mujica Mota1, Irene Izco Berastegui2, Javier Faulin3
1
 Amsterdam University of Applied Sciences, Weesperzijde 190, Amsterdam, 1097DZ, The Netherlands
2
  Institute of Smart Cities, Public University of Navarre, 31006 Pamplona, Spain
3
  Institute of Smart Cities, Dept. Statistics, Computer Science and Mathematics. Public University of Navarre,
31006 Pamplona, Spain
1
    m.mujica.mota@hva.nl
2
    izco.121951@e.unavarra.es
3
    javier.faulin@unavarra.es

Abstract
The relentless growth in Mexico City’s aviation traffic has inevitably strained capacity development of its airport, raising the
dilemma between the possible solutions. In the present study, Mexico’s Multi-Airport System is subjected to analysis by means
of multi-model simulation, focusing on the capacity-demand problem of the system. The methodology combines phases of
modelling, data collection, simulation, experimental design, and analysis. Drawing a distinction from previous works involving
two-airport systems. It also explores the challenges raised by the Covid-19 pandemic in Mexico City airport operations, with a
discrete-event simulation model of a multi-airport system composed by three airports (MEX, TLC, and the new airport NLU).
The study is including the latest data of flights, infrastructures, and layout collected in 2021. Therefore, the paper aims to
answer to the question of whether the system will be able to cope with the expected demand in a short-, medium-, and long-
term by simulating three future scenarios based on aviation forecasts. The study reveals potential limitations of the system as
time evolves and the feasibility of a joint operation to absorb the demand in such a big region like Mexico City.

Keywords: Multi-Airport System; simulation; airfield capacity; traffic congestion.

                                                                   government constructed a new one from scratch.
1.      Introduction                                               Airport Felipe Angeles (NLU) has been opened on 21
                                                                   March of 2022 to alleviate the congestion problems in
Mexico City airport has become the busiest airport in              the airport of Mexico City (MEX).
the country, leading to capacity problems that arose
the dilemma between building a new airport or                      Furthermore, with the new one, the govern of Mexico
expanding the existing one; unfortunately, due to the              is aiming at developing a proper multi-airport system
limitations of the current one, the expansion solution             composed by the new airport (NLU) and the two old
is not feasible anymore. For that reason, the Mexican              ones within the metropolitan region of Mexico City,
                                                                   Toluca (TLC) and the airport of Mexico City (MEX).

                      © 2022 The Authors. This article is an open access article distributed under the terms and conditions of the
                      Creative Commons Attribution (CC BY-NC-ND) license (https://creativecommons.org/licenses/by-nc-nd/4.0/).

                                                                                                                               1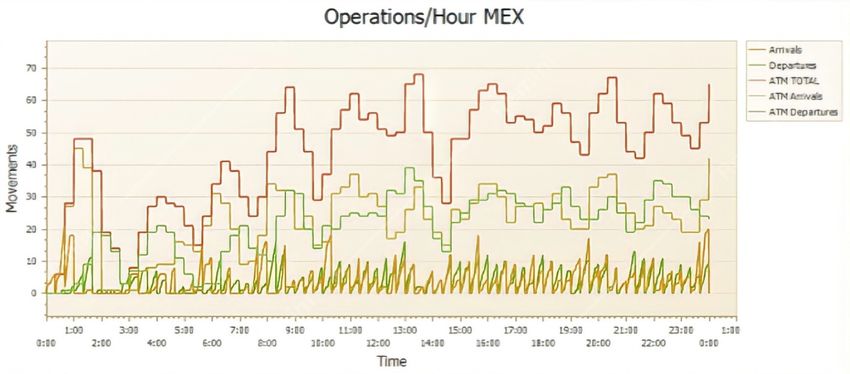
2 | 34th European Modeling & Simulation Symposium, EMSS 2022

This paper presents a study that investigates the                  2.   State of the art
practical limitations and performance indicators of
the capacity of the multi-airport system of Mexico                  Works on Multi-Airport Systems are relatively
City. The approach developed a simulation framework                 novel. The seminal paper of De Neufville and Odoni
composed by the three airports formed by MEX, TLC                   (1995) introduced and defined the concept of multi-
and NLU. For that purpose, different scenarios are                  airport system (MAS) as: “the set of significant
designed according to the expected commercial and                   airports that serve commercial transport in a
cargo flight traffic, airline business models, and                  metropolitan region, without regard to ownership
aircraft equipment. We proposed different potential                 or political control of the individual airports”. MAS
scenarios of development to evaluate what the                       constitute a sizable segment of the airport industry,
limitations will be and where are opportunities for                 around 80% of the worldwide traffic and can be
alleviate the congestion at MEX.                                    found in the busiest metropolitan areas of the globe.
Three future scenarios are proposed, modifying the                  According to De Neufville et al., (2013) the main
model accordingly to the NLU project phase                          difficulties   in    developing      a   MAS    include
development. The 2021 scenario is taken as a baseline,              “insufficient traffic at a new airport and in the
where the current capacity and demand problem is                    overall system, difficulty in closing an old airport,
evaluated. Then a 2025 Scenario is considered                       the volatility of traffic at the secondary airports and
followed by a final one at year 2035.                               the changing nature of customers”. The paper of
                                                                    Martin and Voltes-Dorta (2011) provides some
A review of flight demand forecasts - before COVID-19
                                                                    caution for the development and use of MAS. They
- is also considered, giving a global view of the
                                                                    suggest, considering a financial approach, that
expected growth before the pandemic.
                                                                    some MAS worldwide are operating inefficiently and
Some publications from agencies (ICAO, 2018)                        that the consolidation of air traffic of the whole MAS
estimate that global passenger traffic is expected to               into one airport could provide a better performance
grow at 4.2% annually from 2018 to 2038.                            regarding operating costs. Furthermore, De
Nevertheless, due to Covid-19 the estimation has                    Luca. (2012) and Yang et al. (2016) suggested that
dropped. An analysis published by ICAO (2021) -                     the viability of a MAS is intertwined with the
considering factors like economic recession, potential              development of other transport infrastructure, such
resilience, or speed of recovery of the countries -                 as, railways, roads, and bus services, so that
conclude that full recovery to return to 2019 levels is             customers of the MAS could have accessible options
not expected until 2024.                                            to use any of the airports in the system and change
                                                                    their initial preference regarding the principal
 In this study a scenario design was developed
                                                                    airport. Regarding the issue of airport selection, the
considering actual forecasts of annual growth rate of
                                                                    subject of the main factors involved influencing
flight demand, both in Mexico and at a global scale, to
                                                                    selection among customers has been extensively
calculate the number of additional flights when the
                                                                    studied using statistical methods (Hess and Polak,
demand is evolving.
                                                                    2005; Loo, 2008; Ishii et al., 2009; Marcucci and
Simulation was selected as the appropriate tool for the             Gatta, 2011; de Luca, 2012; Fuellhart et al., 2013;
study. Firstly, because the operations performed by                 Nesset and Helgesen, 2014). These papers found
the aviation sector are based on schedule and                       that air fare, access time, flight frequency, the
secondly, because the inherent variability of the                   number of airlines and the availability of airport–
system makes simulation an ideal approach.                          airline combinations were statistically significant
                                                                    factors in customer choice of airport. Interestingly,
Flight information is provided in tables with the                   airport access time was found to be more important
corresponding arriving and outgoing connections,                    for business travellers than for leisure travellers. In
including information about the airline, aircraft type,             contrast, leisure travellers were found to be more
arrival time and destination. Specific data of aircrafts            sensitive to price changes than business travellers.
and airports is employed to design in an accurate                   The specific issue of multi-airport capacity has been
model logic, and the airline data is taken into                     studied before by Ramanujam and Balakrishnan
consideration for statistical purposes. This way,                   (2009). The study of them focuses on the definition
flights are generated in the model according to the                 of capacity envelopes for the MAS of NYC, based on
arrival time to the airport, triggering the events that             Gilbo (1993) proposal. Using quantile regression and
characterize the simulation.                                        historical data, they modelled the relation between
 The paper continues as follows, section 2 presents the             arrival and departure rates at singular airports
state of the art with regards to multi-airport systems,             considering the arrival rate as the independent
section 3 introduces the methodology; section 4                     variable, as arrivals are given priority over
presents the experimental design and results the                    departures at singular airports. In this paper, special
experimental design and section 5 concludes and give                attention is paid to the traffic evolution, since
future lines of research.                                           Mexico City is the busiest airport in the country and
                                                                    the effect of COVID-19 pandemic on flight demand
                                                                    is wreaking havoc.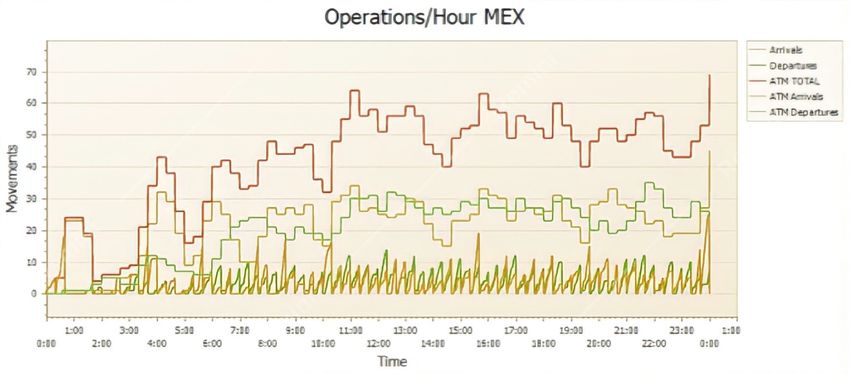
Mujica Mota et al. | 3

 For the analysis of multi-airport planning and                     1) Problem                             2) Setting
 design, the authors have had previous efforts where                Formulation                            Objectives

 they consider only a bi-airport system (NLU-MEX),
 and they validated the feasibility of the operation at                3) Model
                                                                     Conceptualizat
                                                                                                                                            4) Data
                                                                                                                                           Collection
 Mexico City (Mujica, 2018) and also Mujica et al.                        ion

 (2019). On this regard, the current study goes one
 step beyond by considering the current demand and             5)

 including TLC airport in the model to have a more                          Abstraction Level I
                                                                             Model Translation
                                                                                                      Abstraction Level II
                                                                                                       Model Translation
                                                                                                                                  Abstraction Level n
                                                                                                                                   Model Translation

 accurate view of the potential of the multi-airport
 system of Mexico City.
                                                                    NO                        NO                             NO

3.   Methodology                                                                  Verified                  Verified                    Verified

The methodology followed in this study, is the one
devised by Mujica et al. (2018), illustrated with an
example of two models for an expansion project in The                                                     Validated?

Netherlands. In this case, the concept of the multi-
model framework is translated by using a combination
of models using SIMIO program. Figure 1 illustrates                                                           6)
                                                                                                         Experimental
the general methodology developed for the current                                                          Design

study.
                                                                                                                          YES
                                                                                                        7) Replications
Once the objective was identified, a level of abstraction                                                and Analysis

                                                                                                  Y
for the three airports forming the system was                                                     E
                                                                                                                NO

specified. This stage was followed by the data                                                    S
                                                                                                           8) More
collection. Flight information was collected from                                                            runs

FlightRadar24 (2021a & 2021b) and the airports’ official
webpages. In this case several layers of models were                                                   9) Documentation
                                                                                                         and Reporting                 10) Implementation
developed; one consisted of a low-level model of MEX
that considers in high detail the runway system
operation and the complete airside of the airport.          Figure 1. Methodology of the n-model virtual cycle approach for
Another layer is composed by a high-level model of          airport capacity
NLU considering the capacity estimated for the
different stages of development, particularly the           3.1.     Simulation model: multi-Airport system layout
runway system capacity and the gate capacity. The last         The Metropolitan Area of Mexico City is the area
one is the model of TLC which similarly to NLU is a
                                                            served currently by Mexico City International Airport
high-level model that considers the current gate            (MEX) and the surrounding airports of Toluca (TLC)
capacity and runway capacity to evaluate its                and now Felipe Angeles Airport (NLU). Figure 2
limitations.                                                illustrates the metropolitan area of Mexico City with
                                                            the MAS for the region.

                                                                                                                                                            NLU

                                                                                                                                                   MEX

                                                                                  TLC

                                                            Figure 2. Multi-airport system of Mexico City

                                                               With the use of the methodology presented, a
                                                            framework composed of three sub-models (NLU-
                                                            TLC_MEX) was developed. The models were verified
                                                            and validated and in turn we developed an
                                                            experimental design to get insight related to the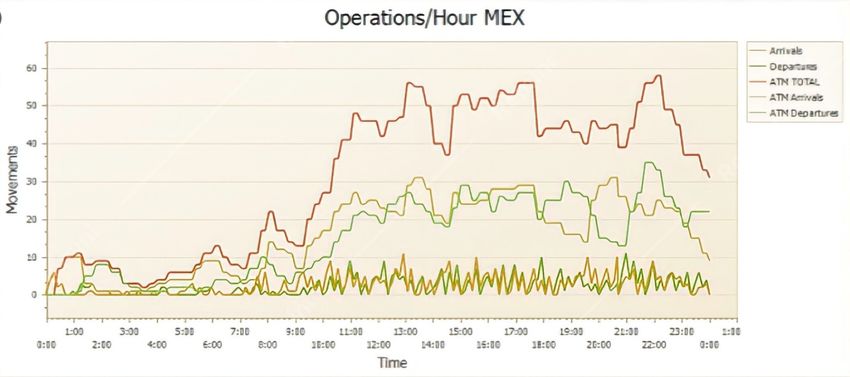
4 | 34th European Modeling & Simulation Symposium, EMSS 2022
capacity of the system for three different time category distinguishing international and domestic
horizons. flights for cargo, Low-Cost Carrier, and Full-Service
Carrier.
3.1.1. Mexico City International Airport (MEX) model
MEX is composed by Terminal 1 (with 33 contact and
4. Experiments results and analysis
17 remote positions) and Terminal 2 (23 contact and 18 In this section we present the results of the
remote positions), operating with domestic and experimental design.
international commercial carriers and handling
aircrafts ranging from A320s to A380. Two Code E 4.1. Data analysis
runways of 3900 m (05R/23L) and 3952 m (05L/23L)
enable the maximum theoretical capacity of the One of the main challenges of this study was to
system to be of 61 ATM/h. analyse both commercial and cargo flight demand in
the Metropolitan Region of Mexico City, paying special
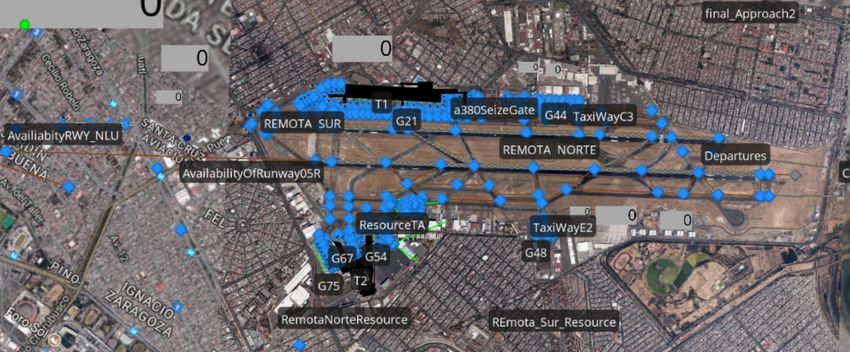
The model of MEX implemented is a detailed low-level attention to the operating airlines and equipment
model, where the elements that conform the airport type.
are represented as a network of nodes and edges where
the properties are configured to simulate their Data collection was performed extracting information
behaviour in the system. For instance, each of the 96 from both Flight Radar24 (Flight Radar, 2021) and the
gates are represented as a server in which the webpages of both MEX (MEX, 2021) and TLC (AIT, 2021)
processing time and aircraft capacity is specified, or airports, NLU was not operational at the time of the
runways and taxiways are represented with nodes and study. Flight schedules in real time were collected
edges also. during the week between April 7th, 2021, and April 14th,
2021, gathering information about the following fields
for the arrival flights to MEX and TLC:
- Origin
- Destination
- Arriving time (date and hour)
- Flight code
- Airline
- Equipment (aircraft model)
Figure 3. Airside model of Mexico City airport
It is important to mention that since no data of the
3.1.2. International Airport of Toluca (TLC) passenger capacity was available, full design capacity
of each aircraft is assumed.
The existing secondary airport of the MAS (TLC)
has a single runway of 4310 m, the largest in Mexico so 4.1.1. Traffic distribution of the MAS
far, and a single L shaped terminal with 12 gates. When The estimation of the traffic share expected was based
it comes to cargo, the airports cargo area is mainly on the total passenger demand of the Multi-Airport
controlled by FedEx, and it is located at the southern System proposed in the Master Plan (GACM, 2020). It
side of the runway. This airport was modelled as a is expected that the current congestion in MEX is
network of capacitated nodes connected by weighted lowered by increasing the operations in TLC and NLU
edges representing the different elements of the progressively, according to the development stages of
system. The gate capacity of the airport is considered the NLU project. Figure 4 illustrates the demand
as 12 units (Aircraft). distribution considered in the study.
3.1.3. Felipe Angeles International Airport (NLU)
The third airport NLU, which was opened to operation
on 21st March of 2022. It is being implemented in three
stages from 2022 to 2035 and finally to 2052,
periodically increasing the airport’s operation
capacity from 44 to 107 gates and in its last stage to
178 gates.
The model is a high-level one which is represented
with a unique server bringing together all the gates by
specifying the capacity of the server (44,107 or 178 for
NLU during the three stages of development).
Figure 4. MAS traffic share in the simulation scenarios
It is important to note that the gates in each airport
For the initial scenario, the flight demand growth rate
terminal are distributed accordingly to the flight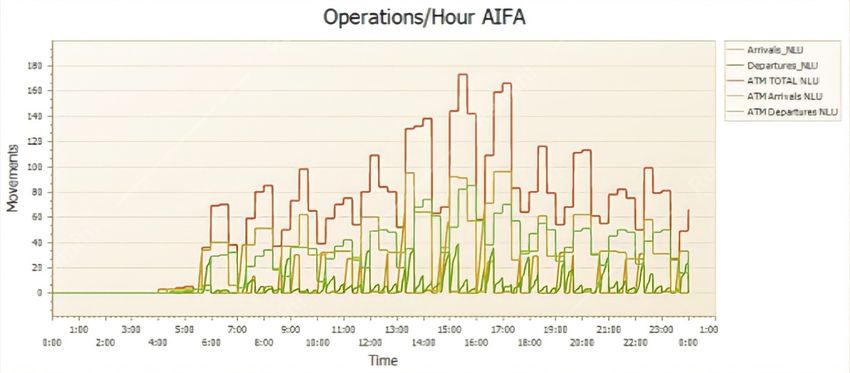
Mujica Mota et al. | 5

considered on this paper is not the one presented in               The results obtained employing EasyFit (2021)
the Plan Maestro, since the forecasted figures are                 software are subjected to chi-squared goodness of fit
believed to be overrated contemplating the current                 test to measure the compatibility of the random data
depression situation after COVID-19. Instead, short-               sample introduced and the theoretical probability
term goals proposed by the airport operator are                    distribution generated. Table 1 presents the complete
considered: the annual growth for the 2021-2025                    TAT used for the pairs in the model.
period will go from 51% decline in 2020, to 41%
increase in 2021, 15% in 2022, 18% in 2023 and finally,            Table 1. Aircraft-airline pair turnaround time probability.
to 12% in 2024 (year when full recovery is assumed).                 Airline          Aircraft   TAT probability
                                                                     AEROMAR          AT72       Random.Beta(17.22, 118.7)
   After full recovery, growth rates estimated for 2019
                                                                     AEROMEXICO       E190       Random.LogNormal(4.3276,
situation were applied, assuming a constant annual                                               0.28628)
percent rate growth: In the second stage of NLU                      AEROMEXICO       B738       Random.PearsonVI(46.76,
project, LCC flights are expected to increase in a                                               16.209, 30.084)
higher rate than FSC, growing +4% annually,                          AEROMEXICO       B789       Random.Beta(1.201,
compared to +3% growth for FSC. In the last stage, the                                           0.92347)
growth is assumed to be equal and +3% for both                       AIR FRANCE       B77W       Random.LogLogistic(8.4552,
carrier types.                                                                                   168.57)
                                                                     DELTA            B752       Random.Weibull(4.4576,
   Regarding cargo demand, annual growth rate of                                                 99.895)
cargo operations is 5% between 2025 and 2035 and 7%                  VIVA             A320       Random.Weibull(3.4719,
between 2035 and 2052. It is important to note that                  AEROBUS                     67.18)
cargo business has been the only revenue for many                    VOLARIS          A320       Random.LogNormal(4.316,
airlines during the pandemic, since passenger flights                                            0.23414)

that were responsible for delivering 60% of the cargo                UNITED           A320       Random.Beta(0.55208,
                                                                     AIRLINES                    0.38001)
in their bellies ceased, leading as a result an increase
                                                                     AMERICAN         B738       Random.Triangular(60.759,
in cargo freighters yield.                                           AIRLINES                    92, 128.6)
                                                                     TAR              E145       Random.Weibull(3.312,
4.1.2.    Airline review: Probability distributions related to       AEROLINEAS                  30.736)
         turnaround time of flights                                  VIVA             A320       Random.Beta(0.45607,
                                                                     AEROBUS                     0.67419)
Turnaround time (TAT) plays a key role in the correct                VIVA             A20N       Random.Weibull(1.3226,
representation of the operations of the airports, since              AEROBUS                     19.894)
it is the time interval that considers the time required             FEDEX            B763       Random.Weibull(1.8384,
to unload an airplane after its arrival at a gate and the                                        27.519)
time to prepare the aircraft for the next departure.
Due to the random nature of this property, probability            4.1.3.    Gate allocation
distributions associated to aircrafts TAT were                    Since gate information is not publicly available, we
constructed, performing a data collection and analysis            allocated them following thumb rules based on
for different equipment-airline pairs that arrive both            experience. We followed the following allocation
to MEX and TLC. Since it was considered unfeasible                avoiding overlapping of flights in the system:
timewise to extract data for all the airlines and
equipment that operate in the MAS, airlines were
                                                                    - When two consecutive flights arrive at the same
selected regarding the flight operation days on a
                                                                      hour and at the same gate, the gate randomly
weekly basis, selecting the most operative airline with
                                                                      allocated must be changed by either the upper or
the highest frequency equipment associated to it.
                                                                      lower bound gate of the hall of the terminal.
Following the work of Mujica & Flores (2019),                       - When two flights arrive at the same gate at
probability distribution fitting was performed with the               different times, overlapping caused by TAT must
data by grouping TATs in pairs of Arline-Equipment,                   be checked. If the time between flights is shorter
so that the effect of the business model in the                       than the TAT corresponding to the first flight, the
turnaround time is also considered. Figure 5 illustrates              gate of the second one must be reallocated.
the types of adjustment done for the pairs.
                                                                  4.2.     Boundary conditions and analysis criteria
                                                                  The analysis was performed under the following
                                                                  considerations:

                                                                    - Daily operation flight schedules are considered, in
                                                                      such a way that all simulations carried out consist
                                                                      of 24-hour long run.
 Figure 5 Fitted TAT distributions for Aeromar AT72 and AA B738
                                                                    - The traffic mix for the MAS depends on NLU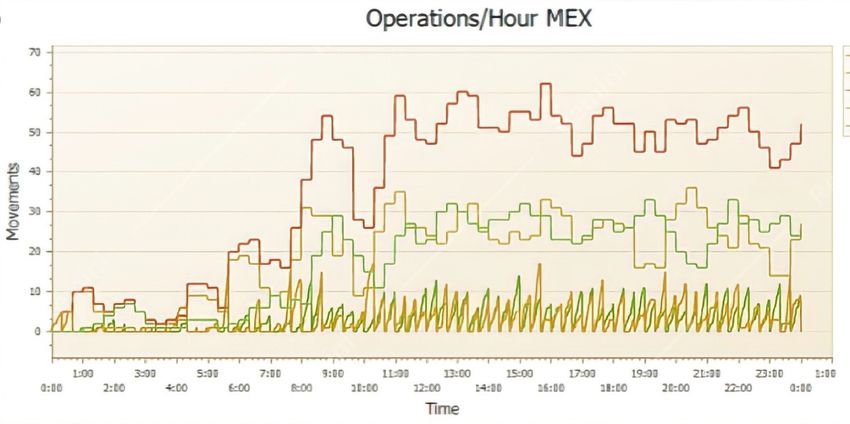
6 | 34th European Modeling & Simulation Symposium, EMSS 2022

    Project development phase.                                        exhibited in the last decades and this can be
  - The parking positions in each airport conforming                  appreciated in the 3 ATM/hr, a negligible value
    the MAS are modified according to the NLU Project                 compared to its stated limit of 36 ATM/hr.
    development phases.
  - 30 replications are made for each experiment.
  - It is assumed that the PAX/aircraft correspond to                 As it can be seen in Figure 7, the operation frequency
    the maximum capacity of the aircrafts selected for                in TLC is almost marginal compared to the one in
                                                                      MEX, which explains the imbalance of the traffic share
    simulation applying a passenger load factor of
                                                                      in the Multi-Airport System at the present time (96%
    100% according to the scenario.
                                                                      of the traffic is absorbed by MEX and 4% by TLC). The
                                                                      maximum passenger value in the system -at the time
4.3.     Simulated Scenarios                                          of study - is of 25.3 MPAX, which is almost half of the
The current situation in 2021 is taken as a baseline for              expected value in the forecasts before COVID-19.
the scenarios, where the capacity and demand are
evaluated.

4.3.1.     Scenario 0
The Current Mexico City Metropolitan Region traffic
values are used in the models, following the flight
schedules of MEX and TLC airports on a week basis.
The model includes:

                                                                      Figure 7. ATM evolution during a day in TLC, Scenario 0
  - MEX including 05R-23L and 05L-23R runways,
    terminal 1 and terminal 2 and 103 contact
    positions for the aircrafts operating.                            Table 2 complements the results for this scenario.
  - TLC airport including a unique runway, the                         Table 2. Performance indicators of MEX, TLC & NLU in Scenario 0.
    commercial terminal with 12 contact positions and                                      MEX             TLC           NLU
    the cargo terminal.                                                                    Avg     Max     Avg    Max    Avg    Max
  - Traffic mix based on the forecasts, including LCC,                   ATM_hr            31.3    59.9    0.4    3      -      -
    FSC and Cargo carriers.                                              Aircraft
                                                                                           0       0       0      0      -      -
                                                                         Waiting Gate
Since NLU is not operative at the time of the study, the                 Aircraft
                                                                         Waiting           0.7     5.3     0      0      -      -
traffic is shared between MEX and TLC. In this case,                     Runway
the principal airport holds 96% of the total demand of                   Gate
the system.                                                              Occupancy
                                                                                           20%     48%     1%     10%    -      -

When it comes to TLC, it is noticeable that the current
flight schedule is a clear representation of the effects              4.3.2.   Scenario 1
of the pandemic. According to collected data from
FlightRadar24, the mean of daily scheduled flights                    This scenario represents the first phase of NLU in 2025
cancelled during March 2021 is 50%, being the number                  (that will be finished by 2022), when two commercial
of weekly departures of around 20 flights.                            runways will be operational. It is important to mark
                                                                      that their 1.6 km distance between them enables
                                                                      simultaneous landing and take-off operations. It is
                                                                      assumed that most LCC carriers will move to NLU,
                                                                      releasing the congestion from MEX.
                                                                      This assumption will be maintained for subsequent
                                                                      scenarios in which the volume of traffic will increase
                                                                      and the share of passengers among the system’s
                                                                      airports will be redistributed.

Figure 6. ATM evolution during a day in MEX, Scenario 0

As it can be seen in Figure 7 the results reflect the
current situation of the pandemic. The demand has
dropped compared to the increasing tendency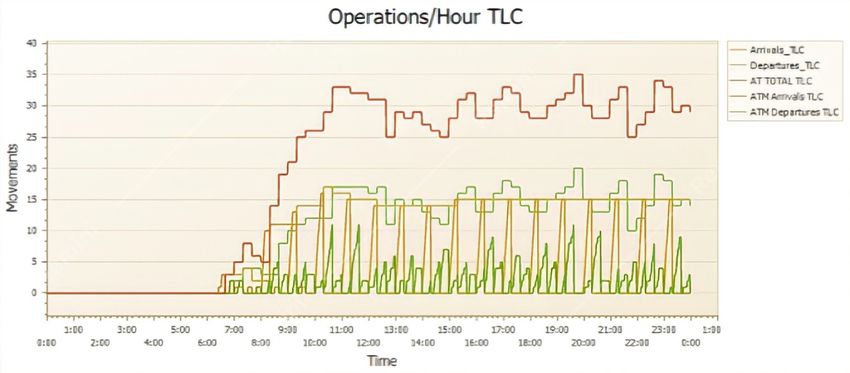
Mujica Mota et al. | 7

                                                               Table 3. Performance indicators of MEX, TLC & NLU in Scenario 1.
                                                                              MEX                TLC            NLU
                                                                              Avg         Max    Avg     Max    Avg     Max
                                                                 ATM_hr       37.2        63.5   2.9     15.9   12.6    41.5
                                                                 Aircraft
                                                                 Waiting      0.02        0.03   0       0      0       0
                                                                 Gate
                                                                 Aircraft
                                                                 Waiting      0.8         5.9    0       1      0       0
                                                                 Runway
                                                                 Gate
                                                                              31%         57%    4%      49%    20%     57%
                                                                 Occupancy

                                                              4.3.3.   Scenario 2
                                                              This is the mid-term scenario of the evolution of
                                                              traffic in the multi-airport system, representing the
                                                              situation of the capacity and demand in 2035, where
                                                              Phase 2 of NLU project would have been reached. This
                                                              means that from that moment on, the airport will be
                                                              able to accommodate around 43.2 MPAX annually and
                                                              107 aircraft positions will be operative.
                                                              This expected capacity expansion, that doubles the
                                                              number of available gates, together with maintaining
                                                              the same traffic share of Scenario 1 (25% of the total
                                                              MAS traffic), reflects a situation where the operational
                                                              level of the airports is decongested, reaching a
                                                              maximum of 62.7 ATM/hr at MEX during peak hour.
                                                              When it comes to the maximum expected passenger
Figure 8. ATM evolution during a day in MEX, NLU and TLC in
Scenario 1
                                                              inflow of the system, it is expected that the airports
                                                              altogether will be able to absorb 106.5 MPAX annually
According to forecasts, this scenario represents the          (allocating 60.6 MPAX, 16.3 MPAX and 29.6 MPAX, in
recovery scenario from the COVID-19 pandemic                  MEX, TLC and NLU, respectively).
effects. Therefore, the simulation is conducted with
values of flight schedules before the pandemic. As it
was in the situation pre-pandemic, the system
presents the first signs of congestion, reaching a
maximum of 63.5 ATM/hr in MEX and 41.5 ATM/hr in
NLU. Nevertheless, it must be noted that the average
values obtained in the three airports are 37.2 ATM/hr
in MEX, 2.9 ATM/hr in TLC and 12.6 ATM/hr in NLU,
revealing that the problems are focused during peak
hour – as it happens in most airports in the globe -.
When it comes to gate occupancy, early signs of
oversized infrastructure of the NLU terminal appear
looking at the figures obtained, as only 20% of the
available gates appear to be in use. In this case it can
be noticed that the bottleneck in MEX is the runway, as
it has always been declared by the government for
years. This conclusion is drawn from the fact that the
number of aircrafts waiting in queue, being almost 1
on average and 6 at most. It is important to realize
that 6 is the maximum value, but this does not mean
that there will always be 6 aircrafts waiting. Table 3
complements the results of Scenario 1.

                                                               Figure 9. ATM evolution during a day in MEX, NLU and TLC in
                                                               Scenario 2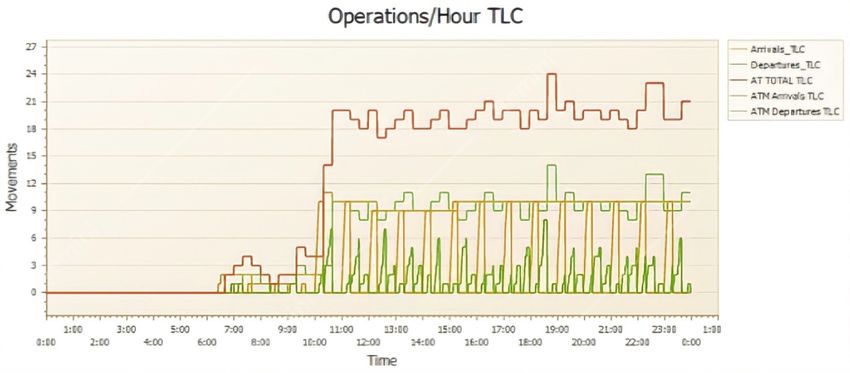
8 | 34th European Modeling & Simulation Symposium, EMSS 2022

Following the tendency of previous scenarios, gate
occupancy does not represent a problem in any of the
three airports, despite the high 89% maximum value
obtained in TLC (see Table 4).

The runways at MEX are the bottleneck as it can be
noticed that at least one aircraft is waiting for the
runway on average. Similarly, in this case the
limitation of Runway usage appears for the first time
in NLU during peak hour; however, not representing a
problem.
 Table 4. Performance indicators of MEX, TLC & NLU in Scenario 2.
                MEX                      TLC                   NLU
                Avg         Max          Avg        Max        Avg       Max
   ATM_hr       32.7        62.7         10.9       23.6       5.2       30.7
   Aircraft
   Waiting      0.9146      1.6333       0          0          0         0
   Gate
   Aircraft
   Waiting      1.1         9.4          0          1          0         4
   Runway
   Gate
                39%         66%          16%        89%        12%       31%
   Occupancy

4.3.4.   Scenario 3
   This scenario represents the expected demand for
2052, where the last phase of NLU and therefore full-
operation capacity of the system would have been
reached. Table 5 presents the statistics for this
                                                                                 Figure 10. ATM evolution during a day in MEX, NLU and TLC in
scenario illustrating the expected values of the multi-                          Scenario 3
airport system in 2052.
                                                                                The runway limitations are revealed in MEX and NLU.
                                                                                Regardless of the implementation of a third runway in
 Table 5. Performance indicators of MEX, TLC & NLU in Scenario 3.               NLU, even if the average is less than a flight, 7
                MEX                  TLC                   NLU                  aircrafts need to wait for the runway during peak hour.
                Avg         Max      Avg        Max        Avg       Max        Once again, the low value of gate occupancy reflects
   ATM_hr       42.5        73.4     19.2       34         60.5      167.9      the oversized capacity of the terminal infrastructure –
   Aircraft                                                                     with 2 terminal buildings-.
   Waiting      8.6         15.4     0          0          0         0
                                                                                The 60.5 ATM/hr operation average obtained in NLU
   Gate
                                                                                can be considered a consequence of the distribution in
   Aircraft
   Waiting      0.9         5.7      0          2          0         7          the daily flight schedule, as it can be appreciated in
   Runway                                                                       Figure 10. In our assumption, NLU is operating from
   Gate                                                                         4:00 to 24:00, which is a disadvantage compared to
                47%         75%      19%        88%        19%       48%
   Occupancy                                                                    the 24 hour-operation of MEX.

                                                                                5.   Conclusions
In such case, it is expected that the MAS will be able to
allocate 160 MPAX every year, being NLU the busiest                             The study presents the study done for analysing for
airport with 84.9 MPAX, followed by MEX with around                             the first time the multi-airport system of the
50 MPAX. Figure 10 illustrates the evolution during the                         metropolitan region of Mexico City. This approach can
day.                                                                            be replicated in other systems as it is a general
                                                                                methodology based on a multi-model approach.
In the last scenario the biggest flight demand is used
as input for the simulation. In fact, this is the first                         The study analyses the system under diverse
time where saturation limit is surpassed in TLC –                               assumptions like the LCC will leave MEX and operate
revealing     the   necessity     of    expansion    of                         at TLC and NLU or that international flights will not
infrastructures- with a maximum of 34 ATM/hr                                    operate in TLC.
(compared to the theoretical 32 ATM/hr capacity)                                Results show that with the opening of the new NLU
                                                                                airport, the Multi-Airport System formed by MEX,
                                                                                NLU and TLC would be able to cope with the expected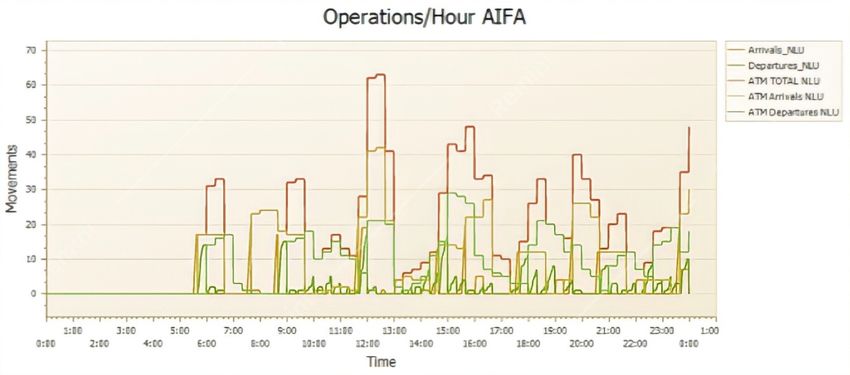
Mujica Mota et al. | 9

demand in a short-term and long-term. For the case        References
of MEX, the runway system is a delicate element in the
system that limits the growth as it has happened          MEX. (2021). Statistics and Flight-Schedules.
during the last decades.                                    Aeropuerto Internacional de la Ciudad de México.
                                                            https://www.MEX.com.mx/vuelos
When it comes to the secondary airports, TLC and
NLU, results reveal the infrastructure of NLU is          AIT. (2021). Aerolíneas y Destinos | Aeropuerto
sufficient to absorb the demand diverted from MEX to         Internacional de Toluca.
NLU and the gate capacity is more than enough for the        https://www.aeropuertodetoluca.com.mx/vuelos-
expected demand; for the case of TLC, it has enough          aerolineas Accessed on April 2021.
spare capacity to absorb traffic and the current          de Luca, S. (2012). Modelling airport choice behaviour
number of gates are also sufficient or even                  for direct flights, connecting flights and different
underutilized.                                               travel plans. Journal of Transport Geography, vol.
                                                             22, pp. 148-163.
With regards to passenger capacity of the system, it is   De Neufville, R. (1995). Management of multi-airport
important to note that the flight schedules of Scenario
                                                             systems.        doi:http://dx.doi.org/10.1016/0969-
0 simulate the effects of the pandemic, as 25.3 million
PAX are absorbed by the whole MAS compared to the            6997(95)00035-6.
72 MPAX estimated for 2022. After recovery, in            De Neufville, D. R., Belobaba, P., Odoni, A., & Reynolds,
Scenario 1, it can be noted that the pandemic gave time      T. (2013). Airport Systems, Second Edition:
to the government to have NLU operational for the            Planning, Design and Management (2nd ed.).
shifting of traffic to NLU from MEX on a timely basis        McGraw-Hill Education.
as it can be seen in the results obtained.
                                                          EasyFit. (2021). [Computer software].
The main limitation of the system in the long run will
be the capacity of the runways as waiting Aircraft        Flightradar24. (2021a). Live Flight Tracker - Real-
appear in MEX and NLU and in TLC when the scenarios          Time          Flight         Tracker        Map.
of biggest demand are analysed.                              https://www.flightradar24.com/data/airports/mx/
                                                             departures
In general, the methodology proposed for the study of
the multi-airport system seemed the right one to          Flightradar24. (2021b). Live Flight Tracker - Real-
analyse for the first time a complex system such as the      Time Flight Tracker Map.
one present in Mexico City. For that reason, the             https://www.flightradar24.com/data/airports/tlc/d
authors strongly suggest the use of simulation as a          epartures
tool to evaluate and identify the turning points when     Flores de la Mota I., Guasch A., Mujica Mota M.A., Piera
new infrastructure is required with the increase of          M.A. (2017). Robust Modelling and Simulation:
demand in the system.                                        Integration of SIMIO with Petri nets. Springer, 1st
                                                             ED, pp. 162.
5.1.   Future work and limitations
                                                          Fuellhart, K., O’Connor, K., Woltemade, C. (2013).
As mentioned, the multi-model approach is composed           Route-level passenger variation within three
by one low-level and 2 high-level models for the             multi-airport regions in the USA. Journal of
airports of MEX, NLU and TLC. This might be a                Transport Geography, vol. 31, pp. 171-180.
limitation as the operation of multiple runways might
                                                          GACM. (2020, December). Acuerdo por el que se
not be properly simulated but the approach gives us a
                                                             aprueba el Programa Institucional de Grupo
good initial estimate of the expected performance. In
                                                             Aeroportuario de la Ciudad de México, S.A. de C.V.
the future, the authors will work on developing
                                                             2020–2024.
different simulation models for the complete system
                                                             https://www.sct.gob.mx/transporte-y-medicina-
to get a better understanding of all the emergent
                                                             preventiva/aeronautica-civil/8-noticias-y-sitios-
dynamics present in such a complex one. In addition,
                                                             de-interes/83-blog-de-la-aviacion-mexicana-
the land connection and accessibility to the three
                                                             2019/
airports will be added to the framework to estimate
                                                          Management, vol. 11, no. 2, pp. 59-68.
travel times between airports and identify quality KPIs
                                                          Gilbo, E. P. (1993). Airport capacity: representation,
such as travel times and connecting times within
                                                             estimation, optimization. IEEE Transactions on
Mexico City which are also of great importance to
                                                             Control Systems Technology, vol. 1, no. 3, pp. 144-
understand the potential of such a system.
                                                             154.
                                                          Hess, S., Polak, J.W. (2005). Mixed logit modelling of
Acknowledgement                                              airport choice in multi-airport regions. Journal of
The authors would like to thank Amsterdam                    Air Transport
University of Applied Sciences for the support in this    Ishii, J., Jun, S., Van Dender, K. (2009). Air travel
research, as well as the Dutch Benelux Simulation            choices in multi-airport markets.
Society (www.dutchBSS.org) and EUROSIM for                Loo, B.P.Y. (2008). Passengers’ airport choice within
disseminating the results of this work.                      multi-airport regions (MARs): some insights from
10 | 34th European Modeling & Simulation Symposium, EMSS 2022 a stated preference survey at Hong Kong and airside accessibility. Journal of Transport International Airport. Journal of Transport Geography, vol. 52, pp. 98-110. Geography, vol. 16, no. 2, pp. 117-125. Marcucci, E., Gatta, V. (2011). Regional airport choice: Consumer behaviour and policy implications. Journal of Transport Geography, vol. 19, no. 1, pp. 70-84. Martin, J.C., Voltes-Dorta, A. (2011). The dilemma between capacity expansions and multi-airport systems: Empirical evidence from the industry’s cost function. Transportation Research Part E: Logistics and Transportation Review, vol. 47, no. 3, pp. 382-389. Mujica Mota, M., di Bernardi, A., Scala, P., & Delahaye, D. (2019). Simulation-Based analysis of capacity for a multi-airport system: Mexico case study. In the Proceedings of the Air Transport Research Society Conference 2019, Jul. 2–5, Amsterdam, The Netherlands. Mujica Mota, Di Bernardi A., Scala P., Ramirez-Diaz G, 2018. Simulation-based Virtual Cycle for Multi- level Airport Analysis. Aerospace, Vol 5 No. 2, pp.1- 18. Mujica Mota, M., & Flores, I. (2019, March). Model- based Methodology for Identifying Capacity Limitations in Airports: Mexico City Airport Case. https://doi.org/10.11128/sne.29.on.10462 Nesset, E., Helgesen, Ø. (2014). Effects of switching costs on customer attitude loyalty to an airport in a multi-airport region. Transportation Research Part A: Policy and Practice, vol. 67, pp. 240-253. Ramanujam, H. Balakrishnan (2009). Estimation of arrival-departure capacity tradeoffs in multi- airport systems. Proceedings of the 48h IEEE Conference on Decision and Control (CDC) held jointly with 2009 28th Chinese Control Conference, SIMIO. (2021). [Computer software]. SIMIO. https://www.simio.com/index.php Yang, Z., Yu, S., Notteboom, T. (2016). Airport location in multiple airport regions (MARs): The role of land
You can also read