An introduction to biomedical applications of big data, machine learning, and artificial intelligence - RYAN PETERSON, ASSISTANT PROFESSOR ...
←
→
Page content transcription
If your browser does not render page correctly, please read the page content below
An introduction to
biomedical applications of big data,
machine learning, and
artificial intelligence
RYAN PETERSO N , ASSISTANT PRO F ESSO R, B IO STATISTI C S & IN FO RMATI C S
C C TSI B IG DATA SEMINAR SERIES
NOV EMB ER 9, 2022

                                                                               1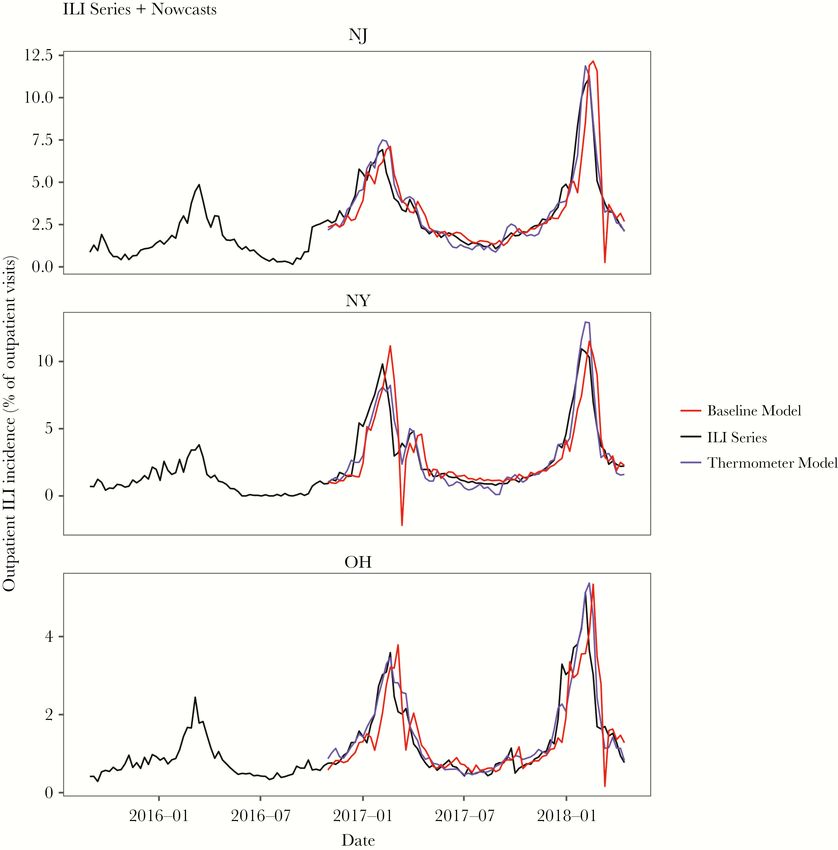
Outline
Introduction to big data
 ◦ What are they?
 ◦ Why are they important?
 ◦ Important considerations – context, goals, bias

Machine learning and artificial intelligence
A survey of big data contexts
Big data ethics

                                                     2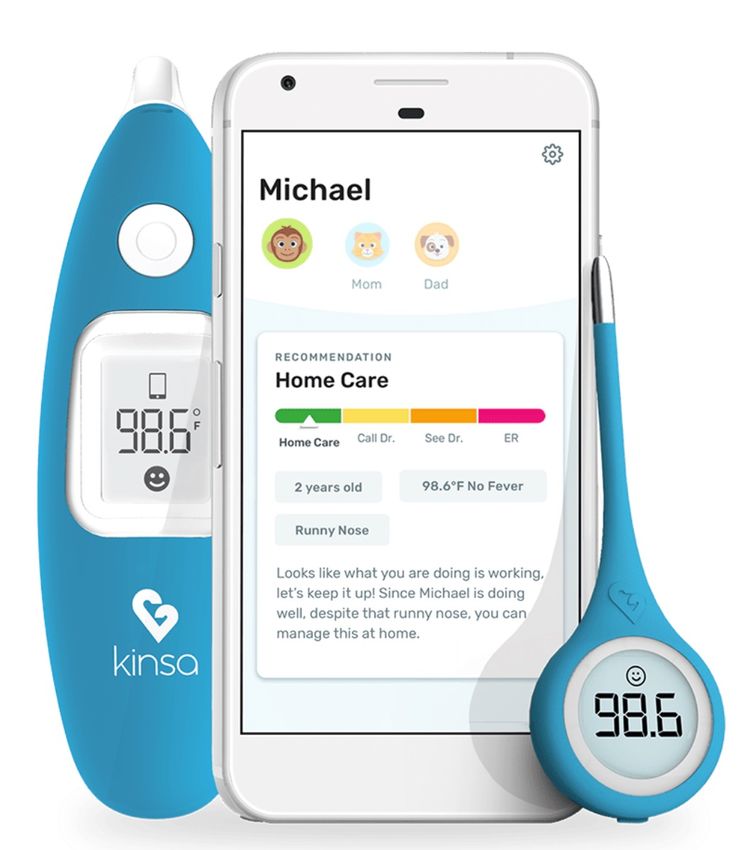
Big data

           3
Big data – what are they?
The term “big data” typically refers to
data sets so large and/or complex that
they are difficult to process using on-
hand database management tools or
traditional data processing
applications.
The challenges include capture,
curation, storage, search, sharing,
transfer, analysis, and visualization.
Big data sets often include a variety of
data types. Sometimes data are
structured, but often they are
unstructured or semi-structured.

                                           Source: Wikipedia

                                                   4
Big data – The 4 (or 5) V’s
IBM: The 4 V’s of big data vary from context to
context: volume, veracity, variety, and velocity
The fifth “V” is “Value”.
Big data + “work to yield insights” = Value
Such “work” may include analysis, machine
learning, and/or artificial intelligence, which
we’ll touch on soon

                                                   Source

                                                            5
Knowledge/value creation framework

                                Ltifi et al. 2013, Fayyad et al. 1996

                                                     6
Important considerations
Big data are not an end in themselves. Context matters for how to frame necessary work!
For many reasons, most big data cannot be processed on a desktop.
Big data are often utilized to solve causal questions, but may provide limited causal insights
Identifying sources of variation and bias are key; traditional methods used for big data tend to
fall victim to bias.
 ◦ Landon/Roosevelt election in 1936, Lancet poll
 ◦ Google Flu Trends

                                                                                                   7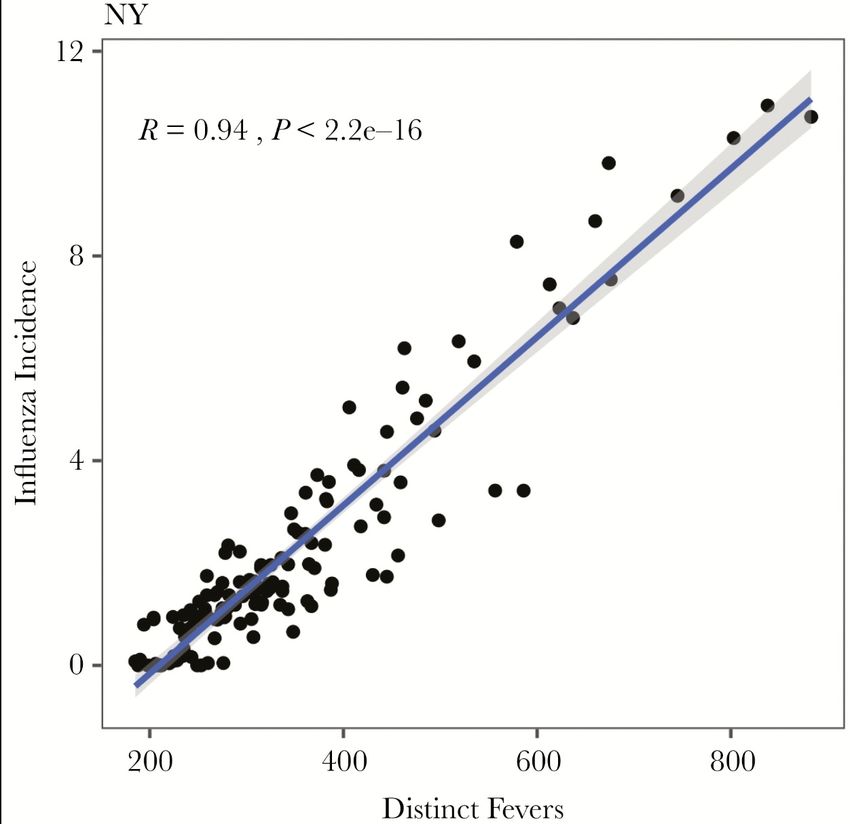
Value propositions for big data
In industry settings, value is most often measured in dollars.
What is the value proposition for big data in research (not-for-profit) settings?
What is the value proposition in biomedical/healthcare settings?

                           Personalized medicine!

                                                                                    8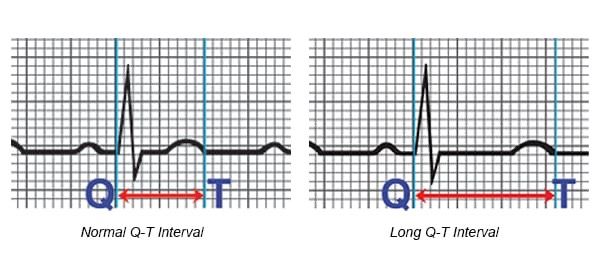
High-sample or high-dimensional?
“High sample size” big data refer to “tall” data sets with an
extremely large number of samples (n).
 ◦ If data collection is cheap relative to value proposition, massive                   p
   data sets are common (e.g. advertising, insurance)
 ◦ For, randomized controlled clinical trials, the gold-standard causal       ID   X1       …   Xp
   study, we do not see massive data sets.
                                                                              S1
High-dimensional data refer to “wide” data sets with an
extremely large number of features (p).                                   n   …
 ◦ If measuring many features of a single independent observation is
   cheap, we will see high-dimensional data.                                  Sn
 ◦ ’Omics data are typically high-dimensional, rarely have a n>>p

Additional computational and analytical complexity arises when
big data have both high-n and high-dimensional components
(wearables, Google trends, images)

                                                                                                 9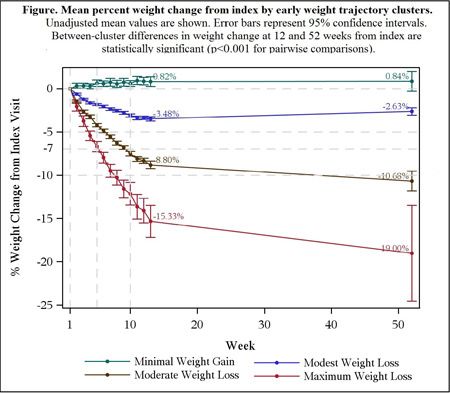
High-sample or high-dimensional?
HIGH SAMPLE SIZE (N>P)                                  HIGH DIMENSIONS (P>N)

Produces “stable” insights (e.g. precise                Tends to produce “unstable” insights
estimates of effects of interest)
                                                        Issues relating to multiple
Issues relating to bias of primary concern              comparisons/multiplicity of primary concern
Possibility for diminishing returns relative to         Causal effects can be difficult to disentangle
value proposition                                       from correlated features
                                                          ◦ “Rashomon Effect”
Black-box algorithms tend to perform well

What about when you have both a very high sample size and very high dimensions?
 • Not always clear; depends on goals/context.
 • An interdisciplinary approach is best; important to include clinician, informatician, data scientist,
   (bio)statistician, and more. Same goes for complex data structures.
                                                                                                           10
Streaming data
Another type of “big data” that doesn’t follow neatly into these categories is “Streaming” data.
Streaming data are continuously generated by different sources, and refer to small amounts of
data which arrive at a very fast rate.
Streaming data can be conceptualized as “data streams” which lead to a “data lake”.
Examples: Sensors in transportation vehicles, stock market data, website analytics, twitter data
Processing and analysis performed on the data lake are referred to as “batch processing”, those
performed on the data streams are “stream processing”
More information available at AWS
Related to time-series data analysis
11Machine learning,
artificial intelligence
12Machine learning and artificial
intelligence
Screenshot from openAI playground:
13Machine learning and artificial
intelligence
Hotpot.ai image generator: “machine learning
and artificial intelligence” “Machine learning”
14Machine learning
Also called “Data mining”, represents “3rd
phase” of knowledge discovery for big-data.
Supervised learning: using information to
predict an outcome
Unsupervised learning: using information to
identify subgroups
Recommendation systems
Anomaly detections: identification of
observations that deviate from the norm
15Supervised learning
Goal: Given a training data set with X’s and Y’s, build a model to predict Y given X.
Then, take a new X that was not in the data set and predict Y for that new observation
Many public challenges exist or have been completed for this purpose (e.g. Kaggle, Netflix)
Simple supervised learning techniques can be performed that are transparent and interpretable:
◦ Regression! (lasso for high-dimensional case)
◦ Decision trees
“Fancier” ML tools: random forests, ensembles/Super learners, K-nearest neighbors, support
vector/kernel machines, [deep] neural networks
◦ Predictions and models are “explainable,” but not necessarily interpretable
◦ Commonly referred to as “black box”
16Unsupervised Machine Learning
No outcome of interest
Dimension reduction (going from a high number of
variables to a low number of variables)
◦ Without the consideration of the prediction of an outcome
Clustering data points together (top-right)
Examples:
◦ Eliminating high VIF variables is a form of dimension
reduction
◦ Weight loss trajectory clustering (bottom plot on right)
17Supervised ML “algorithms”
CLASSIFICATION ALGORITHMS REGRESSION ALGORITHMS
Outcome is categorical (possibly binary) Outcome is continuous
Logistic regression is a classification algorithm Confusingly, logistic regression is not a
“regression” algorithm in the ML world since
A coin flip can be a classification algorithm the outcome must be continuous.
Any set of rules or equations which output a Examples include:
class prediction or probability is a classification ◦ Linear regression
algorithm.
◦ Partial least squares
Performance measures: misclassification rate, ◦ Regression trees
area under the ROC curve (AUC), sensitivity, ◦ many others
specificity, more.
Performance measures: Root-mean-squared
error, R-squared
18Interpretability in Machine Learning
SIMPLE/INTERPRETABLE “BLACK BOX” MODELS
Tend to have parameters which can be If they have parameters, they cannot be well-
interpreted in sentences/words understood (think: high order interactions)
The process by which predictions are made is The process by which predictions are made
mathematically tractable and understandable. need not be mathematically tractable (by
humans).
Examples:
◦ the older a child, the larger our prediction for Input -> ?? -> predictions. The question marks
their FEV. (linear regression) are “left blank” by the researchers, who only
◦ Patients in 3rd class (or crew) on the titanic had care about the predictions themselves.
the worst odds of survival (logistic regression)
19Transparent vs black box learning
AN INTERPRETABLE STATISTICAL MODEL MAY A BLACK-BOX ML MODEL MAY BE THE BETTER
BE THE BETTER CHOICE IF… CHOICE IF…
Uncertainty is inherent in the outcome The outcome doesn’t have a strong component of
randomness
The signal-to-noise ratio is low
The signal-to-noise ratio is large
One wants to isolate effects of a small number of variables
Overall prediction is the goal, without being able to
Uncertainty in an overall prediction or the effect of a succinctly describe the impact of any one variable (e.g.,
predictor is sought treatment)
Additivity is the dominant way that predictors affect the One is not very interested in estimating uncertainty in
outcome (interactions are relatively rare and can be pre- forecasts or in effects of selected predictors
specified)
Non-additivity is expected to be strong and can’t be
The sample size isn’t huge isolated to a few pre-specified variables
One wants to isolate the effects of “special” variables such The sample size is huge
as treatment or a risk factor
One does not care that the model is a “black box”
One wants the entire model to be interpretable and
ethically tractable
20
Source: F. Harrell Regression BlogMachine learning – additional resources
Highly recommend the following textbook if you want to learn more:
◦ Applied Predictive Modeling by Max Kuhn and Kjell Johnson
Others:
◦ An Introduction to Statistical Learning by James, Witten, Hastie, and Tibshirani
◦ The Elements of Statistical Learning by Freidman, Tibshirani, and Hastie
Other good readings:
◦ Leo Breiman. "Statistical Modeling: The Two Cultures (with comments and a rejoinder by the author).”
Statistical Science, 16(3) 199-231 August 2001. https://doi.org/10.1214/ss/1009213726
◦ https://www.fharrell.com/post/stat-ml/
21A survey of big data
contexts
22Big data from “wearables”
Wearables are sensors worn on the body (e.g. on the wrist)
Measure accelerometry at the sub-second level, generating massive amounts of data
Dimension reduction, ML, and AI used to aggregate this data into useful (meaningful) quantities,
such as activity counts, sedentary behavior, steps, gaits, sleep quality, and more.
Scientific Questions
◦ Physical activity and health
◦ Example: 6-minute walk distance. More informative from clinic, or from wearable?
◦ Epidemiology of aging
◦ Circadian rhythms
◦ Sleep duration, quality
Seth Creasy, Julia Wrobel, and Andrew LeRoux will be doing a CCTSI big data seminar for
wearables data this Spring.
23Big data and mHealth
mHealth is a similar but slightly more general context than wearables data, encompassing the
use of all mobile telecommunication and multimedia technologies in health care delivery.
Such technologies often allow for granular (e.g. household-level) surveillance related to disease
transmission, outbreak detection, and identifying household or genetic risk factors.
Commonly available variables: location/movement, time (frequency), health readings (e.g. from
wearables, but also things like user-recorded images, sound, and symptoms), distance/proximity
to other devices
Scientific questions of interest (examples):
◦ Healthcare worker + patient movement in a healthcare setting
◦ Covid-exposure detection (alerts)
◦ Diabetic foot surveillance (at-home detection of foot ulcers) (Anthony et al. 2020)
24Big data and mHealth – Kinsa smart
thermometer example
Kinsa developed a thermometer (& smartphone app) which they made
commercially available across the US
◦ Temperatures stored on device and uploaded to cloud anonymously
◦ Users have profiles with basic health information, and can report other
symptoms (cough, sore throat, etc)
We wanted to see if these measures helped “nowcast” flu incidence in
the US, compared to the CDC’s influenza-like illness measure which is
commonly treated as the gold standard.
Highest correlation Lowest correlation
Miller, Peterson et al. (2019) 25Big data and mHealth – Kinsa smart
thermometer example
During the flu season, squared forecast errors
decreased by 43% (95% CI: 35-50)
The baseline model missed the peak of
influenza season by an average of 2.5 weeks,
whereas models incorporating Kinsa data
missed the peak by about 1.5 weeks.
There were only 3 states where model
performance did not improve with the
thermometer readings: Montana, Oklahoma,
and Utah.
In 12 states, the optimal model’s SE declined
by more than 60% when thermometer data
incorporated.
Miller, Peterson et al. (2019) 26Research insights from Wearables, mHealth
The Datenspende study; Radin et al 2020
◦ German study acquired anonymous wearable data at a large scale (over 500K participants)
◦ Researchers used wearable data to calculate the regional probability of COVID-19 outbreaks
incorporating individual data on pulse, physical activity (PA), and sleep.
The Apple Heart Study; Perez et al. 2019:
◦ 400K+ participants, Apple smartwatch
◦ Showed that wearable devices may detect atrial fibrillation (AF)
◦ Generated electrocardiograms with wearable ECG patch
Other examples:
◦ electrolyte monitoring for cystic fibrosis (Choi et al. 2018) or training management (Relf et al. 2019)
◦ measurement of continuous noninvasive blood glucose (Caduff et al. 2018)
◦ Wearable smart inhalers and activity trackers for asthma monitoring can predict uncontrolled asthma
(van der Kamp et al. 2020)
Huhn et al 2022 scoping review 27Big data – administrative data
Lots of data are collected routinely by organizations: financial data, claims, billing, in addition to EHR
data.
Such “administrative” data are not typically collected for the purposes of research, but still can be
utilized to answer interesting questions related to research.
Allows for extremely large sample sizes (high-n), typically easy and/or cheap to acquire
Tend to be well-documented, facilitating data management (still hard given massiveness of data).
Important to consider many possible sources of bias!
Examples:
◦ Medicare/Medicaid data
◦ Premier data
◦ Census data
◦ National Health and Nutrition Examination Survey (NHANES)
◦ Healthcare Cost and Utilization Project (HCUP) data contains rich information on national and state-level
healthcare utilization, access, quality, charges, and outcomes
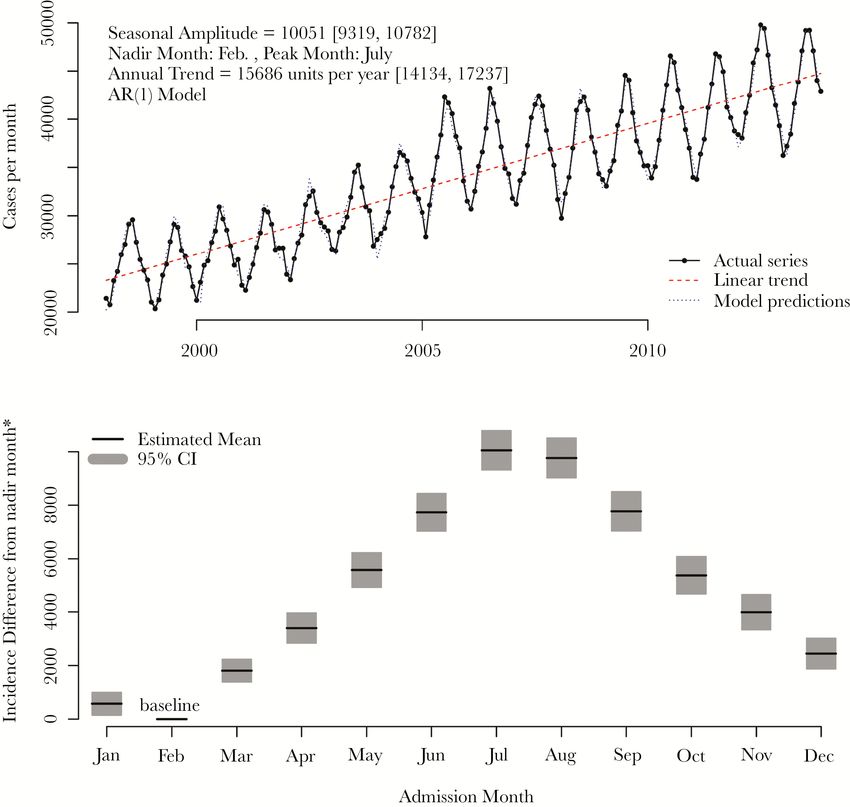
28Big administrative data – SSI seasonality
Surgical site infections (SSIs) after total knee (TK) and total
hip arthroplasty (THA) are devastating to patients and
costly to healthcare systems.
Are SSIs seasonal?
Let’s find out with HCUP’s National Readmission Database.
>760K procedures over 2 years
Adjusted SSI incidence 24% higher in June vs December
Nadir Peak, Odds Estimated Estimated
Ratio (95% CI) Nadir Month Peak Month
TKA 1.305 (1.201-1.418) December June
THA 1.19 (1.091-1.298) January July
Pooled 1.237 (1.164-1.314) December June
Anthony, Peterson et al. 2018 29Big administrative data – cellulitis
HCUP’s National Inpatient Sample is bigger
than the NRD (more years available), and is
meant to be nationally representative.
We used data from 1998-2013 to show that
hospitalizations for cellulitis, a skin infection,
have increased dramatically in incidence and
associated costs.
We also showed that incidence was seasonal,
which had previously been unknown.
Methods: extract counts of cases by month,
then model as a time series
◦ Efficient for > 5 million records
Peterson et al, 2017 30Big data context: Electronic Health Records
The EHR consists of clinic notes, medications, labs, demographics, registries, vitals, billing codes,
outpatient encounters, and more.
Databases live as either structured (e.g. ICD-codes), semi-structured (e.g. medications/dosage),
or unstructured text (clinical notes).
Our campus has an EMR repository and many resources available for working with this data:
◦ Health Data Compass: www.healthdatacompass.org
◦ Colorado Center for Personalized Medicine Biobank: www.cobiobank.org
◦ CIDA: coloradosph.cuanschutz.edu/research-and-practice/centers-programs/cida
◦ D2V: https://medschool.cuanschutz.edu/accords/about/d2v
Laura Wiley will be presenting on this topic next month at a big data seminar!
31EHR data example – Simon et al. 2021
“Harmonized” EHR data can be used to build machine learning
models that can be directly used during clinical care.
N ≈ 35K patients at risk for drug-induced QT prolongation using the
UCHealth EHR, with p ≈ 6500 features derived from the harmonized
EHR data
◦ Included medications, procedure codes, diagnosis codes, labs, and
demographic data
Analyses utilized 96 CPUs and 620 GB of RAM (Google Cloud
platform).
Deep neural networks were found to best predict the outcome,
achieving an out-of-sample AUC of 0.71 (FPR = 28%, FNR = 30%).
Source: Cleveland Clinic
32Additional big data contexts in research
Big data in the COVID-19 pandemic response
◦ See Tell Bennett’s big data seminar from last year (https://youtu.be/5-PbrKyCZRE)
◦ See also Debashis Ghosh’s big data seminar in 2020 (https://youtu.be/QSpjhpiiwsk), where he also
describes biases and ethics of big data
Omics
◦ Stay tuned for Katerina Kechris will discuss this context in March 2023 in a big data seminar!
Imaging
◦ Fuyong Xing and Antonio Porras will discuss this context in April 2023 for a big data seminar
Evidence synthesis
◦ Tianjing Li and Lisa Bero gave a big data seminar in 2020. Here is a link to their slides.
Wearables, and EHR data will also be covered in more depth this year.
33Big data and registries: new frontiers?
Increasingly, patient registries and large cohort studies are being augmented with data from
other big data contexts. Examples:
◦ SEER-Medicare: a cancer registry (35% of all cancer patients) linked to Medicare data
◦ All of Us: a disease agnostic cohort study gathering data from wearables (heart rate, physical activity,
sleep, and more) as well as social determinants of health, family health history, health care access, etc.
◦ PROGRESS: combines wearable data with electronic health records, biosamples, and patient generated
data to identify what influences how your body responds to food.
◦ NCDB: 70% newly diagnosed cancer patients linked with >34 million historical records
◦ The UK Biobank study (>80K subjects with granular wearable data, genetic data, and outcomes)
34Personalized medicine
Personalized medicine is a type of healthcare in which treatments of patients are tailored to
individuals based on the person’s genetic makeup (biology), lifestyle, and medical history.
What big data contexts are involved with these individual factors?
◦ Many of them! EHR, wearables, ‘omics, mHealth, imaging, more?
How can these data sources be used and streamlined for personalized medicine?
Data harmonization and integration are critical to this endeavor.
With a vast amount of data available on patients, ML/AI tools can be utilized to predict how a
person will respond to different treatments.
Who is ultimately accountable for personalized medical treatment decisions informed by ML/AI?
35Ethical Considerations
MORE QUESTIONS THAN ANSWERS
36Hotpot.ai: “privacy”
Ethics for Big Data – Privacy
Is privacy of individuals maintained with big data?
The trade-off between privacy and variety of data
◦ Is it possible to de-identify high-dimensional data?
Without losing valuable information?
◦ Is it possible to de-identify location data?
Who can access the stored big data?
Further reading:
◦ https://www.theperspective.com/debates/businessandtechnology/the-perspective-on-big-data/
◦ https://hbr.org/2012/08/dont-build-a-database-of-ruin
◦ https://journalofbigdata.springeropen.com/articles/10.1186/s40537-016-0059-y
◦ Risk mitigation for synthetic data sets:
https://unece.org/fileadmin/DAM/stats/documents/ece/ces/ge.46/2017/3_risk_mitigation.pdf
37Ethics for big data – algorithmic bias
According to this article, Proctorio (a popular service which has a contract with the University of
Colorado) watched its business grow 900% after campuses began closing due to the COVID-19
pandemic.
These programs use supervised ML in a variety of ways to proctor exams by various means,
including:
◦ Using facial recognition to match the person taking the exam on Zoom to the ID of the student enrolled
in the class,
◦ Creating flags for review if cheating is suspected based on eye-tracking
◦ Following web-traffic to monitor sites utilized during the exam,
◦ Etc…
After learning how these ML methods are trained, what to you think about the idea of
institutionally implementing this “auto-proctor” system?
38Ethics for big data – additional concerns
Selection and Sampling Bias
◦ Researchers may very precisely answer the wrong question
◦ Biased data sets will have limited generalizability, even with massive sample size
◦ Example: 2013 Boston pothole detection
◦ Used smartphone app to detect potholes using GPS and accelerometers
◦ People in lower-income groups less likely to have smartphone
◦ Which potholes will be patched?
Transparency: How can we build trust in (black-box) ML/AI systems when we don’t understand
how they work?
Who are the stakeholders of big data? Who is accountable for ML/AI systems (ultimately)?
39Summary
A large value proposition for big data in biomedical settings is in the prospect of personalized
medicine.
Health and its determinants are extremely multifaceted. They require an extremely high
dimensional set of variables to measure accurately
New technologies are producing massive amounts of data from large, diverse populations.
New insights are occurring at a rapid rate from imaging, wearables, ‘omics, administrative data,
EHR, mHealth, and more big data contexts
Research increasingly requires interdisciplinary teams with both data scientists, clinicians, etc.
ML/AI systems can be beneficial, but transparency, bias, and trust are important considerations
in their application, since those ultimately accountable for decisions made in personalized
medicine are patients themselves.
40You can also read