Agriculture Quarterly Update | - Q1 2022 - MNP
←
→
Page content transcription
If your browser does not render page correctly, please read the page content below
Agriculture
Quarterly Update | Q1 2022

                             MNPCF.ca
Industry Overview
M&A Transactions & Performance

                                                            Agriculture M&A Transactions

                25,000                                                                                          200

                20,000                                                                                          160

                                                                                                                      (# of Transactions)
(in $CAD Millions)

                     15,000                                                                                     120

                     10,000                                                                                     80

                     5,000                                                                                      40

                          -                                                                                     -
                               Q2 Q3 Q4 Q1 Q2 Q3 Q4 Q1 Q2 Q3 Q4 Q1 Q2 Q3 Q4 Q1
                              2018 2018 2018 2019 2019 2019 2019 2020 2020 2020 2020 2021 2021 2021 2021 2022

                                               Transaction Value                    Transaction Volume

                                                     M&A Market Update – Q1 2022

• M&A activity in the North American agriculture industry has slowed in Q1 2022, with 97 total transactions, trailing
  Q4 2021 which had 104 transactions. Total transaction value of publicly disclosed transactions in Q1 2022
  exceeded $1.0 billion which lagged behind Q4 2021 of $5.7 billion.

• A vast majority of transactions in the agriculture landscape in Q1 2022 were in the food products sub-sector,
  which comprised 78.4% of the disclosed transactions. There was also notable deal volume in the agricultural
  services, fertilizers and agricultural chemicals, and agricultural farm machinery sub-sectors.

• M&A activity in Q1 2022 was predominantly driven by industry operators (i.e. strategic buyers) who accounted for
  the vast majority of total deal volume during the period. However, private equity buyers still remain active and
  are closing deals with ample capital to deploy.

• The largest disclosed transaction in Q1 2022 was Swedencare’s acquisition of The Garmon Corporation for $590
  million, accounting for 51.6% of the total publicly disclosed transaction value in the quarter.

• Farmland values continued to increase in 2021, with a national average increase of 5.2%, in line with the increase
  in 2020. Q1 2022 still saw persistently low interest rates and growth in land values.

Source: Capital IQ, data as of March 31, 2022; FCC Farmland Values Report – 2021.                                    Page 2
Macroeconomic Indicators

Key Drivers
Key drivers affecting farm land values in Canada include farm cash receipts, interest rates, and agriculture industry
performance, which is impacted by commodity prices, growing season conditions, and macro-economic factors.
Farm cash receipts grew 20.0% year-over-year from Q4 2020 to Q4 2021, representing the most recent quarterly
information available. The Bank of Canada prime rate averaged 2.45% throughout 2021, representing near historic
lows, however interest rates were increased in Q2 2022 with additional rate hikes contemplated.

                                            Farm Values vs. Farm Cash Receipts and Interest Rates
                          7%                                                                                                   4,500                   90

                                                                                                                                   Value ($CAD/acre)
                                                                                                                               4,000                   80

                                                                                                                                                            Farm Cash Receipts
Prime Interest Rate (%)

                          6%
                                                                                                                                                       70

                                                                                                                                                              ($CAD Billions)
                                                                                                                               3,500
                          5%                                                                                                                           60
                                                                                                                               3,000
                          4%                                                                                                   2,500                   50
                          3%                                                                                                   2,000                   40
                                                                                                                               1,500                   30
                          2%
                                                                                                                               1,000                   20
                          1%                                                                                                   500                     10
                          0%                                                                                                   -                       -
                               2001              2006                2011                     2016                2021
                                      Bank of Canada prime rate average           Value per acre of farm land and buildings (Canada)                                             1
                                                                                                                                               1
                                      Farm Cash Receipts (Canada)                 Projected value per acre of farm land and buildings (Canada)

Commodity Price Changes and Farm Input Price Index Costs
Average commodity prices have seen sharp increases over the last 12 months, with continued gains in Q1 2022,
driven by global supply challenges which have been impacted by uncertainties associated with the war in Ukraine,
low supply, and strong demand.
The Statistics Canada Farm Input Price Index (FIPI) estimates the change in price that farmers pay for inputs in their
farming operation through time. The FIPI has continued to increase in recent months, displaying a year-over-year
increase of 11.3% from Q4 2020 to Q4 2021.

                                                              Crop Commodity Prices
                      1,500                                                                                                                            140
                                                                                                                                                                   Farm Input Price Index*
                      1,250                                                                                                                            135
                      1,000                                                                                                                            130
CAD/MT

                          750                                                                                                                          125
                          500                                                                                                                          120
                          250                                                                                                                          115
                            -                                                                                                              110
                            Feb-20      May-20       Aug-20       Nov-20       Feb-21         May-21     Aug-21       Nov-21          Feb-22

                                        Wheat - excl. durum                  Durum                                 Barley
                                        Soybeans                             Grain corn                            Flaxseed
                                        Canola                               Lentils                               Dry peas
                                        Farm input price index*

 *December 2021 is the most recent data available at the time of this report’s preparation.
 Source: Stats Canada. Farm cash receipts information is not available for Q1 2022.
 1: Based on historical growth from 2020 to 2021.                                                                                                                Page 3
Inputs and Commodity Markets
Market Pressure, Futures & Exports

 Commodity Price Highlights                                                                                        Commodity Price Changes

 Prices have continued their upward surge into Q1                                                                                  LONG-TERM*            SHORT-TERM**
 2022, with all commodities detailed in the                                Durum                                                      +130.5%                   +11.0%
 adjacent listing showing positive gains over the                          Flaxseed                                                    +96.4%                  +21.9%
 short term and long term, respectively. Price                             Dry peas                                                    +84.1%                  +20.6%
 increases over these periods are driven in part by
                                                                           Canola                                                      +62.7%                  +26.3%
 supply shortfalls due to environmental conditions
 and stronger-than-expected global demand.                                 Lentils                                                     +55.9%                   +5.2%
                                                                           Barley                                                      +35.0%                  +10.8%
 Durum, flaxseed, dry peas, canola and lentils have
                                                                           Soybeans                                                    +19.5%                  +20.8%
 all shown significant increases of 50% or greater
 over the long term.                                                       Grain corn                                                  +14.5%                  +13.3%

 Commodity Price Futures                                                                                                 Commodity Futures Pricing1
 Quoted prices for spring 2022 futures contracts                                                        1,800
 for most of the aforementioned commodities are
                                                                           Price per weight ($)

 higher than futures in the previous quarter                                                            1,500
 resulting from strong export demand and                                                                1,200
 prospective increases in overseas demand.
                                                                                                         900
 The futures prices for wheat, corn, and soybeans
 showed strong growth of 30.6%, 22.0% and                                                                600
 14.6%, respectively, whereas oats experienced                                                           300
 modest growth of 2.9%, from Q4 2021 to Q1 2022.
                                                                                                            -
 Canola and live cattle showed decreases of 6.3%                                                                         Winter (Q4 2021)            Spring (Q1 2022)
 and 2.8% in their future prices this quarter,
 respectively.                                                                                                  Canola                Wheat                    Soybeans
                                                                                                                Corn                  Oats                     Live Cattle

 Crop Exports                                                                                                    Canada's Principal Crops Exports2
 Canadian principal field crop exports in the 2022-                                                     60,000            57,692
                                                                            Exports (Thousand Tonnes)

 2023F period are forecasted to increase 36.5%                                                                            6,784                              50,110
 over the 2021-2022F total.                                                                             50,000
                                                                                                                                                             5,900
 Grains and oilseeds exports are forecasted to                                                          40,000                              36,702
 increase 37.6%, while pulses and special crops are                                                                                         4,580
                                                                                                        30,000
 forecasted to increase 28.8% between the 2021-                                                                           50,908
 2022F and 2022-2023F periods.                                                                          20,000                                              44,210
                                                                                                                                            32,122
                                                                                                        10,000

                                                                                                            -
                                                                                                                     2020-2021         2021-2022F         2022-2023F
                                                                                                         Total Pulses and Special Crops        Total Grains and Oilseeds
 “F” indicates Forecast.
 *Change over the twelve months ended February 2022.
 **Change over the three months ended February 2022.
 Source 1: Capital IQ. Data as of March 31, 2022.
 Source 2: Agriculture and Agri-Food Canada, Outlook for Principal Field Crops. March 18, 2022 update.                                                                Page 4
Select Recent M&A Transactions

                                                       • Pfingsten Partners (“Pfingsten”) is a private equity firm that primarily
                                      Closed             invests in manufacturing, distribution and business service companies.
                                      January
                                                       • Fairbank Equipment Holdings Inc. (“Fairbank”) is a leading specialty
                                       2022
           acquired                                      distributor and dealer of agricultural equipment and component add-
                                     Industry            ons.
                                    Agriculture        • The closed acquisition will support Fairbank’s growth strategy as
                                    Equipment            Pfingsten will provide continued investment in digital infrastructure, and
                                                         product and geographic expansion.

                                      Closed           • The Mosaic Company (“Mosaic”) mines and processes phosphate and
                                     February            potash minerals into crop nutrients. Mosaic is the largest producer of
                                       2022              potash and phosphate fertilizer in the United States.
                                                       • Plant Response develops agricultural technologies designed to reduce
                                    Industry
           acquired                                      botanical stress and improve plant growth.
                                    Fertilizers
                                       and             • Mosaic’s closed acquisition of Plant Response complements the
                                   Agricultural          company’s market access to key agricultural geographies and industries
                                   Chemicals             within the agricultural biotechnology space.

                                                       • Kinperium Industries (“Kinperium”) is a family office that invests in long-
                                                         term sustainable businesses with strong management teams and
                                                         potential for growth.
                                       Closed
            acquired                                   • K-Tec Earthmovers (“K-Tec”) headquartered in Rosenort, Manitoba,
                                      February
                                        2022             manufactures efficient earthmoving scrapers for construction and
                                                         mining sites around the world.
                                     Industry          • Ashland Industries (“Ashland”) produces advanced dolly wheel, direct
               and                  Agriculture          mount, and dump-style scrapers for the compact, agriculture, and
                                    Equipment            industrial construction markets.
                                                       • The closed acquisition will provide capital to both K-Tec and Ashland,
                                                         allowing both brands to implement their long-term growth strategies.

                                                       • Lake Country Co-op and Prairie North Co-op are member-owned co-
                                       Closed            operatives with several locations throughout communities in North
                                      February           Central Saskatchewan.
                                        2022
                                                       • Paragon Ag Services (“Paragon”) is an independent ag retailer
    Lake Country and                 Industry            providing regional farmers with crop protection products, dry fertilizer
      Prairie North                  Fertilizers         and anhydrous ammonia.

           acquired                     and            • Lake Country Co-op and Prairie North Co-op acquired Paragon’s three
                                    Agricultural         Saskatchewan retail ag sites and two anhydrous ammonia locations,
                                    Chemicals            allowing both businesses to increase their presence in the market place.

Source: Capital IQ, PR Newswire, K-TEC company website, InformaConnect, SaskToday                                              Page 5
Public Comparable Analysis
Trading Multiples & Operating Statistics

(Figures In $CAD Millions, except percentages and ratios)                                                                     LTM Operating Figures
                                                                        Market      Enterprise                                Revenue                        EBITDA
Company                                                              Capitalization   Value                Revenue            Growth           EBITDA        Margin
Nutrien Ltd.                                                               $71,442       $84,595           $33,992             34.0%           $8,714        25.6%
Archer-Daniels-Midland Company                                             $63,383       $75,721           $107,882            32.5%           $6,305         5.8%
Bunge Limited                                                              $19,746       $28,017           $74,856             42.9%           $5,467         7.3%
The Andersons, Inc.                                                        $2,108         $3,627           $15,960             56.4%            $478          3.0%
The Mosaic Company                                                         $30,578       $35,298           $15,638             42.3%           $4,732        30.3%
Ceres Global Ag Corp.                                                       $166             $321             $1,157            41.7%           $42           3.6%
Seaboard Corporation                                                       $6,095         $6,615             $11,679           29.5%           $1,057         9.0%
Median                                                                     $19,746       $28,017           $15,960             37.3%           $4,732         7.0%
Mean                                                                       $27,645       $33,456           $38,327             39.0%           $3,791        12.0%

(Figures In $CAD Millions, except percentages and ratios)                          NTM Consensus Estimates                                       Valuation

                                                                      Revenue        EBITDA          NTM          NTM                   LTM        LTM     LTM
Company                                                               Growth         Margin           EV        EV/EBITDA                EV     EV/EBITDA EV/REV
Nutrien Ltd.                                                              41.3%       36.4%         $83,217            4.8x         $84,595        9.7x        2.5x
Archer-Daniels-Midland (ADM) Company                                      7.8%        5.9%          $81,012        11.3x            $75,721        12.2x        .7x
Bunge Limited                                                             5.0%        4.6%          $29,464            7.9x         $28,017        5.2x         .4x
The Andersons, Inc.                                                       5.6%        2.5%          $3,729             8.7x         $3,627            7.7x      .2x
The Mosaic Company                                                        58.8%       34.9%         $34,855            4.0x         $35,298        7.6x        2.3x
Ceres Global Ag Corp.                                                     N/A          N/A           N/A               N/A              $321          7.7x      .3x
Seaboard Corporation                                                      N/A          N/A           N/A               N/A          $6,615         6.3x         .6x
Median                                                                    7.8%        5.9%          $34,855        7.9x             $28,017        7.7x         .6x
Mean                                                                      23.7%       16.9%         $46,456        7.4x            $33,456         8.1x        1.0x

Source: Capital IQ. Data as of March 31, 2022.
“LTM” refers to last twelve months. “NTM” refers to next twelve months.                                                                                        Page 6
Public Comparable Analysis
Growth, Margins & Multiples

                   LTM Revenue Growth                                                                    NTM Revenue Growth
    Seaboard Corporation                 30%                  Avg: 39.0%                  Seaboard Corporation                N/A – N/A – See1Note 1
                                                                                                                                    See Note

    Ceres Global Ag Corp.                42%                                              Ceres Global Ag Corp.               N/A – N/A
                                                                                                                                    See Note
                                                                                                                                        – See1Note 1

     The Mosaic Company                  42%                                               The Mosaic Company                  59%
        The Andersons, Inc.              56%                                                  The Andersons, Inc.                 6%      Avg: 23.7%

               Bunge Limited             37%                                                         Bunge Limited              5%
 Archer Daniels Midland                  32%                                           Archer Daniels Midland                     8%
                   Nutrien Ltd.          34%                                                             Nutrien Ltd.          41%

                                     0%        20%        40%         60%                                                  0%        20%        40%         60%

                     LTM EBITDA Margin                                                                      NTM EBITDA Margin
   Seaboard Corporation                 9%        Avg: 12.0%                            Seaboard Corporation                 N/A – See Note 1
   Ceres Global Ag Corp.                  4%                                             Ceres Global Ag Corp.               N/A – See Note 1

    The Mosaic Company                  30%                                              The Mosaic Company                                    35%
       The Andersons, Inc.                3%                                                The Andersons, Inc.               3%           Avg: 16.9%

              Bunge Limited            7%                                                           Bunge Limited               5%
              Archer Daniels…              5%                                         Archer Daniels Midland                      6%

                  Nutrien Ltd.          26%                                                            Nutrien Ltd.                                 36%

                                    0%      10% 20% 30% 40%                                                              0%      10% 20% 30% 40%

                              LTM EV/EBITDA                                                                  NTM EV/EBITDA
  Seaboard Corporation                 6.3x           Avg: 8.1x
                                                                                         Seaboard Corporation                 N/A – See Note 1
  Ceres Global Ag Corp.                7.7x                                              Ceres Global Ag Corp.                N/A – See Note 1
   The Mosaic Company                  7.6x                                               The Mosaic Company                 4.0x        Avg: 7.4x
      The Andersons, Inc.              7.7x                                                  The Andersons, Inc.              8.7x
              Bunge Limited            5.2x                                                          Bunge Limited            7.9x
Archer Daniels Midland                 12.2x                                                        Archer Daniels… 11.3x
                 Nutrien Ltd.          9.7x                                                             Nutrien Ltd.          4.8x

                                   0.0x 5.0x 10.0x 15.0x 20.0x                                                            0.0x 5.0x 10.0x 15.0x 20.0x

Source: Capital IQ. Data as of March 31, 2022.
“LTM” refers to last twelve months. “NTM” refers to next twelve months.
Note 1: Projected information for Seaboard Corporation and Ceres Global Ag Corp. has been labelled as “N/A” as limited information is available for those
companies.
Valuation details provided on page 6.                                                                                                                       Page 7
Public Comparable Analysis
Performance Analysis

                                         Peer Group EV/EBITDA Performance - LTM
                      20.0x

                      16.0x                                                                                                                      15.18x
EV/EBITDA Multiple

                      12.0x

                       8.0x                                                                                                                       8.86x

                       4.0x

                       0.0x

                                                                                                      1
                                                                S&P 500               Peer Group

                                           Peer Group Share Price Performance - Q1
                       50.0%
                      40.0%                                                                                                                     38.5%
                       30.0%
Index %

                       20.0%
                       10.0%
                            -                                                                                                                   -3.1%
                      (10.0%)
                     (20.0%)

                                                               S&P 500                Peer Group 1

                                     Peer Group Share Price Performance - LTM
                     100.0%
                     80.0%
                                                                                                                                                70.9%
                     60.0%
Index %

                     40.0%
                     20.0%
                                                                                                                                                12.7%
                          -

                                                                S&P 500              Peer Group       1

Source: Capital IQ. Data as of March 31, 2022.
1: Peer Group: Nutrien Ltd., ADM Company, Bunge Limited, The Andersons, Inc., The Mosaic Company, Ceres Global Ag Corp, Seaboard Corporation.
“LTM” refers to last twelve months.                                                                                                                Page 8
About Us

MNP Corporate Finance (MNPCF) has a dedicated team of over 100            Recently Closed Deals
M&A and due diligence professionals across Canada. MNPCF
works with clients in virtually all industries as they prepare, plan           (National)
and execute transactions.

Our typical transactions range in value between $3 million and
$300 million.

            Local and International Reach
MNP is a participating firm within Praxity, a unique global alliance of
independent accounting/advisory firms created to answer global
business needs. As a member of Praxity, we are able to offer access
to corporate finance, accounting and tax advisory services
worldwide. We are also affiliated with Corporate Finance Cross
Border, which consists of 250+ M&A professionals in more than 30
countries.

                              Services
           • Divestitures              • Due Diligence
           • Acquisitions              • Transaction Advisory
           • Debt Financing              Services

                                                                                             Page 9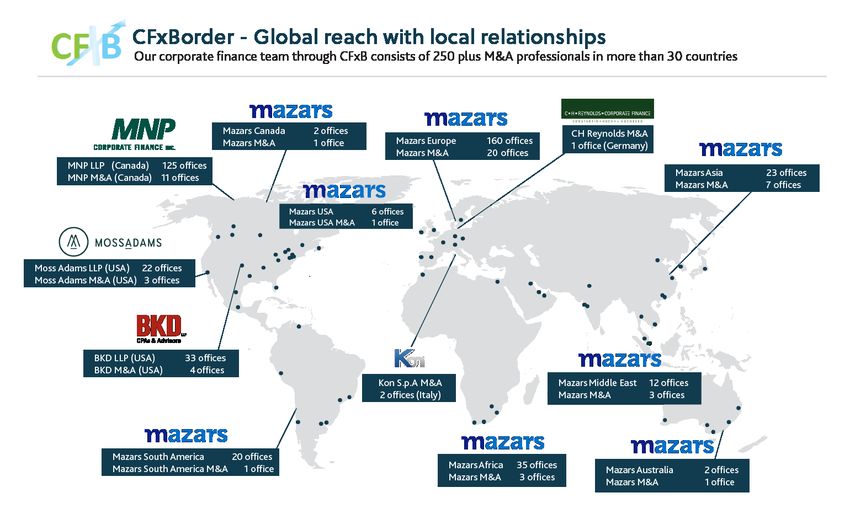
About Us

                       Deal Experience                                Recently Closed Deals
                                                                           (National)
Since our inception, our team has advised on hundreds of
transactions, in a wide range of industries with diverse enterprise
values. In the past eight years alone we have completed over 200
transactions worth over $3.5 billion (not including due diligence
engagements).

                    Industry Experience
      •   Food & Beverage                •   Transportation
      •   Retail & Distribution          •   Construction
      •   Manufacturing                  •   Software
      •   Agriculture                    •   Financial Services
      •   Automotive                     •   Technology
      •   Materials                      •   Energy
      •   Health Care                    •   Oilfield Services
      •   Pharmaceutical                 •   Real Estate

                    Hands-on Approach
Current M&A transactions require a hands-on approach from start
to finish including the active engagement of senior resources. Our
senior resources are dedicated to our clients and are available as
necessary and appropriate. We keep our clients regularly informed
of the engagement status, issues we are encountering, successes
and overall progress.

              Integrated Service Offering
We draw on the vast experience and deep specialist knowledge
network of our partners locally, nationally and internationally as
specialty issues arise, such as pre-transaction tax planning,
transaction structuring, estate planning, valuation, due diligence,
performance improvement and risk management.

                                                                                        Page 10
Leadership Team
Transaction Leadership
Brett Franklin Aleem Bandali Mark Regehr Mike Reynolds
President Managing Director Managing Director Managing Director
Winnipeg Vancouver Edmonton Calgary
Brett.Franklin@mnp.ca Aleem.Bandali@mnp.ca Mark.Regehr@mnp.ca Mike.Reynolds@mnp.ca
204.336.6190 778.374.2140 780.969.1404 587.702.5909
Erik St-Hilaire Stephen Shaw Dan Porter Kevin Tremblay
Managing Director Managing Director Managing Director Managing Director
Winnipeg Toronto Toronto Toronto
Erik.St-Hilaire@mnp.ca Stephen.Shaw@mnp.ca Dan.Porter@mnp.ca Kevin.Tremblay@mnp.ca
204.336.6200 416.515.3883 416.515.3877 647.943.4051
Jon Edgett Patrick Khouzam Jonathan Banford Éric Grondin
Managing Director Managing Director Managing Director Managing Director
Waterloo Montreal Chicoutimi Sherbrooke
Jon.Edgett@mnp.ca Patrick.Khouzam@mnp.ca Jonathan.Banford@mnp.ca Éric.Grondin@mnp.ca
519.772.7460 514.228.7874 418.696.3924 819.823.3290
Due Diligence Leadership
Jean-Raymond Lafond Craig Maloney Johnny Earl John Caggianiello
Managing Director Managing Director Managing Director Managing Director
Drummondville Halifax Vancouver Toronto
Jean-Raymond.Lafond@mnp.ca Craig.Maloney@mnp.ca Johnny.Earl@mnp.ca John.Caggianiello@mnp.ca
819.473.7251 902.493.5430 604.637.1504 416.513.4177
MNPCF.ca
Page 11You can also read