Advanced container inspection system based on dual-angle X-ray imaging method
←
→
Page content transcription
If your browser does not render page correctly, please read the page content below
Journal of Instrumentation

PAPER • OPEN ACCESS

Advanced container inspection system based on dual-angle X-ray
imaging method
To cite this article: C.H. Lim et al 2021 JINST 16 P08037

View the article online for updates and enhancements.

 This content was downloaded from IP address 46.4.80.155 on 10/09/2021 at 05:04
Published by IOP Publishing for Sissa Medialab
 Received: April 24, 2021
 Accepted: June 8, 2021
 Published: August 12, 2021

Advanced container inspection system based on
dual-angle X-ray imaging method

C.H. Lim, J. Lee, Y. Choi, J.W. Park ,∗ and H.K. Kim

 2021 JINST 16 P08037
 M1 international corp.,
 Daejeon, Republic of Korea
 Korea Research Institute of Ships and Ocean Engineering,

 Daejeon, Republic of Korea
 School of Mechanical Engineering, Pusan National University,

 Busan, Republic of Korea
 E-mail: poetwon@kriso.re.kr

Abstract: In 2007, the U.S. Congress mandated the implementation of the “Security and Account-
ability For Every Port Act of 2006,” which requires complete scanning of 100% of U.S.-bound
shipping containers. To address this requirement, we developed a container inspection method
that enables continuous high-speed screening, with considerable performance improvement. In
this study, we developed a fixed-type high-precision container inspection system using dual-angle
X-ray beams from a 9 MV linear accelerator (LINAC). We first calculated the X-ray irradiation
angle-dependent changes in the contrast-to-noise ratio (CNR) of the images via Monte Carlo sim-
ulation. Using the calculated CNRs, the primary and secondary angles of the X-ray beam were
set to 0◦ and 2.8◦ , respectively. A system based on the proposed dual-angle X-ray imaging tech-
nology was installed and evaluated by scanning a real cargo container truck. For the evaluation,
we designed test equipment based on the ANSI N42.46 report and examined the beam penetration
power, contrast sensitivity, spatial resolution, and wire detectability of the developed system. The
maximum penetration thicknesses for the primary and secondary angle beams were found to be
410 and 400 mm, respectively. At the primary beam angle, the contrast sensitivities were 1.52%
and 0.49% when the thicknesses of the steel plate were 80% and 50% of the maximum penetration
thickness, respectively. At the secondary angle, the sensitivities were 1.88% at 80% maximum
penetration thickness, and 0.5% at 50%. A line pattern formed by individual slits of 4.6 mm width
could be easily recognized in an acquired image. In addition, the developed system could clearly
identify a 1.6 mm diameter copper wire. Further, when a steel plate was added, the change in
the wire-recognition ability of the imaging system was found to be similar at both beam angles.
These results indicate that the developed system is suitable for container screening using a 9 MV
LINAC. Shapes that could not be identified from one beam irradiation angle could more accurately
be analyzed using images from two different angles.
Keywords: Detection of contraband and drugs; Inspection with x-rays
 ∗ Corresponding author.

 c 2021 The Author(s). Published by IOP Publishing Ltd on behalf of
 Sissa Medialab. Original content from this work may be used under the
terms of the Creative Commons Attribution 4.0 licence. Any further distribution of this https://doi.org/10.1088/1748-0221/16/08/P08037
work must maintain attribution to the author(s) and the title of the work, journal citation
and DOI.
Contents

1 Introduction 1

2 Materials and methods 3
 2.1 Concept of the dual-angle container inspection system 3
 2.2 Monte Carlo simulations of the dual-angle imaging system 4
 2.3 Construction of the dual-angle X-ray container inspection system 5

 2021 JINST 16 P08037
 2.4 Image quality evaluation 7
 2.4.1 The ANSI N42.46 report-based imaging performance evaluation methods 7
 2.4.2 Imaging performance test using Monte Carlo simulations 9
 2.4.3 Experimental implementation of the ANSI N42.46 report-based imaging
 performance test 10

3 Results and discussion 11
 3.1 Simulations of the contrast-to-noise ratio for image quality testing 11
 3.2 Image quality testing experiment 12
 3.2.1 Penetration power 12
 3.2.2 Contrast sensitivity 12
 3.2.3 Spatial resolution 13
 3.2.4 Wire detection 13
 3.3 Container images scanned by the dual-angle X-ray container inspection system 14

4 Conclusions 16

1 Introduction

To block the movement of illegal cargo through ports, many countries have applied and are con-
tinuously improving various systems and methods to secure information on port container logistics
and check the cargo inside these containers [1–5]. In the United States of America, incessant efforts
are being made to ensure the safety of all cargo containers brought into the country. The inspection
of 100% of incoming cargo containers, institutionalized through “Security and Accountability for
Every Port Act of 2006,” could not be fully implemented due to increased costs and diplomatic
issues [6, 7]; however, irrespective of the logistic flow- and financial loss-related difficulties, it is
imperative to examine all inbound cargo containers for security reasons [4, 8]. Thus, a suitable
inspection system or method is required that enables quick container screening without affecting the
flow of logistics. However, the high-speed container inspection system may decrease the accuracy
of the inspection results as well as require high construction costs. Therefore, to implement an
effective container inspection method, it is necessary to introduce a system that is not affected by

 –1–
the aforementioned limitations. For this reason, extensive research is currently being conducted to
develop automated cargo container inspection methods with improved accuracy [9].

 To increase the accuracy of container inspection, various methods have been proposed to
improve the inspection systems in existing facilities by applying image analysis training and assistive
technologies. In recent years, inspection technology using artificial intelligence has also been
developed to exclude human error and improve inspection efficiency and accuracy [8, 10, 11].

 To increase the probability of detecting abnormal objects in cargo containers, sophisticated
hardware technologies, in addition to the previously mentioned software technologies, need to be

 2021 JINST 16 P08037
developed. The representative method for precise inspection using X-rays is computed tomography
(CT), which provides 3D images of the inside of an object [12]. Consequently, some research groups
are investigating various methods for applying CT for container screening. However, to apply the
CT technique for inspecting the insides of large containers (20–40 ft), an inspection system that
includes a large-scale X-ray generator and imaging detection system and that is capable of acquiring
projection images while rotating at a high speed is required [13]. Such a large-scale system may
dramatically increase the initial installation and system operation costs. Moreover, the CT technique
requires a relatively long inspection time, as compared with the general one-way scanning method,
thereby increasing the container screening time, which can lead to financial drawbacks due to stagna-
tion in logistical flow. To overcome the above-mentioned disadvantages, few-view tomography [14]
and digital tomosynthesis [15] that are capable of acquiring a tomographic image of a region of in-
terest (ROI) may be used for container inspection. However, even these methods are not suitable for
large inspection systems owing to the longer scanning times and higher installation/operation costs.

 Therefore, although various accurate inspection methods are available, their associated techno-
logical limitations restrict their application in most commercial inspection systems, which generally
use traditional scanning technologies. Currently, cargo inside a container is scanned via fixed-type
scanners using X-rays both in the horizontal and vertical directions to increase the accuracy of the
screening [16]. Although this method has the advantage of increasing accuracy, it requires two sets of
image acquisition systems (two pairs of linear accelerator (LINAC) and linear detector array systems)
and a shielding facility to operate the two megavoltage (MV) LINACs [17]. Therefore, the relatively
high system construction costs and maintenance costs are the major disadvantages of this method.

 To mitigate the aforementioned limitations, we propose a relatively low-cost method that is
able to increase the accuracy of container inspection. Herein, we describe the implementation and
evaluation of a dual-angle X-ray container screening method that can acquire projection images
of the container from different angles by using a single LINAC. To examine the applicability of
the dual-angle X-ray container inspection method, we acquired projection images at various X-
ray beam angles (0◦ –5◦ ) using Monte Carlo simulations and calculated the contrast-to-noise ratio
(CNR) from the acquired projection images. The secondary beam angle of the proposed inspection
system was then determined from the simulation results. In addition, this paper describes the system
development and construction to verify the applicability of the proposed method and provides a
detailed discussion about the development of an effective evaluation device, its performance testing,
and the analysis of the projection images of a real container.

 –2–

2 Materials and methods 2.1 Concept of the dual-angle container inspection system 2021 JINST 16 P08037 Figure 1. Conceptual design of a container inspection system using the proposed dual-angle X-ray imaging method. ¬ 6/9 MV dual-energy LINAC based X-ray generator, first collimator, ® second collimator, ¯ third collimator and linear detector arrays, and ° container transporting device. As shown in figure 1, the dual-angle container inspection system consists of a 6/9 MV dual- energy LINAC-based X-ray generator (as designated by ¬ in figure 1), collimators (first, second, and third), linear array-type imaging detectors, and a transporting device for conveying a container vehicle. For the design of the system, the X-ray irradiation angle is set to -8.5◦ to 15◦ in the vertical direction, which is suitable for large container inspection, and the horizontal irradiation angle of the secondary X-ray beam is varied within the range from 1◦ to 5◦ . The range of the initial X-ray beam irradiation angle is set by the collimator inside the LINAC (¬). The first collimator (), which is installed at the front end of the LINAC, shapes the X-ray beam into those directing towards two different angular directions. The aligned second (®) and third (¯) beam-collimation systems are installed at the front and rear of the object, respectively, and each of them is designed to have two collimators for guiding the paths of the primary and secondary angle X-ray beams. Corresponding to the dual-angle X-ray beams, two sets of linear detector arrays, each of which provides an image of 1024 channels in the vertical direction with a pixel pitch of 4.6 mm, are placed behind the third collimation system. –3–

2.2 Monte Carlo simulations of the dual-angle imaging system

 2021 JINST 16 P08037
Figure 2. Schematic of the Monte Carlo-simulated container inspection system, which consists of a high
energy X-ray generator; first, second, and third collimators; an imaging detector arrays; and a container.
Dual-angle X-ray beams are collected by two sets of 32 (1024 pixels) detector modules.

 To evaluate the performance of the proposed inspection system at different X-ray beam angles,
a simulation model was developed and implemented using the Monte Carlo N-Particle Transport
Code — MCNP6.2 (Oak Ridge National Laboratory, TN, U.S.A.), as illustrated in figure 2. The
distance between the X-ray source and the detector was set to 1500 cm, and the distance between
the X-ray source and the center of the object was set to 1100 cm. To collimate the X-ray beam,
a total of three steel collimators were included in the beamline of the container inspection model.
The imaging detector for collecting the X-rays was composed of 32 pixels per module, which is
similar to a commercial detector system for general cargo container inspection devices, and each
pixel consisted of a CdWO4 scintillator with a depth of 30 mm. A total of 32 detector modules
completed the 1024-channel linear detector array. The simulation model was designed to allow the
installation of X-ray imaging detectors within a 1500 cm radius around the X-ray source.
 The LINAC-based X-ray generator produces X-ray photons by colliding electrons with a target.
The maximum energy of the generated X-rays cannot be higher than the voltage used to accelerate
the electrons. To perform the simulation, we modeled a 9 MV LINAC X-ray source using a 9 MeV
electron beam and a 2 mm thick tungsten target as shown in figure 3(a). The energy spectrum of
the generated X-rays is shown in figure 3(b).
 To measure the variations in the X-ray spatial distribution at different beam angles, we per-
formed a simulation for each X-ray irradiation angle using the F4 tally, which represents the number
of photons passing through each pixel. Figure 4 shows the corresponding values measured at the
pixels of the 1024 channels. This graph presents the change in the relative X-ray photon fluence (per

 –4–
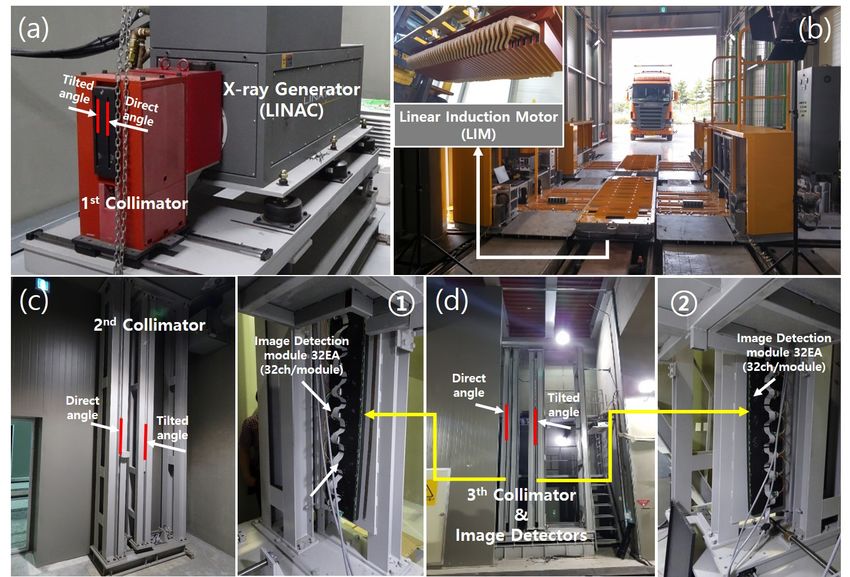
2021 JINST 16 P08037
Figure 3. X-ray generation process in LINAC and X-ray energy spectrum. (a) X-ray photons, generated
by colliding 9 MeV electrons with tungsten, are collimated by a tungsten collimator inside the LINAC and
are thus emitted within a limited angular range (within 0◦ –5◦ , horizontally). (b) In the generated maximum
9 MeV energy spectrum, a large number of photons were distributed in a relatively low energy region.

Figure 4. Simulation results for the X-ray spatial distribution, which varies with the X-ray beam irradiation
angle. The fluence of the secondary angle X-ray beam, which was tilted by 1◦ –5◦ relative to the primary
angle X-ray beam, was measured to be approximately within 97–64%, respectively.

pixel) distribution at different tilted secondary angles (1◦ –5◦ ) of the X-rays, relative to the results at
the primary X-ray angle (0◦ ). Evidently, the changing secondary beam angle, which varied from 1◦ to
5◦ , changed the relative fluence values of the beam to approximately 97%, 90%, 80%, 72%, and 64%.

2.3 Construction of the dual-angle X-ray container inspection system

As described above, we developed a container inspection system that could simultaneously acquire
two images from different viewing angles using a dual-angle X-ray beam. The LINAC and the
detector used for the system were Linatron®-Mi9TM and CIS9TM (Varex Imaging Corp., U.S.A.),
respectively. The LINAC, shown in figure 5(a), could generate X-rays with a maximum energy of

 –5–
9 MeV and operate at a dose rate of 30 Gy/min (at 1 m). The detector system was installed 1500 cm away from the source point of the LINAC, and 32 detector modules, each of which was composed of 32 pixels, were configured in an annular shape to maintain the same source-detector distance. 2021 JINST 16 P08037 Figure 5. Major components of the developed dual-angle X-ray container inspection system. (a) 6/9 MV dual-energy LINAC-based X-ray generator, including the first collimator, (b) container truck transportation device based on a linear induction motor, (c) second collimator, (d) third collimator and two independent 1024-channel detector arrays (¬ and ), forming the primary angle (0◦ ) and secondary angle (2.8◦ ) beam detection device, respectively. Dual-angle X-ray images were simultaneously acquired using the primary detectors (1024 channels), which were installed at 0◦ , and the secondary detectors (1024 channels), installed at 2.8◦ (installation angles were determined by the simulation results as shown in section 3.1). Each detector channel was composed of a CdWO4 (4 mm × 4 mm × 30 mm) scintillator. To minimize X-ray scattering, a tungsten-based anti-scatter vane with a thickness of 0.6 mm and length of 175 mm was employed between individual pixels in the detector arrays. To optimize the X-ray beam width, the first, second, and third collimators were installed in between the front of the LINAC and the front of the detector, as shown in figure 1. As shown in figures 5(a), 5(c), and 5(d), each collimator was designed to consist of two collimation slits to maintain the X-ray beam width at two different angles. To assess the dual-angle X-ray beam generation feature of the developed system, the system function was verified following the same procedure as reported in a previous study [18], in which a high-energy X-ray spatial dose measuring device was developed and investigated. The detection system for image acquisition was composed –6–
of detectors for the primary angle (as designated by ¬ in figure 5) and secondary angle () beams behind the third collimator, as shown in figure 5(d). Each detector contained 1 × 1024 pixel channels. As shown in figure 5(b), the developed container transportation device was driven by a linear induction motor and could move up to 1.5 m/s under a 70 ton load. 2.4 Image quality evaluation 2.4.1 The ANSI N42.46 report-based imaging performance evaluation methods 2021 JINST 16 P08037 Figure 6. Test object for the penetration power evaluation. The thickness of the steel plate is added until the evaluator does not recognize an arrow-type target object of 300 mm × 300 mm area, and the thickness of the target object is set to 20% of the steel plates. To evaluate the performance of the system from the operator’s point of view, the American National Standards Institute (ANSI) has proposed a suitable evaluation method [19]. An imaging performance evaluation was performed by measuring the beam penetration power, spatial resolution, contrast sensitivity, and wire detectability of the inspection system. Figure 6 illustrates the procedure for evaluating the penetration power of the system. Steel plates of 600 mm × 600 mm area were added in the beam path until it was impossible to recognize the direction of the arrow of an object having 300 mm width and height. The total thickness of the steel plates at which the object arrow becomes not to be perceived defines the maximum penetration power of the X-ray beam. The thickness of the arrow-type object was set to 20% of the thickness of the penetration steel plates, each of which was 10 mm thick, so that the additive steel plate thickness can be increased at equal intervals. The contrast sensitivity evaluation was carried out similar to the procedure for measuring the penetration power; however, in the contrast sensitivity evaluation, the thickness of the arrow-shaped object changed according to the maximum penetration thickness of the additive steel plates. In this procedure, the minimum thickness at which an arrow could be recognized at 10%, 50%, and 80% of the maximum steel plate thickness was ascertained. The quantitative value of the contrast sensitivity was indicated by the ratio of the thickness of the arrow to that of the additional steel plate. –7–
2021 JINST 16 P08037
Figure 7. Test object for spatial resolution evaluation. The spatial resolution of the system is equivalent to
the minimum width of a slit that the evaluator can recognize by using an object having slit patterns. The slit
width (p) of the test object was set to 4.6, 5, 10, 15, and 20 mm.

Figure 8. Test object for evaluating the wire detectability. The test object was composed of copper wires
of various diameters (1.6, 2.2, 3.2, 4.2, and 5.2 mm) that were designed in sinusoidal patterns. The wire
detectability of the system was evaluated using the test object’s projection image.

 An evaluation of the spatial resolution was performed by measuring the minimum size that
could be recognized in patterned steel slits having a certain period, as shown in figure 7, under the
condition that at least three repetitive patterns must be recognized. The steel pattern for measuring
spatial resolution was designed in five types (slit width 4.6–20 mm), having a thickness of 20 mm.
Here, the minimum size of the slit, 4.6 mm, is the same as the pixel size of the detector.

 –8–
The detectability of a wire in the projection image of an object was assessed by using an object
consisting of copper wires of 1.6–5.2 mm diameter designed with a constant sinusoidal (6 cycles)
pattern, as shown in figure 8. The detection ability was evaluated by adding steel plates of constant
thicknesses, at the back of the object, until the copper wires became invisible.
 In this study, all the test devices were designed and manufactured to perform the aforementioned
four experiments (penetration power measurement, contrast sensitivity evaluation, spatial resolution
examination, and wire detectability).

 2021 JINST 16 P08037
Figure 9. Contrast-to-noise ratio (CNR) calculation process. The CNR is calculated using the average
value and standard deviation in the area under individual ROIs of the target object and the steel plate in the
penetration testing image.

2.4.2 Imaging performance test using Monte Carlo simulations

The geometrical structure of the simulation model for acquiring an image was the same as that
described in subsection 2.2. To simulate the projection image, 1024-channel line images were
acquired by measuring the energy deposited in each pixel (CdWO4 scintillators) via MCNP6.1.
The obtained line images were then sequentially combined to create a single projection image.
 To select the optimal angle of the secondary X-ray beam, we obtained the projection images
for various beam angles via the previously described penetration power evaluation method and
analyzed them. The optimal angle was determined through CNR analysis of the images. Using the
projection images (400 mm steel plate + 80 mm object), acquired for various angles, the CNR of
the images was calculated using the method shown in figure 9, whereby the ROIs of the object and
steel plate parts were chosen, and the CNR was calculated using the average value and standard
deviation of each area under the individual ROIs.

 –9–
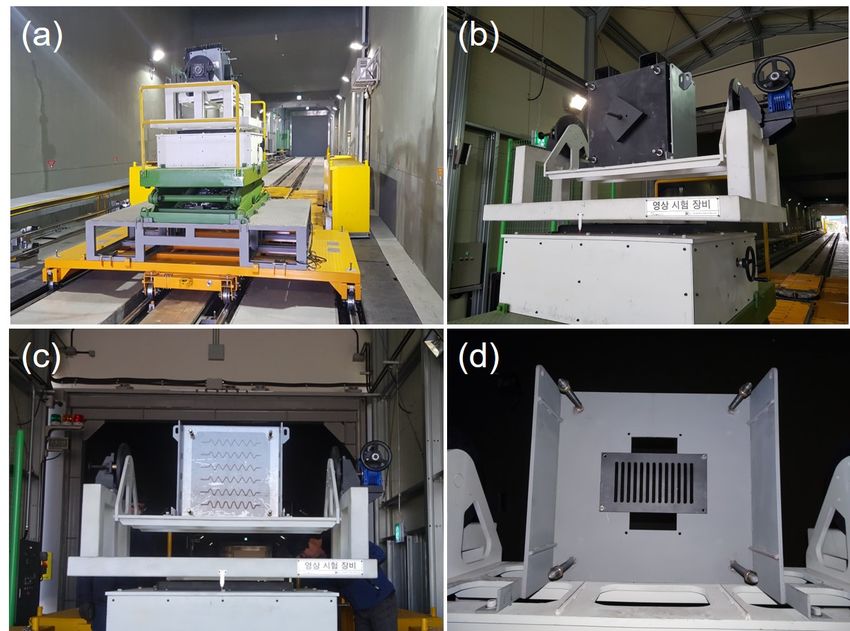
2.4.3 Experimental implementation of the ANSI N42.46 report-based imaging performance
 test

To evaluate the performance of the developed dual-angle X-ray container inspection system, the two
image acquisition systems and the evaluation object must be installed in a straight line. Therefore,
we fabricated an adjustable rotation and support device to keep the evaluation object and the X-ray
beam in a straight line, along with a transportation device for conveying the evaluation object, as
shown in figure 10.

 2021 JINST 16 P08037
 To evaluate the system performance, the LINAC’s X-ray generation pulse rate was set to 300
Hz and the speed of the transportation device was set to 0.33 m/s. Image acquisition was performed
using a straight X-ray beam (primary angle X-ray) and a 2.8◦ -tilted X-ray beam (secondary angle
X-ray), for which the projection image was acquired after rotating the test object by 2.8◦ .

Figure 10. Performance testing device for image evaluation of the dual-angle X-ray beam container inspection
system. (a) Test object support and dedicated transporting device for the system performance test, (b) test
object for penetration and contrast sensitivity test, (c) test object for evaluating the wire detectability, and (d)
test object for the spatial resolution test.

 – 10 –
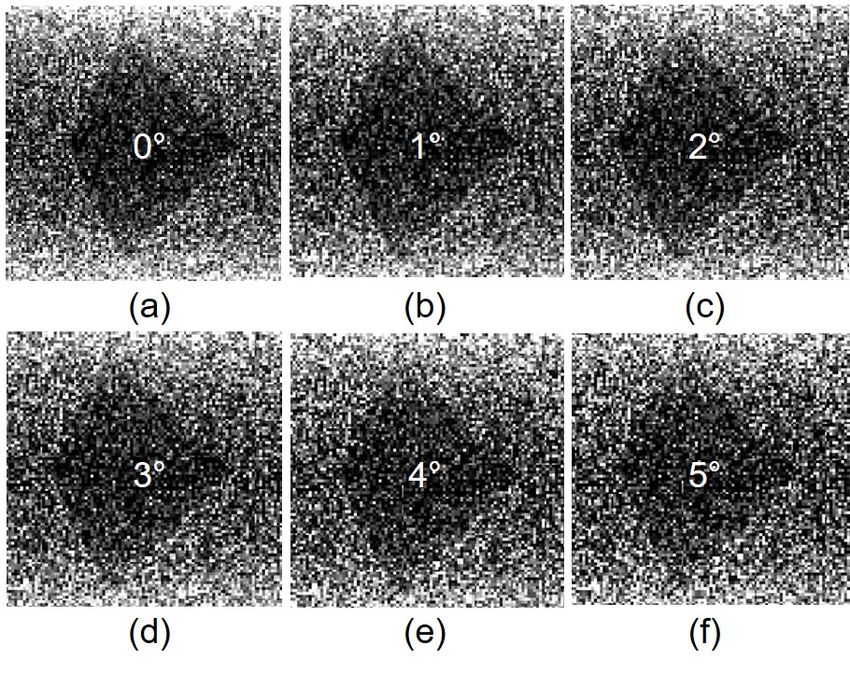
3 Results and discussion

3.1 Simulations of the contrast-to-noise ratio for image quality testing
Figures 11(a)–11(f) show the simulation results for each X-ray beam angle, from 0◦ to 5◦ . As
shown in the figure, it is possible to distinguish the arrow-shaped object at all angles; however,
the sharpness of the arrow decreases with the increasing X-ray beam angle, possibly because the
number of incident X-ray photons decreases as the X-ray beam angle increases. Thus, the standard
deviation of the images increase, thereby affecting the CNR of the image.
 Figure 12 shows the calculated CNRs for the simulated images as described in figure 9.

 2021 JINST 16 P08037
Evidently, the CNR decreases as the beam angle increases. The reduction rate of the CNR was
maximal between 2◦ and 3◦ beam angles. Therefore, it is appropriate to set the angle of the
secondary beam to approximately 2◦ . However, if the X-ray angle is too small, then the difference
between the acquired images at the primary and secondary X-ray angles is not clear, and thus the
inspection efficiency may be reduced. Therefore, in a real system, the secondary angle of the X-ray
beam should be set to the interval (2◦ , 3◦ ).

Figure 11. Projection images of test object acquired at various X-ray beam angles using Monte Carlo
simulations; (a)–(f) represent images acquired when the X-ray angle changes by 0, 1, 2, 3, 4, and 5 degrees,
respectively.

 – 11 –
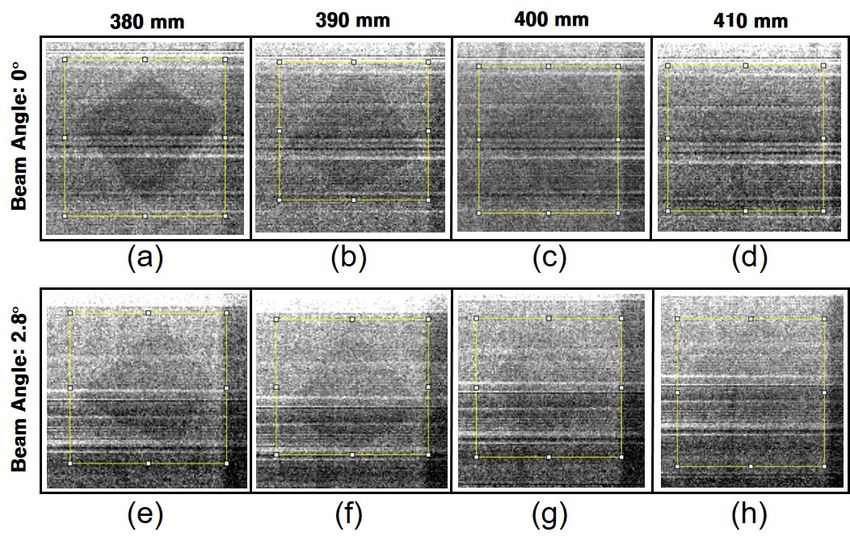
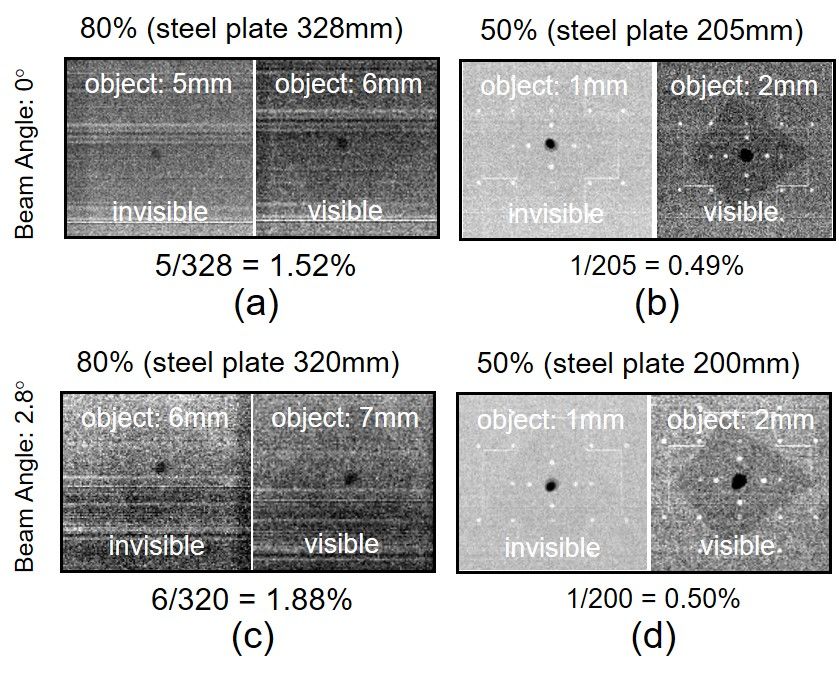
2021 JINST 16 P08037
Figure 12. Variation in the contrast-to-noise ratio (CNR) at different X-ray beam angles. The CNR shows a
relatively sharp decreasing trend between 0◦ and 3◦ . Beyond 3◦ , the CNR shows a gradual decreasing trend.

3.2 Image quality testing experiment
3.2.1 Penetration power
Figure 13 presents the scanned images acquired for the X-ray penetration test at the primary (0◦ ) and
secondary (2.8◦ ) X-ray angles, showing the projection image of a steel plate (having a thickness in
the range 380–410 mm, from left to right) with an 80 -mm thick arrow-shaped object. As shown in
the figure, when the beam angle is 0◦ , the object shape can be recognized at a steel plate thickness of
410 mm; however, at 2.8◦ , it can be recognized at a steel plate thickness of 400 mm. Therefore, the
maximum steel plate thickness is 410 mm at 0◦ and 400 mm at 2.8◦ , corresponding to a difference
of approximately 2.5%. These results indicate that the general requirement of a 400 mm thick steel
plate for penetration is satisfied by the inspection system developed in this study [20]. This further
confirms that both the primary and secondary angle X-rays had the necessary penetration power for
container inspection.

3.2.2 Contrast sensitivity
Contrast sensitivity is expressed as the ratio of the thickness of the object to that of the steel plate
when the object in the form of an arrow cannot be identified. Experimentally, the thickness of the
steel plate was set to 80%, 50%, and 10% of the maximum thickness of the steel plate, measured using
the penetration test. In this study, the contrast sensitivity was measured only for 50% and 80% of the
maximum thickness. For the 0◦ X-ray beam, the maximum steel plate thickness was measured as 410
mm; therefore, the thicknesses of the steel plates at 80% and 50% were set to 328 mm and 205 mm, re-
spectively. Figure 14 shows the detected images and their respective contrast sensitivity ratios when
the angle of the X-ray beam was 0◦ and 2.8◦ . As shown in the figure, for 80% and 50% of the max-
imum steel plate penetration thicknesses, the corresponding object thicknesses were approximately
5 mm and 1 mm, respectively, yielding contrast sensitivities of 1.52% and 0.49%, respectively. For
the 2.8◦ X-ray beam, the maximum steel plate thickness was 400 mm, whose 80% and 50% corre-
sponded to 320 mm and 200 mm, respectively. Thus, the maximum thicknesses of the object were 6

 – 12 –
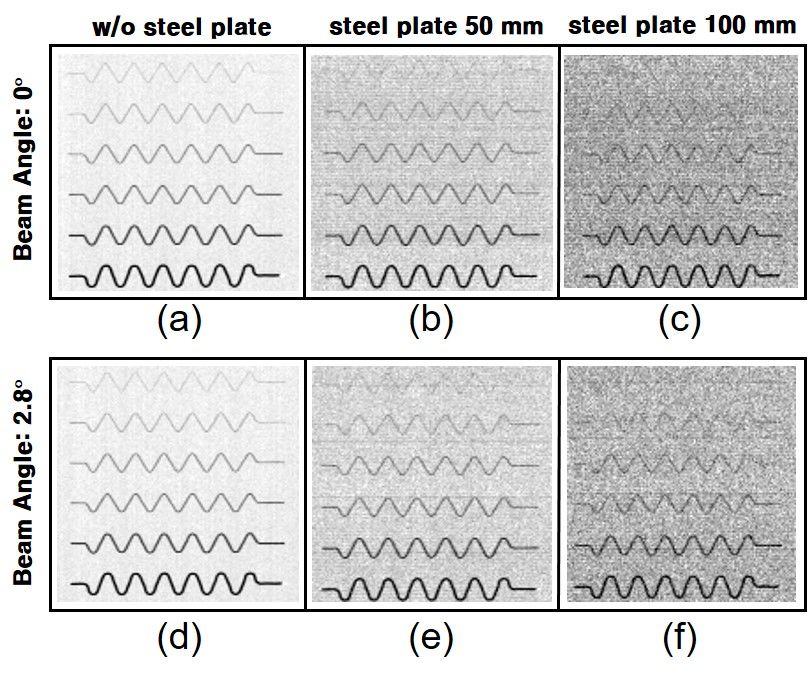
2021 JINST 16 P08037
Figure 13. Experimental results for assessing the penetration power using X-ray beams at 0◦ (primary) and
2.8◦ (secondary) angles. For the 0◦ X-ray beam angle, it is possible to recognize the shape of the target object
in the image with an additional steel plate of up to 410 mm thickness, as shown from (a) to (d). Contrarily,
for the 2.8◦ X-ray beam angle, the shape of the same target object can be recognized with an additional steel
plate of lesser thickness (400 mm), as shown from (e) to (h).

mm (80%) and 1 mm (50%), leading to contrast sensitivities of 1.88% and 0.50%, respectively. As
a result, these results meet the general 1–4% sensitivity requirement for container inspection [20].

3.2.3 Spatial resolution
Figure 15 shows the projection images of a line-patterned object with a slit width of 4.6–20 mm.
These images were obtained for measuring the spatial resolution in the vertical and horizontal
directions. Evidently, it is possible to recognize the line patterns in the images for a slit width of up
to 4.6 mm, which is equal to the pixel size of the imaging detector.

3.2.4 Wire detection
Figure 16 shows the projection images of the object containing patterned wires. These projection
images were obtained to evaluate the wire detection capability of the developed system at X-ray
beam angles of 0◦ and 2.8◦ . As shown in (a) and (d) of the figure, it is possible to recognize the
wires of all diameters at both 0◦ and 2.8◦ beam angles; when an additional steel plate of 50 mm
thickness was added to the beam path, images of the 1.6 mm diameter wire became blurred.
 These results show that the proposed dual-angle imaging method can detect wires having
diameters in the range of 1–3 mm, which is a typical wire thickness range easily detectable by a 9

 – 13 –
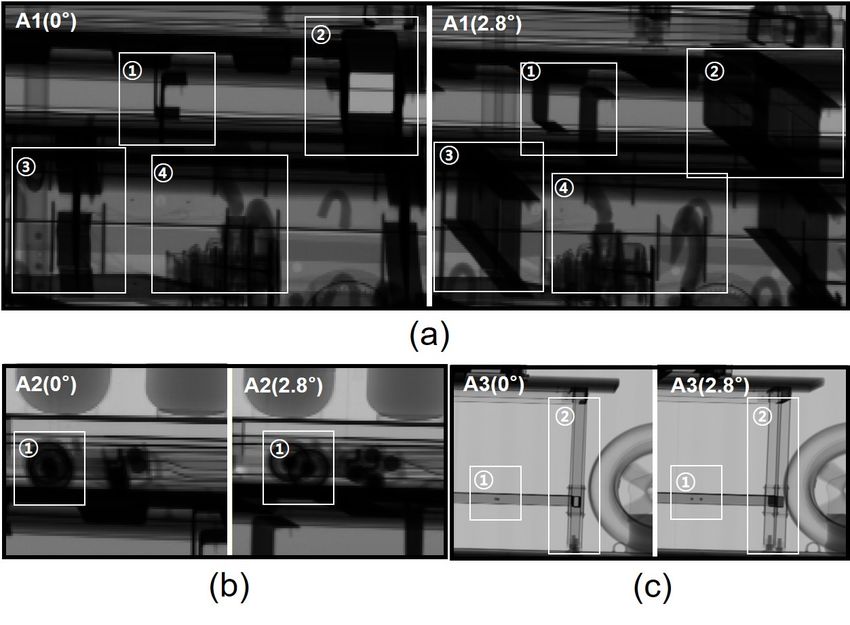
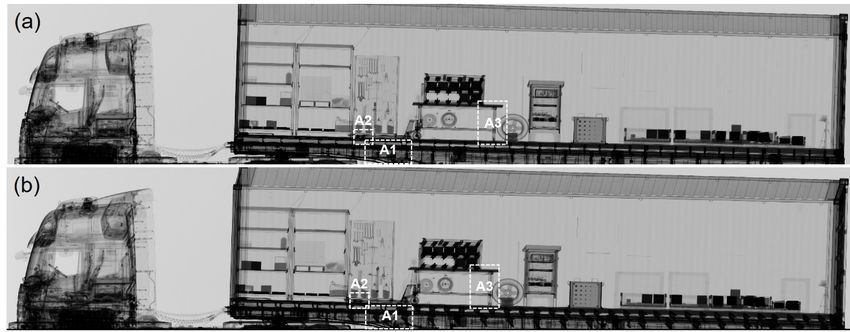
2021 JINST 16 P08037 Figure 14. Experimental results of contrast sensitivity evaluation using primary and secondary angle X-rays. (a) and (b) show the results of measuring the thickness of an arrow-shaped target object, which could be recognized when the steel plate was 80% and 50% of the maximum penetration thickness at the 0◦ X-ray beam angle, respectively. (c) and (d) show the results at the 2.8◦ X-ray beam angle. MV container inspection device [20]. At both X-ray beam angles, the shape of the 2.2 mm diameter wire pattern began to blur when the thickness of the additional steel sheet was 100 mm. Thus, the wire detection ability of the device appears to be similar at both X-ray beam angles. 3.3 Container images scanned by the dual-angle X-ray container inspection system We evaluated the image-acquisition performance of the developed dual-angle X-ray container inspection system by using it to scan a truck with a 40 ft container carrying various cargoes. The corresponding projection images, using both primary and secondary X-ray beams, are shown in figure 17. For the comparison of the two images, different ROIs were marked (A1, A2, and A3 in the figure) and individually enlarged to identify the differences. Figure 18 shows the enlarged images of each ROI, both for the primary and secondary X-ray beam angles. In figure 18(a), at 0◦ the object marked as zone ¬ appears as a single frame; however, in the secondary angle image, it is confirmed that two frames are overlapping here. In the case of zone , a simple rectangular structure is identified in the primary angle image, which fails to yield – 14 –
2021 JINST 16 P08037 Figure 15. Measuring the spatial resolution using dual-angle X-ray beams: projection images of a slit pattern. Slit patterns up to a 4.6 mm slit width, which is same as the individual pixel size of the imaging detector, can be recognized at both 0◦ and 2.8◦ X-ray beam angles. any information about the depth of the object. However, the image acquired by the secondary angle X-ray beam provides depth-direction information on the rectangular structure. The shape of the structure in zone ®, obtained via the primary angle X-ray beam irradiation, cannot be distinguished accurately. However, the same structural shape is confirmed as the I-beam by analyzing the image acquired via the secondary angle X-ray beam irradiation. Finally, in the case of zone ¯, the primary angle X-ray beam imaged objects are impossible to distinguish because of extensive overlapping — a limitation that is swiftly removed in the secondary angle image, which clearly shows a hook-shaped object. Similarly, figure 18(b) shows the enlarged ROI-A2 marked in figure 17. As shown in the figure, in area ¬ of the primary angle image, a single circular part can be recognized, and it is separated into two clearly defined circular parts in the corresponding secondary angle image. Likewise, the ROI-A3 in figure 18(c) shows a part of the table installed inside the container. Area ¬ in the primary angle image shows a single point, which resolves into two separate points in the secondary angle image. Similarly, area in the primary angle image displays a single frame, which is actually two overlapped frames, as identified in the corresponding secondary angle image. As described above, the dual-angle image has the advantage of complementing the shortcom- ings of the single-angle image, which is limited in distinguishing overlapping objects in the depth – 15 –
2021 JINST 16 P08037
Figure 16. Projection images of an object for evaluating the wire detection capability of the proposed
inspection system. (a) to (c) represent the images of the wire object acquired at a 0◦ beam angle, and (d)
to (f) represent those acquired at a 2.8◦ X-ray beam angle. For a 50-mm steel plate, the 1.6 mm diameter
wire begins to disappear in the image, whereas when the steel plate thickness is 100 mm, it is impossible to
recognize the wire of 2.2 mm diameter.

direction (x-ray irradiation direction). However, in this study, the secondary angle was determined
based on the rate of change of the CNR in the images according to the change in the angle, as
described above. Such a method is insufficient as a basis for determining an appropriate angle for
improving the depth resolution of the object. Therefore, to select the optimal secondary angle, it
is proposed to evaluate items according to the change in the view angle [21]. We plan to conduct
further research on selecting the optimal angle of the secondary detector line using various methods
in the future.

4 Conclusions

We developed a screening technology — a dual-angle X-ray imaging method — for scanning cargo
container trucks and conducted various performance tests to evaluate the real-life applicability of the
constructed inspection system. Prior to implementing the proposed container inspection method,

 – 16 –
2021 JINST 16 P08037 Figure 17. Projection image of a cargo container truck acquired via the developed dual-angle X-ray container inspection system (a) for a 0◦ X-ray beam angle and (b) for a 2.8◦ X-ray angle. Additionally, three ROIs, viz. A1, A2, and A3, were set for comparison of the acquired images. Figure 18. Comparison of the images, acquired at two different beam angles, by identifying the objects separately in different ROIs. (a) Comparative image (left 0◦ ; right 2.8◦ ) of a specific part (¬–¯) in ROI-A1. (b) Comparative image (left 0◦ ; right 2.8◦ ) of a specific part (¬) in ROI-A2. (c) Comparative image (left 0◦ ; right 2.8◦ ) of a specific part (¬, ) in ROI-A3. All ROIs are marked in figure 17. – 17 –
a Monte Carlo simulation model was established to simulate the device function under various
conditions. The X-ray irradiation angle-dependent changes in device performance were measured
within the angle range of 1◦ –5◦ . When the X-ray irradiation angle was changed from 1◦ to 5◦ , the
X-ray fluence decreased to approximately 94%, 86%, 77%, 72%, and 60%, as compared with the
dose at 0◦ . Therefore, as the number of incident X-ray photons decreased, the standard deviation of
the images increased, thereby decreasing the CNR. The reduction rate of the CNR was the highest
between the 2◦ and 3◦ X-ray beam irradiation angles, beyond which the reduction rate lessened.
This implies that an X-ray irradiation angle between 2◦ and 3◦ should be used.
 Based on the simulation results, a container inspection system using dual-angle X-rays was
developed, wherein the secondary angle of the X-ray beam was set to 2.8◦ . For the performance

 2021 JINST 16 P08037
evaluation of the developed system, an evaluation device and test objects were manufactured, and
imaging performance was examined by referring to the container inspection system evaluation
method provided in ANSI N42.46. Through the imaging performance evaluation, it was confirmed
that the difference in the results, measured via the primary and secondary angle X-ray beam
irradiations, was negligible and did not influence the container screening efficiency. The advantages
of the proposed inspection method were ascertained by applying the said method to inspect a real
cargo container truck. Furthermore, it was confirmed that some of the overlapped objects that were
difficult to resolve in the primary angle images were easily separated as individual objects in the
corresponding secondary angle images. These results are in line with the necessity of developing
an advanced and improved inspection system for accurate scanning of cargo containers. Based on
the outcomes of this study, we believe that the dual-angle X-ray container inspection technology
can help to further improve the accuracy of container cargo screening methods.

Acknowledgments

This research was supported by a grant from National R&D Project of “Development of auto-
matic screening and hybrid detection system for hazardous material detecting in port container
(20200611)” and “Research on fundamental core technology for ubiquitous shipping and logistics
(20088029)” funded by Korea Institute of Marine Science and Technology Promotion.

References

 [1] Y.K. Lim, J.W. Park and H. Min, Supply chain analytics for enhancing the maritime security, Int. J.
 Logist. Syst. Manag. 28 (2017) 164.
 [2] X. Zhao, H. Yan and J. Zhang, A critical review of container security operations, Marit. Policy
 Manag. 44 (2016) 170.
 [3] R.A. Dreiding and L.A. McLay, An integrated model for screening cargo containers, Eur. J. Oper.
 Res. 230 (2013) 181.
 [4] A. Varbanova, Evaluating the impact of security measures on container supply chains, Trans Motauto
 World, 3 (2018) 33.
 [5] S.A. Mohseni, E. Onghena, E. van Hassel and T. Vanelslander, Security in the maritime container
 supply chain: what is feasible and realistic?, J. Transp. Secur. (2020).

 – 18 –
[6] GAO, Maritime security. The SAFE port act: status and implementation one year later, U.S.
 Government Accountability Office report GAO-08-126T, U.S.A. (2007).
 [7] B. Kempinski and C. Murphy, Scanning and imaging shipping containers overseas: costs and
 alternatives, U.S. Congressional Budget Office report https://www.cbo.gov/publication/51478, U.S.A.
 (2016).
 [8] T.W. Rogers, N. Jaccard, E.J. Morton and L.D. Griffin, Automated X-ray image analysis for cargo
 security: critical review and future promise, J. X-Ray Sci. Technol. 25 (2017) 33.
 [9] J. Bendahan, Vehicle and cargo scanning for contraband, Phys. Procedia 90 (2017) 242.
[10] V.J. Orphan, E. Muenchau, J. Gormley and R. Richardson, Advanced ray technology for scanning

 2021 JINST 16 P08037
 cargo containers, Appl. Radiat. Isot. 63 (2005) 723.
[11] J. Zhang et al., Joint shape and texture based X-ray cargo image classification, in 2014 IEEE
 conference on computer vision and pattern recognition workshops, Columbus, OH, U.S.A., 23–28
 June 2014, IEEE, (2014).
[12] L. Li, T. Zhao and Z. Chen, First dual MeV energy X-ray CT for container inspection: design,
 algorithm, and preliminary experimental results, IEEE Access 6 (2018) 45534.
[13] G. Zentai, X-ray imaging for homeland security, Int. J. Signal Imaging Syst. Eng. 3 (2010) 13.
[14] M. Debatin and J. Hesser, Accurate low-dose iterative CT reconstruction from few projections by
 generalized anisotropic total variation minimization for industrial CT, J. X-Ray Sci. Technol. 23
 (2015) 701.
[15] D. Kim et al., Spatial resolution and blurring artifacts in digital X-ray tomosynthesis, IEEE Trans.
 Nucl. Sci. 65 (2018) 1180.
[16] I. Frosio, N.A. Borghese, F. Lissandrello, G. Venturino and G. Rotondo, Optimized acquisition
 geometry for X-ray inspection, in 2011 IEEE international instrumentation and measurement
 technology conference, Hangzhou, China, 10–12 May 2011, IEEE, (2011).
[17] Y.H. Cho, J.H. Moon and C.S. Kang, Analysis of activation products generated from photoneutron
 capture reactions inside a linear accelerator used in a cargo inspection facility, Nucl. Instrum. Meth.
 B 265 (2007) 615.
[18] J. Lee et al., Development of diode based high energy X-ray spatial dose distribution measuring
 device, J. Radiat. Prot. Res. 43 (2018) 97.
[19] ANSI, American national standard for determination of the imaging performance of X-ray and
 gamma-ray systems for cargo and vehicle security screening, American National Standards Institute
 technical report N42.46-2008, (2008).
[20] G. Chen et al., X-ray cargo inspection: status and trends, AIP Conf. Proc. 1099 (2009) 570.
[21] A. Fischer, T. Lasser, M. Schrapp, J. Stephan and P.B. Noël, Object specific trajectory optimization for
 industrial X-ray computed tomography, Sci. Rep. 6 (2016) 19135.

 – 19 –
You can also read