ABSTRACT VOLUME Annual Conference 2020 - 22-25 November University of Canterbury Christchurch - Geoscience Society of New Zealand
←
→
Page content transcription
If your browser does not render page correctly, please read the page content below
Annual
Conference
2020
22–25 November

                                    Photo credit: Kamen Engel
University of Canterbury
Christchurch

ABSTRACT VOLUME

                           PAGE 1

CONFER.NZ/GSNZ2020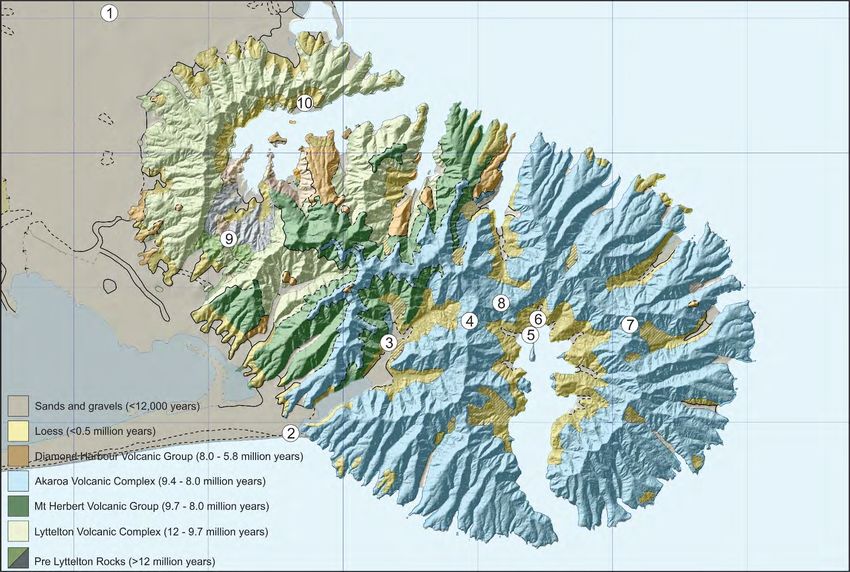
Bibliographic reference for Field Trip Guides:
Author A.B., Author B.C. (2020). Field trip title. In: Bassett K.N., Horton T.W. eds. Geosciences 2020:
Field Trip Guides. Geoscience Society of New Zealand Miscellaneous Publication 157B. Geoscience
Society of New Zealand, Wellington, pp. 1–2.

Geoscience Society of New Zealand Miscellaneous Publication 157B
ISBN (online): 978-0-473-55116-2
ISSN (online): 2230-4495
LOCAL ORGANISING COMMITTEE
                                Organising Committee Convenor
                                  Kari Bassett, University of Canterbury

                                       Organising Committee
                     Alex Nichols, Programme Committee, University of Canterbury
                     Clark Fenton, Programme Committee, University of Canterbury
                                Sacha Baldwin, University of Canterbury
                                Darren Gravley, University of Canterbury
                                Travis Horton, University of Canterbury
                                 Ben Kennedy, University of Canterbury
                                  Kate Pedley, University of Canterbury
                                Matiu Prebble, University of Canterbury
                                   Rob Spiers, University of Canterbury
                                  Tom Wilson, University of Canterbury

                           SESSION CONVENORS AND CHAIRS
  Peter Almond (Lincoln University), Richmond Beetham (Coffey), Mac Beggs (University of Canterbury),
  David Bell (University of Canterbury), Alan Bischoff (University of Canterbury), Kate Clark (GNS Science),
  Shaun Eaves (Victoria University of Wellington), Joanna Elliot (Todd Energy), Clark Fenton (University of
Canterbury), Michael Gazley (AusIMM), Alexandra Gossart (Victoria University of Wellington), Jess Hillman
 (GNS Science), Jenni Hopkins (Victoria University of Wellington), Ilma Del Carmen Juarez Garfias (Victoria
   University of Wellington), Andy Howell (University of Canterbury/GNS Science), Katelyn Johnson (GNS
  Science), Richard Justice (ENGEO), Andrew La Croix (Waikato University), Rob Langridge (GNS Science),
  Mark Lawrence (GNS Science), Andrew Lorrey (NIWA), Sebastian Naeher (GNS Science), Karoly Nemeth
 (Massey University), Andy Nicol (University of Canterbury), Michael G. Petterson (Auckland University of
   Technology), Adrian Pittari (University of Waikato), Matiu Prebble (University of Canterbury), Heather
Purdie (University of Canterbury), James Scott (University of Otago), Sarah Seabrook (NIWA / University of
   Auckland), Dan Sinclair (Victoria University of Wellington), Richard Smith (Resilience National Science
  Challenge), Mark Stirling (University of Otago), James Thompson (Canterbury Emergency Management
Office), Lauren Vargo (Victoria University of Wellington), Emily Warren-Smith (GNS Science), Sally Watson
 (NIWA), Tom Wilson (University of Canterbury), Holly Winton (Victoria University of Wellington), Hisham
                                               Zarour (Stantec)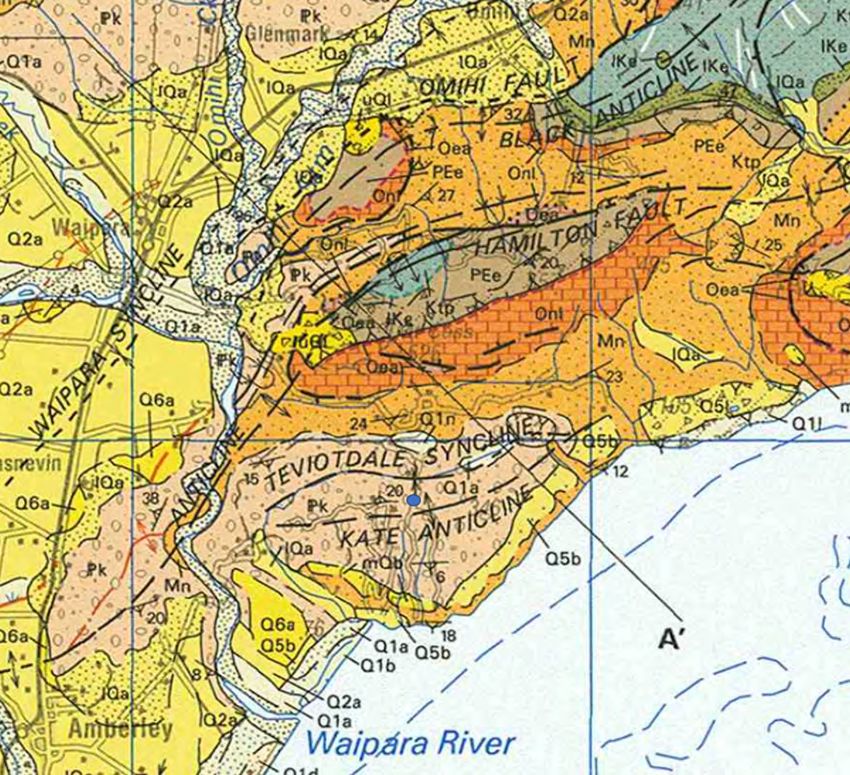
SPONSORS

The conference organising committee acknowledges and thanks the following key
    sponsors for their generous support and involvement in this conference.
Their support has contributed towards our being able to provide a comprehensive
       programme of quality content and excellent value for all participants.

                                Gold Sponsor

                               Silver Sponsors

                              Bronze Sponsor

                               Grant Sponsor

                    Supporting Sponsors and Exhibitors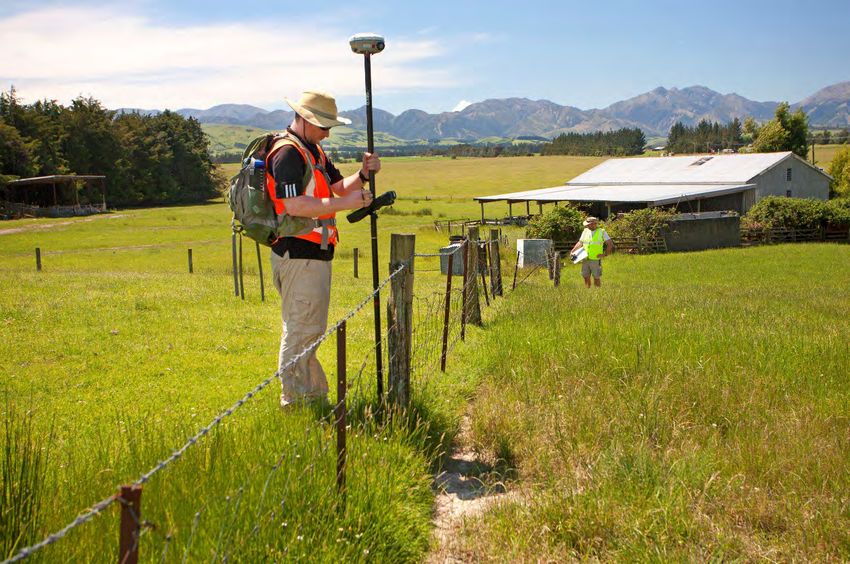
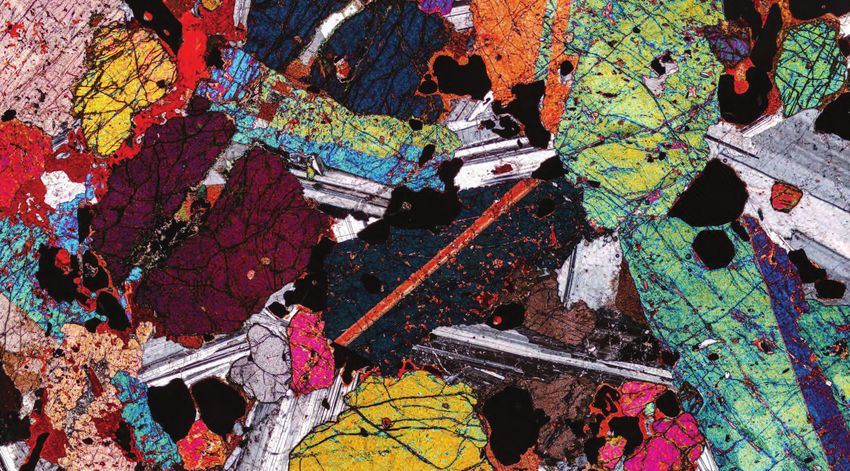
CONTENTS
Field Trip 1: Kaikōura earthquake surface ruptures,landslides and building damage ___________________ 1
Field Trip 4: Petroleum Exploration and Production in North Canterbury __________________________ 17
Field Trip 5: Banks Peninsula’s Best Bits: Volcanology, Research and Geopark_______________________ 42
Field Trip 6: A Walking Tour of Christchurch CBD Rebuild _______________________________________ 68

FIELD TRIP 1: KAIKŌURA EARTHQUAKE SURFACE RUPTURES,LANDSLIDES
AND BUILDING DAMAGE
Sunday 22 November 2020
Leaders: Andy Nicol and Kate Pedley, University of Canterbury

         Three-metre high fault scarp generated along the Leader Fault during the November 14th 2016
         Kaikōura Earthquake. Photograph by Kate Pedley.

                                                                                                       1
2

Kaikōura Earthquake
The Mw 7.8 Kaikōura earthquake struck at two minutes past midnight on 14 November 2016 (NZDT),
almost 4 years ago to the day. Its epicentre was located near the South Island township of Waiau (Figure 1;
Figure 2) and was the largest on-land earthquake to hit New Zealand in more than a century (Downs and
Dowrick, 2015). The Kaikōura earthquake ruptured at least 20 faults at the ground surface for a distance of
~165 km across the New Zealand plate boundary zone in the northeastern South Island of New Zealand.
The earthquake initiated at a focal depth of ~14 km on The Humps Fault and propagated northwards with
the greatest energy release occurring north of Kaikoura (Kaiser et al., 2017; Hamling et al., 2017). The
complexity of the Kaikōura earthquake is partly reflected in the oblique focal mechanism, which displays
approximately equal components of thrusting/reverse and right-lateral slip (e.g., Cesca et al., 2017; Kaiser
et al., 2017; Wang et al., 2017). The resulting fault ruptures displaced the ground surface and sea floor with
strikes varying from east-west to north- northwest. The east-northeast striking faults are primarily right-
lateral strike-slip and the northerly striking faults have left-lateral reverse displacement (Stirling et al., 2017;
Litchfield et al., 2018). In addition to the mapped surface faults, the spatial extent of coastal uplift and
widespread occurrence of tsunami up to ~250 km from Kaikōura have been interpreted to indicate slip on
the subduction interface and/or a blind upper plate thrust(s) within the accretionary prism complex (e.g.,
Clark et al., 2017; Wang et al., 2017; Mouslopoulou et al., 2019).

Figure 1. Maps showing the plate boundary setting of the Kaikōura earthquake. (a) New Zealand plate boundary. AF,
Alpine Fault; ChCh, Christchurch; HT, Hikurangi Trough; Well, Wellington. (b) Geology (Torlesse Supergroup Basement
- grey; Late Cretaceous-Cenozoic strata—orange-brown; Quaternary deposits—yellow-green; Rattenbury et al., 2006),
active faults (black lines from Langridge et al. 2016) and faults that ruptured in the November 14 2016 Mw 7.8
Kaikōura earthquake (red lines with fault names) in the northeastern South Island. The Pacific Plate motion vector
relative to the Australian Plate is from Beavan et al. (2002). MFS, Marlborough Fault System; NCD, North Canterbury
Domain. Figure from Nicol et al. (2018).
                                                                                                                  3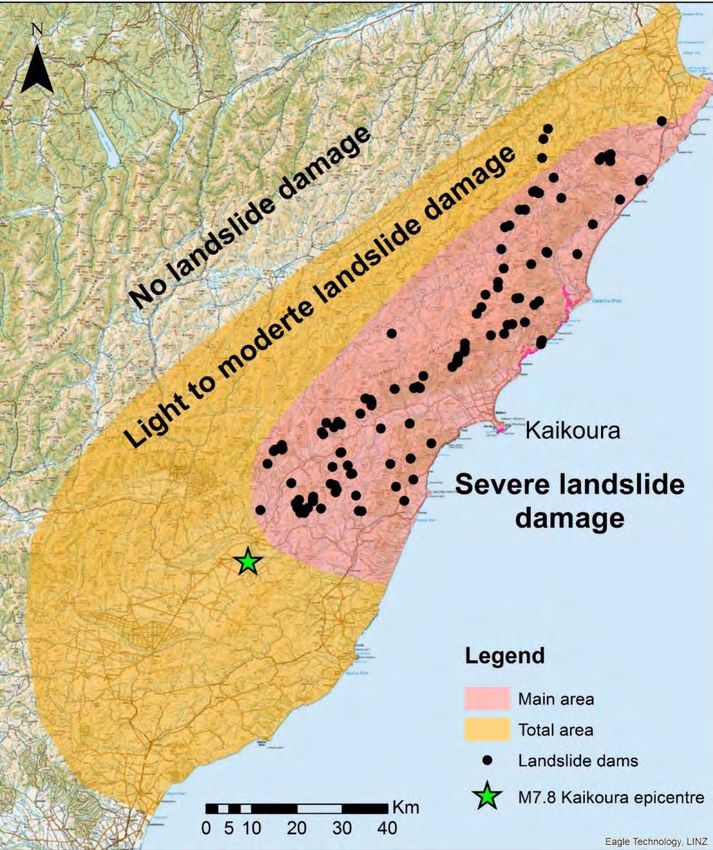
Earthquake Tectonic Setting
The Kaikōura earthquake produced displacement on faults that accommodate the transition from
subduction beneath the North Island to continental collision and strike slip on the Alpine fault in the South
Island of New Zealand (Figure 1A). Onshore in the South Island, ≥80% of the ~40 mm/yr relative plate
motion is transferred from subduction towards the Alpine fault via strike-slip on the Marlborough Fault
System (MFS) (e.g., Beavan and Haines, 2001; Wallace et al., 2012). Offshore and east of the Kaikōura
earthquake surface ruptures, plate boundary deformation is accommodated by a subduction thrust and
accretionary prism complex (e.g., Barnes and Audru, 1999; Williams et al., 2013). The accretionary prism
and eastern MFS are underlain by the Pacific plate which, based on seismic tomography and focal depths of
historical seismicity, extends to a depth of at least 200 km beneath the northern South Island (Eberhart-
Phillips and Bannister, 2010; Eberhart-Phillips and Reyners, 2012; Williams et al., 2013). These data indicate
that in the epicentral area the top of the subducted Pacific plate is located at a depth of ~20-30 km beneath
the surface ruptures and may define the lower limit of the upper-plate faults (Nicol et al., 2018).

In the epicentral area of North Canterbury, here referred to as the North Canterbury (Tectonic) Domain
(NCD) (Figure 1), active faulting and Quaternary deformation has been widely reported prior to the
Kaikōura earthquake (e.g., Pettinga et al., 2001; Rattenbury et al., 2006; Forsyth et al., 2008; Barrell and
Townsend, 2012). The NCD accommodates transpression and is dominated by northeast-striking oblique-
slip faults with components of right-lateral and reverse displacement (e.g., Nicol et al., 1994; Pettinga et al.,
2001). These faults typically separate hanging-wall anticlines and footwall synclines, which are manifest in
the topography as Quaternary-age basins and ranges. Late Cretaceous to Pliocene strata that predate the
onset of Quaternary deformation occupy the basins, while the ranges are often cored by steeply bedded
and complexly deformed Torlesse Supergroup basement (Figure 1) (e.g., Rattenbury et al., 2006; Forsyth et
al., 2008). Basin and range topography primarily reflect crustal contraction and provide little evidence for a
component of strike slip on the NE–ENE trending faults.

Many of the faults mapped in the NCD are associated with active fault traces, which attest to the ongoing
earthquake activity of these structures (e.g., Pettinga et al., 2001; Rattenbury et al., 2006; Forsyth et al.,
2008; Barrell and Townsend, 2012). Quantitative data constraining the displacement rates and recurrence
intervals of these faults is limited, with the majority of rates estimated to be
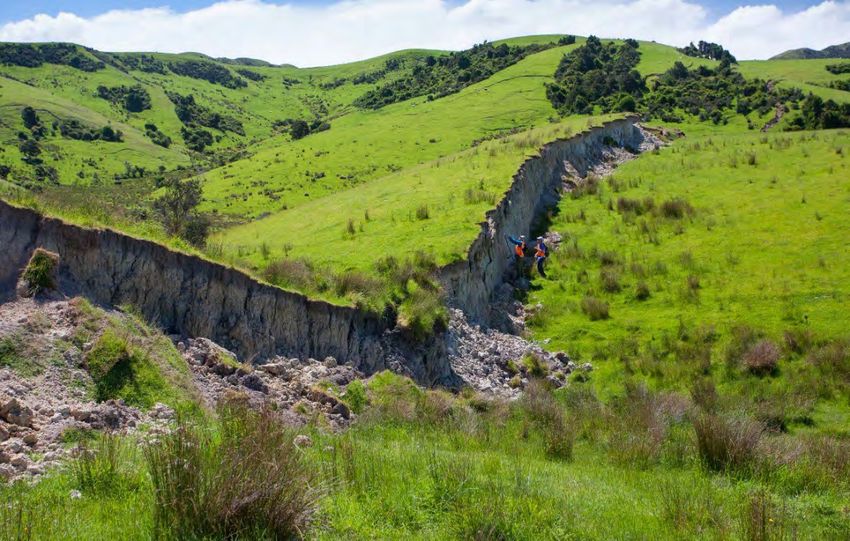
Figure 2. Geological map of rock units, active faults that did not rupture during the earthquake (dark grey lines) and surface ruptures from the Kaikōura earthquake (solid and black
lines surveyed and dashed redlines inferred from deformation recorded by InSAR in the study area south of the Hope fault in the NCD (Rattenburyet al., 2006; Langridge et al.,
2016). Strike and dip of bedding in Torlesse rocks is from Rattenbury et al. (2006).See Figure 1 for location of study area. Inset stereonets depict fault planes (great circles) and slip
vectors (white filled circles) for The Humps, Leader, Conway-Charwell and Stone Jug faults from field measurements. Strike- slip movement sense shown by arrows along with
upthrow (U) and down throw (D) on fault traces. Locations of stops 1, 2, 3 and 4 shown. Figure modified from Nicol et al. (2018).
                                                                                                                                                                                        5
Figure 3. Main shock (large blue filled circle) and aftershock locations displayed on map (a) and cross sections(b and c)
showing subsurface fault geometry of The Humps and Leader faults. Events recorded by GeoNet seismograph stations
were relocated using the HypoDD relative earthquake location algorithm (Waldhauser and Ellsworth, 2000) and
phase-two automatic P arrival time picks along with the New Zealand 3D velocity model now used by GeoNet for
routine locations (see Nicol et al. 2018 for further discussion). Locations of cross sections A-A’ and B-B’ are shown on
the map in (a). Surface ruptures from the Kaikōura earthquake are indicated by the red lines. Closely-spaced red dots
on (b) and (c) indicate the approximate location of the subducting Pacific plate from Williams et al. (2013). Figure from
Nicol et al. (2018).
Implications of Earthquake for Seismic Hazard
The Kaikōura earthquake has implications for the identification and characterisation of seismic sources for
seismic hazard analysis. Prior to the earthquake knowledge of the locations, geometries and
paleoearthquake histories of the faults that ruptured was variable. North of the Hope Fault within the MFS,
most of the main faults (e.g., >1 m slip) that ruptured during the earthquake had already been identified as
active prior to the earthquake and incorporated into the National Seismic Hazard Model (NSHM) (Stirling et
al., 2012, 2017). By contrast, in the NCD, most of the faults were either not known to be active (Leader
Fault) or had poorly defined lengths compared to the 2016 ruptures. Therefore, independent of whether
these faults generally rupture together or separately, their previously-assigned active fault lengths would
produce minimum estimates of the earthquake magnitude. In addition, the Kaikōura earthquake supports
the notion that many active faults in New Zealand
6likely remain undetected and have the potential to produce future large magnitude earthquakes (Nicol et
al., 2016).
The present New Zealand seismic hazard model contains over 530 individual faults and generally treats
these as discrete sources (Stirling et al., 2012). Since the completion of the NSHM fault source model in
2010 the Darfield and Kaikōura earthquakes, and numerical models suggest that rare multi-fault ruptures
are possible and should be included in the model (Field et al., 2013; Litchfield et al., 2018). While the 2010
NSHM includes the possibility of multi-fault rupture in the area of greatest seismic energy release during
the earthquake, the full complexity of the Kaikōura earthquake could not been recognised as a viable
event. The absence of complex ruptures similar to the Kaikōura earthquake in the NSHM is in part because
some of the faults that ruptured were not known to be active. Estimates of recurrence intervals for faults in
the study area suggest a minimum value for the recurrence interval of Kaikōura events of at least ~6000
years (i.e. this is the longest recurrence interval of the faults that ruptured; Litchfield et al., 2018). While
Kaikōura events appear to occur infrequently, it remains possible that multi-fault ruptures in general are
much more common than presently represented in the NSHM, a view supported by the 1987 Edegcumbe,
2010 Darfield and 2016 Kaikōura earthquakes, which all produced displacement on at least five faults
(Beanland et al., 1989; Beavan et al., 2012; Litchfield et al., 2018). Future versions of the NSHM could
explicitly include more multi-fault ruptures by identifying a greater number of faults that may rupture
together and/or by raising the maximum magnitude of background seismicity from Mw 7.2 to at least Mw
7.8 (Nicol et al., 2016).
Stop 1: Waiau
The township of Waiau sits in the immediate hangingwall of The Humps Fault and is approximately 5 km
east of the Kaikōura Earthquake epicentre. The fault rupture of the ground surface directly impacted about
a dozen residential (or residential-type) structures (Van Dissen et al., 2018), while damaging levels of
ground shaking occurred throughout much of North Canterbury, eastern Marlborough and beyond (Kaiser
et al., 2017). The earthquake triggered thousands of landslides (Massey et al., 2018), and locally significant
liquefaction (Bastin et al., 2018). Despite its proximity to the epicentre and possible peak ground
accelerations of 3g being recorded near Waiau, few buildings in the town were significantly damaged (Van
Dissen et al., 2018).
Several buildings in the township of Waiau damaged during the earthquake remain unrepaired, including
the Waiau Lodge Hotel (Figure 4). At the time of the earthquake the hotel was under relatively new
ownership and not fully insured. The damage to hotel building is repairable and the owners are presently
seeking finance to restore and relocate the business to its pre-earthquake premises.
Figure 4. Photograph of the Waiau Lodge Hotel in Waiau showing earthquake-related damage to the building. The
building, which was constructed using reinforced brick and concrete, sustained extensive cracking and wasevacuated
immediately following the earthquake, being deemed unsafe for occupation. Photograph taken 6 February 2017 by
Ulrich Lange (Bochum, Germany); shared via Wiki Commons.
7Stop 2: The Humps Fault fence offset
The Kaikoura earthquake originated on The Humps Fault, which is the southwestern-most surface rupture
of the Kaikōura earthquake. It strikes east to northeast and extends for ~36 km from a tip on the western
margin of the Emu Plains to its junction with the Leader Fault at the base of the Mount Stewart Range in
the east (Figure 2). In general, the western section of The Humps fault (Figure 2) dips steeply to the south,
with dips of 71° S and 80° S measured from the surface trace (see Figure 2 inset stereonet for The Humps
Fault). These observations are comparable with the dip angle of 80° S estimated from the line of best fit on
the fault-normal profile of aftershocks and to the dip of 80 ± 5° estimated by assuming a constant dip
between the surface trace and the location of the main shock at 14 ± 2 km (Figure 3 section A-A’). Prior to
the Kaikōura earthquake, insufficient information was available to define the active fault length or its sense
of slip. Barrell and Townsend (2012) mapped The Humps fault as “definitely active” (~2 km) and “likely
active” (~13 km) east of the Waiau township (Figure 2). The Emu plains, which are part of the Culverden
Basin, vary in altitude above the modern rivers and are inferred to be mainly 71 kyr or younger in age (i.e.
Q2 and Q4 of Rattenbury et al., 2006). Pre-earthquake scarp heights of up to ~7m have been recorded on
these surfaces and indicate one or more surface-rupturing earthquakes on The Humps Fault younger than
~18 thousand years in age.
Figure 5. Overview of the Kaikōura earthquake southern fault ruptures (A) and the Humps Fault Zone (B). The
epicentre of the Kaikōura earthquake is shown by the red circle; the rupture initiated as a 80о S dipping dextral reverse
fault at 14.2 km depth and mainly propagated to the east.
Surface ruptures of the ground surface (e.g. red lines on Figure 5) were primarily mapped using cracks,
fissures and displacements of cultural features (e.g., roads, farm tracks, fences and tree lines). The Humps
Fault on the Emu Plains is primarily right-lateral. The displaced fence on the Dalmer property provides a
good example of the displacements observed along many of the 2016 surface ruptures (see Stop 2 on
Figure 5 for location; see Figure 6 for photo of displaced fence). At this locality the fence displays about a
metre of right lateral displacement and approximately half a metre of down throw to the north. Along The
Humps Fault right-lateral strike displacement, vertical displacement and net displacement reach values of
up to 4 ± 0.3 m, 3.5 ± 0.5 m and 3.9 ± 0.3 m, respectively. Displacement measurements across the alluvial
plains display significant variation in both horizontal and vertical displacement. Many of the strike-slip
displacement lows are located at steps or branch-points along the fault trace indicating that some of the
fluctuations in displacement may reflect fault segmentation. One possible explanation for the coincidence
8of displacement lows and segment boundaries is that these are sites of elevated off-fault deformation,
which is not well sampled by our displacement measurements.
Figure 6. Photograph (looking north) of displaced fence on The Humps Fault, Dalmer Property, near Waiau
(Photograph Kate Pedley).
9Stop 3: Leader Fault and Waiau Wall
Figure 7. Hill shaded LiDAR map showing the topography of Woodchester Station and Stops 3 & 4. Red triangles
indicate the locations of surface ruptures produced in the 2016 Kaikōura earthquake.
The Waiau wall fault surface rupture is located on the Leader Fault which has an overall strike of NNE and
exhibits primarily left-lateral reverse displacement with throw up to the west (Figure 2). The fault extends
for ~28 km along strike from a tip in the south to its intersection with the Conway-Charwell fault in the
north (Figure 2). A complex array of mapped traces ruptured during the earthquake, forming a zone of up
to ~3.5 km wide, with strike varying through 180°, and dips from 80° E to 25° W (Figure 2 Leader Fault inset
stereonet). Along the Leader Fault no active fault scarps were identified prior to the earthquake.
Paleoearthquake studies after the earthquake reveal that it probably ruptured at least once in the last 1000
years, although the precise timing of this event remains poorly constrained.
10During the Kaikōura earthquake the Leader Fault primarily accommodated left-lateral reverse
displacement, with vertical and horizontal components ranging up to 3.5 m and 3 m (including
uncertainties), respectively (Figure 8). Given that landsliding is common along the Leader Fault (Dellow et
al., 2017; Massey et al., 2018), it is possible that vertical displacement was locally increased by slope failure.
The Waiau wall site (Figure 3C) is one locality where the vertical displacement on the fault is significantly
above background values. Based on the elevated displacements at the Waiau Wall site (Figure 7), it is
possible that some vertical displacement here reflects gravitational rather than tectonic processes.
When the Waiau wall was freshly exposed it was possible to observed many striations on the fault surface
(Figure 8C), which are interpreted to record the slip direction of the fault during the earthquake.
Interestingly, the orientations of these slickenside striations were more dip slip on the lower two metres of
the of the fault surface at the Waiau Wall. Curvature of the striations down the fault plane suggests that
fault slip was initially mostly strike slip and then a mix of dip slip and strike slip. The reason for the change
in slip direction at the Waiau wall locality is presently unclear, although further north on the Kekerengu
Fault a similar phenomenon has been observed where it is attributed to earthquake rupture direction
(Kearse et al., 2019).
Figure 8. The Waiau wall on Woodchester Station from different perspectives. (A) 26/11/16. Days after the
earthquake, with most of the fault having formed nearly vertical faces. (B) 6/12/2016. ~1 month after the earthquake.
Some anthropogenic modification of the fault scarp begins. Not much has changed. (C) 8/9/2017. Significant ponding
along fault scarp; nearly all vertical faces have been degraded; some have soil forming overcolluvial wedges. (D)
6/12/2016. Sinistral-oblique slickensides exposed on the scarp; all have now been degraded and cannot be observed.
All photographs by Kate Pedley.
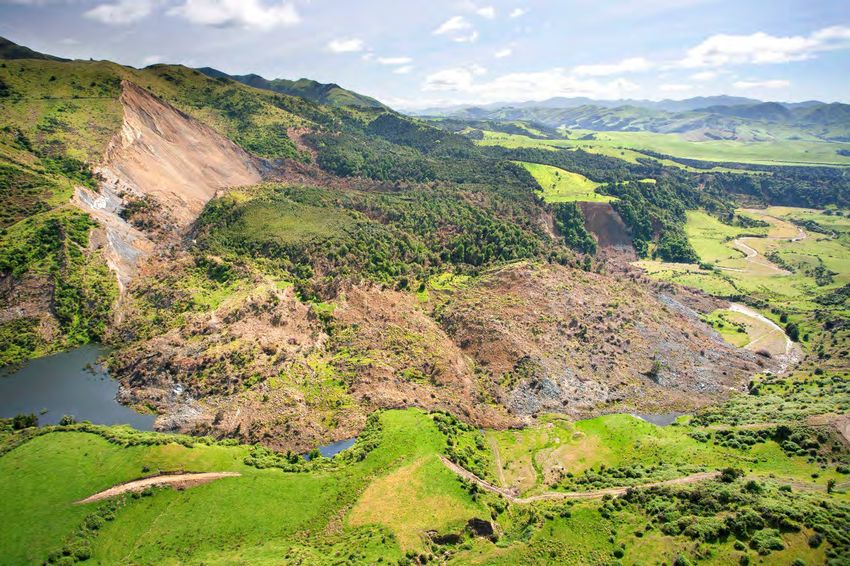
11Stop 4: Leader landslide and Woodchester Station
The primary purpose of this stop is to examine and discuss the Leader landslide. The Leader landslide was
triggered by shaking during the Kaikōura Earthquake. It is located on the eastern end of The Humps Fault.
The Leader Landslide is one of at least 10,000 landslides of varying size that were triggered by the
earthquake (Dellow et al., 2017; Massey et al., 2018). Of these landslides about 50 collapsed into river
valleys and produced large dams which impeded the drainage and formed lakes (Figure 9; Figure 10). The
Leader landslide material mainly comprises low permeability Late Miocene Greta Siltstone Formation,
which dammed the Leader River forming Lake Rebekah. Unlike many other landslide dams the water in
Lake Rebekah has not yet fully breached the dam, although without continued human intervention the lake
will almost certainly drain in the coming years to decades.
Figure 9. Map showing the regions of no landslides, light to moderate landslides and severe landsliding associated with the
Kaikōura earthquake. The black dots show the locations of landslide-dammed drainages produced during the earthquake. The
Leader landslide is located about 18 km northeast of the earthquake epicentre. Diagram from Dellow et al. (2017).
12Figure 10. Photograph showing aerial view of the Leader landslide and the eastern end of Lake Rebekah. Photograph byKate
Pedley looking north along The Humps Fault.
Landowner response and recovery
Rebekah Kelly’s family, the Gardiners, have operated Woodchester Station for several generations.
Rebekah and her husband, David Kelly, took over ownership of the farm in 2014 and had significantly
upgraded the farm with new fences and infrastructure. As a result of the earthquake, they have had to
reconstruct the fences and significantly upgrade the 6 km long entrance road into the homestead. This was
in response to the obvious ground deformation but also to facilitate transport of a temporary farm building
into the station for accommodation during repairs. The fault ruptured directly beneath their shearers’
quarters and shearing shed; this forced the Kelly’s to drive their sheep two days off their property to the
neighbouring station for summer shearing. Water pipes for stock were heavily damaged or completely
broken in fault shear zones. The Kelly’s recognised the need to diversify their farm activities having come
out of a three-year drought, and so introduced beekeeping to supplement ‘beef and sheep’ operations.
They also grow winter crops along the Leader River south terraces (most of which had significant fault
rupture that had to be smoothed for winter planting) and are keen to develop tourism opportunities on the
property. This includes ‘glamping’-style accommodation in a Mongolian yurt and geology tours to the Wall
and landslide dam. Family and friends are making use of the newly-formed Lake Rebekah for camping,
boating and swimming.
13References
Barnes, P.M., and J.C. Audru (1999). Quaternary faulting in the offshore Flaxbourne and Wairarapa Basins,
southern Cook Strait, New Zealand. New Zealand Journal of Geology and Geophysics 42: 349–367.
Barrell, D.J.A., and D.B. Townsend (2012). General distribution and characteristics of active faults and folds
in the Hurunui District, North Canterbury. GNS Science Consultancy Report 2012/113, 45p.
Bastin SH, Ogden M, Wotherspoon LM, van Ballegooy S, Green RA and Stringer M (2018).
“Geomorphological influences on the distribution of liquefaction in the Wairau Plains, New
Zealand, following the 2016 Kaikōura earthquake”. Bulletin of the Seismological Society of America,
108(3B): 1683–1694. doi: 10.1785/0120170248.
Beanland, S., K. R. Berryman, and G. H. Blick (1989). Geological invesitgations of the 1987 Edgecumbe
earthquake, New Zealand. New Zealand Journal of Geology and Geophysics 32: 73–91.
Beavan, J., and J. Haines (2001). Contemporary horizontal velocity and strain-rate fields of the Pacific-
Australian plate boundary zone through New Zealand. J. Geophys. Res. 106: 741–770.
Beavan R.J., P. Tregoning, M. Bevis, T. Kato, and C. Meertens (2002). Motion and rigidity of the Pacific Plate
and implications for plate boundary deformation. J. Geophys. Res. 107(B10).
doi:10.1029/2001JB000282.
Beavan, J., M. Motagh, E. J. Fielding, N. Donnely, N., and D. Collett (2012). Fault slip models of the 2010-
2011 Canterbury, New Zealand, earthquakes from geodetic data and observations of postseismic
ground deformation. New Zealand Journal of Geology and Geophysics 55: 207–221.
Cesca, S., Y. Zhang, V. Mouslopoulou, R. Wang, J. Saul, M. Savage, S. Heimann, S.-K. Kufner, O. Oncken, and
T. Dahm (2017). Complex rupture process of the Mw 7.8, 201k, Kaikoura earthquake, New Zealand
and its aftershock sequence. Earth Planet. Sci. Lett. 478: 110–120.
Clark, K., E. Nissen, J. Howarth, I. Hamling, J. Mountjoy, W. Ries, K. Jones, S. Goldstein, U. Cochran, P.
Villamor, S. Hreinsdóttir, N. Litchfield, K. Berryman, and D. Strong (2017). Highly variable coastal
deformation in the 2016 Mw7.8 Kaikōura earthquake reflects rupture complexity along a
transpressional plate boundary. Earth Planet. Sci. Lett. 474: 334–344.
https://doi.org/10.1016/j.epsl.2017.06.048.
Downes, G.L., and D.J. Dowrick (2015). Atlas of isoseismal maps of New Zealand earthquakes, 1843–2003,
2nd Edition. Institute of Geological & Nuclear Sciences monograph 25 (issued as a CD). Lower Hutt:
Institute of Geological & Nuclear Sciences.
Eberhart-Phillips D, and S. Bannister (2010). 3-D imaging of Marlborough, New Zealand, subducted plate
and strike-slip fault systems, Geophys. J. Int. 182: 73–96. doi:10.1111/j.1365-246X.2010.04621.x.
Eberhart-Phillips, D., M. Reyners, S. Bannister, M. Chadwick and S. Ellis (2010). Establishing a versatile 3-D
seismic velocity for New Zealand. Seismological Research Letters, doi:10.1785/gssrl.81.6.992.
Eberhart-Phillips, D., and M. Reyners (2012). Imaging the Hikurangi Plate interface region, with improved
local- earthquake tomography, Geophys. J. Int. 190 (2): 1221–1242.
Forsyth, P.J., D.J.A Barrell, and R. Jongens (2008). Geology of the Christchurch Area: Institute of Geological
and Nuclear Sciences Geological Map 16: Lower Hutt, New Zealand, GNS Science, 1 sheet + 67 p.,
scale 1:250,000.
Hamling, I., S. Hreinsdóttir, K. Clark, J. Elliott, C. Liang, E.J. Fielding, N. Litchfield, P. Villamor, L. Wallace, T.J.
Wright, E. D’Anastasio, S. Bannister, D. Burbridge, P. Denys, P. Gentle, J. Howarth, C. Mueller, N.
Palmer, C. Pearson, W. Power, P. Barnes, D. Barrell, R. Van Dissen, R. Langridge, T. Little, A. Nicol, J.
Pettinga, J. Rowland and M. Stirling (2017). Complex multi-fault rupture during the 2016 Mw 7.8
Kaikōura earthquake, New Zealand. Science 356 (6334): eeam7194. doi: 10.1126/science.aam7194
J. Ristau, S. Bannister, A. Christophersen, K. Clark, W. Power, D. Rhoades, C. Massey, I. Hamling, L. Wallace,
J. Mountjoy, Y. Kaneko, R. Benites, C. Van Houtte, S. Dellow, L. Wotherspoon, K. Elwood, and K.
Gledhill (2017). The 2016 Kaikōura (New Zealand) Earthquake: Preliminary seismological report,
Seismol. Res. Lett. 88 (3), 727–739.
Kearse, J., Kaneko, Y., Little, T., Van Dissen, R. J. (2019). Curved slickenlines preserve the direction of
rupture propagation. Geology, 47 (9), 838–842. https://doi.org/10.1130/G46563.1
Langridge, R.M., Ries, W.F., Litchfield, N.J., ,Villamor, P., Van Dissen, R.J., Barrell, D.J.A., Rattenbury, M.S.,
Heron, D.W., Haubrock, S., Townsend, D.B., Lee, J.M., Berryman, K.R., Nicol, A., Cox, S.C., Stirling,
M. (2016). The New Zealand Active Faults Database. New Zealand Journal of Geology and
14Geophysics 59: 86–96. doi: 10.1080/00288306.2015.1112818.
Litchfield N.J., P. Villamor, R. Van Dissen, A. Nicol, P. Barnes, D. Barrell, J. Pettinga, R. Langridge, T. Little, J.
Mountjoy, W.F. Ries, J. Rowland, C. Fenton, M.W. Stirling, J. Kearse, U.A. Cochran, K.J. Clark, M.
Hemphill-Haley, N. Khajavi, K. Jones, G. Archibald, P. Upton, C. Asher, A. Benson, S.C. Cox, C.
Gasston, D. Hale, B. Hall, A.E. Hatem, D.W. Heron, J. Howarth, T.J. Kane, G. Lamarche, S. Lawson, B.
Lukovic, S.T. McColl, C. Madugo, J. Manousakis, D. Noble, K. Pedley, K. Sauer, T. Stahl, D.T. Strong,
D.B. Townsend, V. Toy, J. Williams, S Woelz, and R. Zinke (2018). Surface Fault Rupture from the
Mw 7.8 2016 Kaikōura Earthquake, New Zealand, and Insights into Factors Controlling Multi-Fault
Ruptures. Bull. Seismol. Soc. Am. 108(3B): 1496–1520. doi: 10.1785/ 0120170300.
Massey C., Townsend D., Rathje E., Allstadt K., Kaneko Y., Lukovic B., Bradley B., Wartman J., Horspool N.,
Hamling I., Carey J., Cox S., Davidson J., Dellow S., Holden C., Jibson R., Jones K., Kaiser A., Little C.,
Lyndsell B., McColl S., Morgenstern R., Petley D.N., Rengers F., Rhoades D., Rosser B., Strong D.,
Singeisen C., Villeneuve M. (2018). Landslides triggered by the Mw 7.8 14 November 2016 Kaikōura
earthquake, New Zealand. Bulletin of the Seismological Society of America 108(3B): 1630–1648.
doi: 10.1785/ 0120170305.
Mouslopoulou, V., Saltogianni, V., Nicol, A., Oncken, O., Begg, J., Babeyko, A., Cesca, S., Moreno, M. (2019).
Breaking a subduction-termination from top to bottom: the large 2016 Kaikōura Earthquake, New
Zealand. Earth and Planetary Science Letters 506: 1–10.
Nicol, A., B.V. Alloway, and P.J Tonkin (1994). Rates of deformation, uplift and landscape development
associated with active folding in the Waipara area of North Canterbury, New Zealand. Tectonics 13:
1321–1344.
Nicol, A., Van Dissen,, R., Stirling, M., Gerstenberger, M. (2016). Completeness of the paleoseismic active
fault record in New Zealand. Seismological Research Letters 86 (6): 1299–1310.
doi:10.1785/0220160088.
Nicol A, Khajavi N, Pettinga J, Fenton C, Stahl T, Bannister S, Pedley K, Hyland-Brook N, Bushell T, Hamling I,
Ristau J, Noble D and McColl ST (2018). Preliminary geometry, displacement, and kinematics of
fault ruptures in the epicentral region of the 2016 Mw 7.8 Kaikōura, New Zealand, earthquake.
Bulletin of the Seismological Society of America 108(3B): 1521–1539. doi: 10.1785/0120170329.
Pettinga, J. R., M. D. Yetton, R. J. Van Dissen, and G. Downes (2001). Earthquake source identification and
characterisation for the Canterbury Region, South Island, New Zealand, Bull. New Zealand Soc.
Earthq. Eng. 34, 282–317.
Rattenbury, M. S., D. B. Townsend, and M. R. Johnston 724 (2006). Geology of the Kaikōura area. Institute
of Geological & Nuclear Sciences 1:250 000 geological map 13. 1 sheet + 70 p. Lower Hutt, New
Zealand. GNS Science.
Stirling, M. W., G. McVerry, M. Gerstenberger, N. Litchfield, R. Van Dissen, K. Berryman, P. Barnes, L.
Wallace, B. Bradley, P. Villamor, R. Langridge, G. Lamarche, S. Nodder, M. Reyners, D. Rhoades, W.
Smith, A. Nicol, J. Pettinga, K. Clark, and K. Jacobs (2012). National seismic hazard model for New
Zealand: 2010 update, Bull. Seismol. Soc. Am. 102: 1514–1542.
Stirling, M.W., N.J. Litchfield, P. Villamor, R.J. Van Dissen, A. Nicol, J. Pettinga, P. Barnes, R.M. Langridge, T.
Little, D.J.A. Barrell, J. Mountjoy, W.F. Ries, J. Rowland, C. Fenton, I. Hamling, C. Asher, A. Barrier, A.
Benson, A. Bischoff, J. Borella, R. Carne, U.A. Cochran, M. Cockroft, S.C. Cox, G. Duke, F. Fenton, C.
Gasston, C. Grimshaw, D. Hale, B. Hall, K.X. Hao, A. Hatem, M. Hemphill-Haley, D.W. Heron, J.
Howarth, Z. Juniper, T. Kane, J. Kearse, N. Khajavi, G. Lamarche, S. Lawson, B. Lukovic, C. Madugo, I.
Manousakis, S. McColl, D. Noble, K. Pedley, K. Sauer, T. Stahl, D.T. Strong, D.B. Townsend, M.
Villeneuve, A. Wandres, J. Williams, S. Woelz, and R. Zinke (2017). The Mw 7.8 Kaikōura
earthquake: Surface rupture, and seismic hazard context, Bull. New Zeal. Soc. Earthquake Eng. 50:
73–84.
Van Dissen R., Stahl, T., King, A., Pettinga, J.R., Fenton, C., Little, T.A., Litchfield, N.J., Stirling, M.W.,
Langridge, R.M., Nicol, A., Kearse, J., Barrell, D.A., Villamor, P. (2018). Impacts of surface fault
rupture on residential structures during the 2016 Mw 7.8 Kaikōura Earthquake, New Zealand.
Bulletin of the New Zealand Society for Earthquake Engineering 52(1): 1–22.
Waldhauser, F., and W.L. Ellsworth (2000). A Double-Difference Earthquake Location Algorithm: Method
and Application to the Northern Hayward Fault, California, Bull. Seismol. Soc. Am. 90: 1353–1368.
15Wallace, L.M., P. Barnes, J. Beavan, R. Van Dissen, N. Litchfield, J. Mountjoy, G. Lamarche, and N. Pondard
(2012). The kinematics of a transition from subduction to strike-slip: an example from the central
New Zealand plate boundary, J. Geophys. Res. 117: B02405. doi: 10.1029/2011JB008640.
Wang, T., S., Wei, X., Shia, Q. Qiu, L. Lia, D. Peng, R.J. Weldon, S. Barbot (2017). The 2016 Kaikōura
earthquake: Simultaneous rupture of the subduction interface and overlying faults, Earth and
Planet. Sci. Lett. 482: 44–51
Williams, C.A., D. Eberhart-Phillips, S. Bannister, D.H.N. Barker, S. Henrys, M. Reyners, and R. Sutherland
(2013). Revised interface geometry for the Hikurangi Subduction Zone, New Zealand, Seismol. Res.
Lett. 84: 1066–1073.
16FIELD TRIP 4: PETROLEUM EXPLORATION AND PRODUCTION IN NORTH
CANTERBURY
Thursday 26 November 2020
Leaders: Mac Beggs and Andy Nicol, University of Canterbury
Assistance in absentia from Nick Jackson and Bill Leask, Elemental Petroleum Consultants.
Limestone ridges, Waipara
Kate-1 drilling, 2008 Seismic line IP256-99-107 tie to Arcadia-1
17Trip Summary
Unbeknown to almost everyone, the only active petroleum production in New Zealand outside of Taranaki
Basin is located in North Canterbury—a very modest gas development at Hanmer Springs. The occurrence
of thermogenic natural gas in conjunction with geothermal water at Hanmer Springs is not well understood.
The gas production system at Hanmer Springs will be visited and described, and its geological setting
discussed.
Figure 1. Route map with well and seismic line locations.
18On the way to Hanmer Springs, the regional geological setting of North Canterbury will be introduced with
stops to showcase the stratigraphy and structure, with an emphasis on the active anticlines in Tertiary
strata which have attracted petroleum exploration attention from time to time, culminating in exploration
wells Kowai-1 (1978), Arcadia-1 (2000), and Kate-1 (2008). We will visit the Kate-1 well site on the Kate
anticline SE of Waipara. On the return from Hanmer Springs we will visit the Cust anticline, west of
Rangiora, the site of Arcadia-1.
North Canterbury stratigraphy and deformation
The field trip traverses the NW part of the Canterbury Basin which extends from an offshore axis east of the
Canterbury Bight.
Figure 2. Regional structure map of North Canterbury showing the four main locations to be visited.
Like other basins in Zealandia the Canterbury Basin initiated as an intra-continental rift during the Late
Cretaceous (late Albian, ~105±5 Ma) (Field and Browne, 1989; Strogen et al., 2017, Barrier, 2019). Following
initial rifting and early post-rift sedimentation, subsequent Paleogene sedimentation became progressively
finer-grained and more calcareous with increasing water depths, which culminated in maximum drowning
in the early Oligocene (Field and Browne, 1989; King et al., 1999; Landis et al., 2008). After the early
Oligocene maximum drowning water depths shallowed with many onshore areas in the Canterbury Basin
becoming emergent in the Pliocene-Pleistocene. Offshore south of Banks Peninsula basin strata reach
thicknesses in excess of 5 km with 2–3 km of Cretaceous strata deposited in grabens, while onshore and
north of the peninsula the entire basin succession generally ranges in thickness from 300–1200 m (Field
and Browne, 1989). The thickest parts of the succession primarily occur in half grabens where latest
Cretaceous thickening of the Broken River coal measures is observed (Field and Browne, 1989; Nicol, 1993;
GeoSphere, 2003). In Figure 3 we show Late Cretaceous half grabens on a regional north-south cross
section as depicted in PR3165 (GeoSphere, 2003). This stratigraphic cross section projects a series of
outcrop sections onto a south to north line and suggests a boundary between the northern Canterbury
Basin platform, with latest Cretaceous extensional depocentres as also observed in Pegasus Bay offshore
19(Barnes, 1996), and the southward onlap of the Marlborough/East Coast basin margin onto the Hurunui High. Figure 3. Stratigraphic cross section of late Cretaceous to Oligocene sequence on the northern margin of Canterbury Basin. The Eocene to Oligocene Amuri Limestone, deposited when the whole region (if not all of Zealandia) was drowned, constitutes an important stratigraphic marker, with considerable lateral variability in both the underlying Eyre Group and overlying Motunau Group giving rise to numerous and often discontinuous local formations. Generally, the Broken River Formation is latest Cretaceous terrestrial facies with thin (
Zealandia, including the Canterbury Basin (Mortimer et al., 2014; Barrier et al., 2019). In the Canterbury
Basin Miocene to Recent strata record an increase in sediment supply from topography created to the west
of the basin by uplift in the central South Island that is manifest today as the Southern Alps (Browne and
Naish, 2003; Barrier et al., 2019). This increase in sediment supply was initially recorded in the offshore
basin where the shelf break prograded towards the deep water mainly from the mid Miocene, while
onshore in North Canterbury deposition of the Kowai Gravels was the main manifestation of increased
sedimentation and uplift of the Southern Alps.

The present topography and outcrop patterns of Cretaceous and Cenozoic strata mainly reflect Late
Pleistocene shortening and transpression. The Kate-1 well is located on the Kate anticline, which is one of
many northeast-trending structures that form part of a fold and oblique reverse fault belt (e.g., Nicol et al.,
1994; Barnes, 1996; Vanderleest et al., 2017). These faults typically separate hanging-wall anticlines and
footwall synclines that are manifest as topographic basins and ranges. Late Cretaceous to Cenozoic strata
often occupy the basins, while the ranges are commonly cored by steeply bedded and complexly deformed
Torlesse basement (e.g., Warren, 1995; Rattenbury et al., 2006; Forsyth et al., 2008). Many of the faults
have active traces which, in combination with ongoing earthquake activity, suggest that the faults and folds
are actively growing (e.g., Pettinga et al., 2001; Nicol et al., 1994, 2018).

Hanmer
Hanmer Basin is a rhomb-shaped topographic depression in North Canterbury, measuring 15 km east-west
by 7 km north-south. Active traces of the dextral strike-slip Hope Fault are present on the northern side of
the western part of the basin, are absent from the central area, and reappear on the southern side of the
eastern part of the basin. This basin formed at a releasing bend between the right-stepping western Hope
River segment to the west and the more linear Conway segment to the east (Rattenbury et al 2006). The
Hanmer Springs are close to the Hanmer Fault, which is mapped as a series of discontinuous active traces
along the northern margin of the basin, associated with a 100–200 m wide zone of ground warping (Wood
et al., 1994).

                                                                                                            21
Figure 4. Geology of Hanmer area, from QMAP, adapted for HSTPS by Elemental Petroleum Consultants.
Figure 5. Cross section through Hanmer Springs NW-SE, from QMAP Kaikoura.
22The basin is filled with Pleistocene–Holocene sediments up to 1000 m thick. Wells and outcrops indicate
these sediments are dominated by alluvial gravels, with subordinate sand, silt and peat. Wood et al (1994)
identified four seismic sequences in the sedimentary succession, but all appear to represent alluvial fan
systems.
At Hanmer Springs, the top of greywacke basement is at approximately 60 m depth. The sediments above
basement are mainly gravel, with several thin sand and silt units (ECAN bore log data). The producing
intervals of the water wells either straddle the gravel/bedrock interface, or lie totally within the bedrock
(for example, N32/0319 is an uncased open-hole from 224 to 516 m).
The basement rock is Pahau Terrane (Early Cretaceous) age, comprising indurated fine sandstone with
subordinate argillite interbeds. Drillers’ logs are available for most of the wells (Brown 1973; ECAN bore log
data), but as no core was drilled, descriptions are brief, and do not indicate any significant lithology
variations.
Several faulted inliers of Paleogene-Late Cretaceous strata occur in the North Canterbury region within 3
km of the south edge of the Hanmer Basin (Figure 1; Rattenbury et al 2006). It is possible that a similarly-
aged inlier may be concealed at depth in the basin, either outside the extent of the existing seismic
coverage or not recognised within it.
Six seismic reflection lines were acquired in 1989 and 1991 for scientific research (Figure 5), using Mini-
Sosie wackers as an energy source (Wood et al., 1994). Wood et al. (1994) carried out a basic seismic
interpretation using hardcopies of the profiles (in the era before workstations). The raw shot data are still
held by GNS Science, but no stacked data can be found (R.A. Wood, pers. comm. to Elemental, 2016).
Figure 6. Seismic lines in Hanmer Basin (Wood et al, 1994)
Petroleum Exploration history of North Canterbury
The earliest industry attention to the petroleum potential of North Canterbury was a programme of
regional geological and geophysical mapping commenced by the consortium of BP Shell and Todd in the
late 1950’s. This work, initiated by Todd Brothers who held a concession over much of Canterbury that was
incorporated into the BP-operated joint venture, is synthesised in PR 319 (Haw, 1961). A suite of structural
prospects were identified in PR 260 (Hazzard, 1971, for Antipodes Oil Co.)
The first exploration well in the district, Kowai-1, was drilled on one of these prospects by the newly formed
23state oil company, Petrocorp, in 1978. Katz (1982) demonstrated that this well was not crestal and hence
does not entirely condemn the prospect or region, as others had concluded.
Figure 7. Katz’s (1982) interpretation of the relationship between the Kowai-1 dry well and its target structure, the
crest of which (at Broken River Formation level) is to the SE as indicated by the star.
Indo Pacific Energy held a large exploration permit (PEP38256) over much of the onshore Canterbury Basin
from 1997, shooting 8 seismic lines in the North Canterbury part of the permit in 1998 and 1999. One of
two wells they drilled in 2000, Arcadia-1, tested the Cust Anticline, another of the surface anticlines noted
(as the Mairaki Downs structure) by Hazzard in PR 260 (1971). See Stop 4 content below.
In 2004, Green Gate Ltd was granted PEP 38260 covering an area between Rangiora/Woodend in the south,
and Cheviot in the north, and extending offshore. The stimulus for this venture was a report of light oil
seepage in excavations for the regional Kate Valley landfill, which was then being developed on the north
flank of a surface anticline mapped by Wilson (1964) A grid of seismic lines was shot over the Kate Anticline,
and the Kate-1 well was drilled in 2008. See Stop 2 content below.
PEP 38256 expired in 2007 and PEP 38260 in 2009. The only active petroleum permit in North Canterbury is
PMP 60215 at Hanmer Springs, granted for a period of 40 years from November 30, 2016.
In 2018 the Crown Minerals Act was amended to prohibit any new petroleum exploration permits except in
the onshore Taranaki region.
24Stop 1: Waipara District overview—mid-Waipara section
The stratigraphic sequence in the middle Waipara-Weka Pass area offers a near complete Cretaceous-
Cenozoic section (~80-70 Ma to present) (Figure 7). Much of the stratigraphy from the Torlesse rocks of the
Doctors Range in the west to the Mt Brown Formation, which forms prominent limestone dip slopes in the
east, can be observed from the panorama view at stop 1. The Broken River Formation resting on Torlesse
Mesozoic basement rocks comprises interbedded clean sandstones and sub-bituminous rank coal beds,
which are the most promising petroleum source rocks in the succession.
Figure 8. Generalised stratigraphic column for the Waipara area (from Nicol 1991).
25Figure 9. Geological map of the Mid Waipara area from QMAP Christchurch (Forsyth et al., 2008). Stop location indicated by the letter “A” and yellow filled circle. Birch Hollow stream (shown by red arrows) exposures strata in the thickest part of the graben. The Mid Waipara area is one of the few places in the onshore Canterbury Basin where a Cretaceous half- graben can be observed. The Birch Hollow half graben is bounded to the north by the Birch Fault, which was active in the Late Cretaceous and has accumulated slip in the Quaternary (Nicol, 1993). The strata in the half graben comprise up to 100 m thickness of basal conglomerates, 250 m of quartz sandstone and occasional thin (
Stop 2: Kate Anticline
Driving north from Christchurch as far as Amberley, the adjacent coastline is accreting sediment from the
Waimakariri and lesser rivers. Just north of the Waipara river mouth, the coast swings east and becomes
cliffed due to the higher relief of the Kate anticline marking the North Canterbury fold belt.

Figure 10. Geological map and NW-SE cross section from QMAP (Forsyth et al, 2008; Kate-1 shown by blue
dot.

                                                                                                            27
Access to this stop is provided by roads servicing the Kate Valley Landfill, a facility developed since 2004,
servicing Canterbury district councils from Ashburton to Hurunui (including Christchurch city). Interest in
the petroleum prospectivity of the Kate anticline was stimulated by the report of light oil seepages during
early excavations for the landfill, and a private company (Green Gate Ltd) was formed to secure an
exploration permit (PEP 38260) and undertake investigations culminating in a small local grid of seismic
lines, and the drilling of Kate-1 in 2008 (PR3929).
Figure 11. Green Gate’s interpretation of the Kate Anticline prospect prior to acquisition of seismic to confirm the
structure. PR 3165.
The landfill is situated in the Teviotdale Syncline to the north of the Kate Anticline, and the Kate-1 well site
is just across its southern boundary. There are excellent exposures of the Pliocene Greenwood formation
(local synonym of Kowai formation) in the landfill excavations.
Figure 12. Southern flank of Kate Valley landfill exposing Greenwood (Kowai) Formation. November 2020. Kate-1 well
location was in the valley below the plantation, mid-right (out of sight behind ridge).
28Kate-1 drilled to Torlesse greywacke basement at a depth of 1057m. The Miocene (Tokama Formation) was
thicker than expected and hence the Oligocene limestone somewhat deeper, and older formations thinner
than expected. Nevertheless, the Broken River objective was well developed comprising 73m of highly
porous sandstone, with sharp basal (on greywacke) and upper (beneath Conway Formation) boundaries.
The well is not crestal (as intended) but recorded northward dips of about 25o.
Although it could be argued that there may still be untested prospectivity in the Kate anticline crest (as for
Kowai-1), the absence of any meaningful indications of hydrocarbons in the excellent potential reservoir, as
well as of a plausible migration pathway from source kitchens which would be at a considerable lateral
distance, dissuaded further exploration of the structure.
Figure 13. Kate-1 lithological and stratigraphic sequence.
29Figure 14. Petrophysics of the Broken River sandstone, Kate-1.
Figure 15. Seismic line tie to Kate-1
30Landfill gas to electricity
Organic matter in the municipal waste that is disposed of in the Kate Valley landfill continuously generates
significant volumes of gas (methane and CO2): recently about 2700 m3/hour. This is collected by a network
of wells and used as fuel for four 1MW electricity generators at the site. The electricity is supplied into the
national grid via high voltage power lines to a substation at Waipara.
Any gas production surplus to the capacity of the generation facilities is flared. There is a possibility to
expand generation to as much as 10MW as gas output grows further.
31Stop 3: Hanmer Springs Thermal Pools and Spa (HSTPS)
The following is largely extracted from reports done for HSTPS by Elemental Consultant (Nick Jackson and
Bill Leask) in support of the application for a Petroleum Mining Permit.
Hot springs at Hanmer were first reported by European settlers in April 1859, and soon became a popular
tourist destination (Brown 1973). By 1910, the natural flow from the springs was inadequate for the
demand, and three wells were drilled in the immediate vicinity of the springs in 1911-1912 to augment the
supply. Further wells were drilled in 1936, 1962, 1975 and 2010.
The hot pools are currently supplied with water produced at a temperature of about 58°C, from the two
most recent wells. Gas is produced along with the thermal water.
Figure 16. Well locations and associated facilities within the Hanmer Springs complex.
In 1975, thermal well N32/0054 (“Two”) was drilled under supervision of the Ministry of Works &
Development to 84.8 m depth, but plugged back to 76 m. The ECAN database summarises this as a 250 mm
well drilled to 76 m, but their detailed records state that the well was originally drilled to 96 m, then
plugged back to 76 m. The top of the plug was tagged at 69.4 m, and casing was run to 58.9 m. The open-
hole section is in gravels to 61.3 m, then bedrock to TD.
In 2010, thermal well N32/0319 (“One”) was drilled to 516 m depth. The ECAN database records a 200 mm
diameter bore cased to 224 m with open hole from 224 to 516 m. It achieved a maximum yield of 20 L/s,
with maximum drawdown of 12.7 m. The temperature of the produced water is 58 °C. The top of
greywacke was intersected at 57 m.
Gas was previously vented or flared, but since 2018 HSTPS has established facilities to produce it for
electricity generation subject to New Zealand’s smallest Petroleum Mining Permit (PMP 60215). The water
and gas are co-produced from fracture zones within the greywacke bedrock. Calorific values of 35.1 to 38.8
MJ/sm3 have been determined for the gas.
32Gas composition (Table 1) has been analysed several times since 1921 (Brown 1973).
Table 1. Gas analyses of Hanmer Springs water wells. It is likely that all analyses in Table 1 were from N32/0102
(Thermal well Two)
Date CH4 C2+ He + Ar H2 CO2 O2 N2
5/5/2009 74.8 11.64 - - 9.1 - 4.38
1/10/2005 89.21 2.08E-04 0.232 0.1RA) and indicate a contribution of mantle fluids.
Figure 17. (from Elemental, for HSTPS). Stable isotopes for methane from South Island natural gas samples (Lyon and
Giggenbach, 1994) plotted on fields established by Laughrey and Baldassare (1998).
33Potential sources of gas at Hanmer Springs are:
1) Biogenic hydrocarbon from decomposition of organic material in the alluvial succession;
2) Thermogenic hydrocarbon from Paleogene-Late Cretaceous strata incorporated in the Hope Fault
crush-zone. The gas composition is suggestive of source kerogen at fairly advanced maturity (e.g.,
medium or low volatile bituminous coals, Suggate rank 14-16, Ro about 1.5, based on Sykes and
Zink, 2013).
3) Thermogenic hydrocarbon from organic-rich strata within the Pahau Terrane. Compilation of
Torlesse geochemical data by Suggate (1990) outlined a zone of relatively un-metamorphosed rock
within the North Canterbury region (i.e., the organic material had not been destroyed by
metamorphism); coaly fragments were of high-volatile A bituminous to medium-volatile
bituminous coal rank, potentially capable of generating late-stage thermogenic hydrocarbons
consistent with Hanmer gas composition.
4) Thermogenic hydrocarbon generated on the subduction interface, but the farthest southwest
extent of the Hikurangi slab barely reaches the Hanmer area (e.g., figure 6 in Furlong and Kamp,
2009).
The isotopic analyses of Lyon and Giggenbach (1994) (Figure 17) favour a deep thermogenic source within
the Hope Fault crush zone. Apparent maturity would suggest the source rock has been buried to several km
depth.
Dynamic effects
In March 2018, workover on thermal well One was carried out to replace the submersible pump. While the
pump was out of the well, wireline logging was carried out. Western Energy Services (WES) ran a drifting
tool to check well depth and lack of obstructions. This revealed that the well, which had been drilled to 516
m, was now blocked at 335.5 m, probably as a result of the November 2016 Kaikoura Earthquake. Well
Drillers Wanganui (WDW) ran a borehole video camera downhole to record the wellbore condition and
rockmass features. WES then ran a pressure-temperature-spinner tool down in a series of passes at
different speeds to evaluate temperature variation and any zones of water influx.
Temperature logging shows a peak at 115 m, about halfway down the cased hole section. This is
approximately 40 m below the top of the bedrock. A second jump in temperature occurs at 223.9 m, at the
8” casing shoe. The character of the temperature log and observations of the video suggest that water is
flowing from the well into the annulus (i.e. from below the casing shoe).
34PMP Application Casing Data Wellhead Data
Field Hanmer Springs Casing Size Grade Coupling Comment Type
Well N32/0319 12"
From To 10"
12" 0 166.5 8"
10" 0 210
8" 0 224
Depth (m) MD (m Inc Component / Formation
0 0.00 Ground level (GL)
20
40
60 60.00 Top of Pahau Terrane
80
100
120
140
160 166.50 12" shoe
180
200
220 210.00 10" shoe
240 224.00 8" shoe
260
280 open-hole, unscreened
300
320
340
360
380
400
420
440
460
480
500
520 516.00 7-7/8" (200 mm) TD
Revision A Date Checked By
Figure 18. Well schematic for the main production well at Hanmer Springs.
The largest jump in temperature occurs at 318 m, and although this is 17 m above the Total Depth at
335.5m, there is evidence for water and gas influx at the base of the well. Intervals with natural gas
bubbling occur throughout the open-hole section of the well. In addition, slits in welded casing joints as
high as 110 m also show very small gas bubbles entering the wellbore.
Flow rates of the gas are in proportion to the volume of water pumped (which varies according to seasonal
demand). From the current production bores, a volume of 350 m3 gas per day has been estimated (DETA
Consulting 2015 report for HSTPS). In 2019, a total of 117,425 m3 (1.26 million cubic feet) was produced,
deriving a royalty payment to the Crown of $1211.34. Over the 40-year term of the permit, about 5 million
m3 (55 mmscf) of gas is expected to be utilised.
The facilities include a gas/water separator, with the hot water used as previously for the hot pools. The
processed gas is piped to an 80kW gas engine. The electricity produced offsets approximately 25% of
HSTPS’s requirements.
Although the producing intervals of older wells straddle the gravel/bedrock interface, the most recent well,
N32/0319 (thermal well 1) produces significantly larger volumes of both water and gas than its
35predecessors totally from within the bedrock. The fracture systems within the Pahau Terrane bedrock are
therefore the main reservoir for both water and gas.
Permeable fracture systems commonly occur at the intersection of major fracture sets. The Hanmer Fault
itself, with an ESE strike, is slightly oblique to the ENE trend of the Hope Fault segments (Figure 3; Figure 5).
In addition, a significant defect orientation is indicated by inactive faults within the Pahau Terrane bedrock
and stream alignments, and suggests a fracture set parallel to bedding. We can only speculate that these
systems intersect in the Hanmer Springs area and provide a conduit for water and gas to the surface.
There are substantial structural uncertainties that could affect reserves, and these cannot be quantified
given the limited amount of subsurface data. An additional uncertainty is the impact of future severe
earthquakes in the area. Brown (1973) suggested that the hot spring activity may have been initiated by
large earthquakes in 1848 and/or 1855. He cited Alexander Mackay’s description of the springs in 1888
after the Glynn Wye earthquake on the Hope Fault: “The wells emitted more gas and, it may be, had for a
few days a greater escaping volume of water; they very soon returned to their normal condition, and at the
time of my visit were said to be slightly colder than usual.”.
During the February 2011 Christchurch earthquakes, the noise of the gas flow was “like a jetplane taking
off” (HSTPS pers. comm.). After the November 2016 Kaikoura Earthquake, the water level dropped
overnight from 52 m to 67-68 m, then settled at an average depth of 64 m. Water production decreased to
approximately 16 L/s. Gas production also increased significantly for a few weeks, before returning to
normal.
Stop 4: Cust Anticline
This will be a relatively brief stop en route back to Christchurch from Hanmer Springs.
As at the Kate anticline, in the Cust district Pliocene strata are structurally elevated and folded forming
inliers within Quaternary and modern fluvial deposits.
The Cust anticline is mapped as a southward continuation of Mairaki Downs, where Pliocene Kowai gravels
are exposed. The western end of the Mairaki Downs plunges and veers southward, with mid Pleistocene
alluvial deposits folded as a gentle ridge with active normal fault traces on either side. The anticline swings
back to W-E trend again south of the Cust River bed. Campbell et al (2000) deduced from the
geomorphology that the late Pleistocene emergence of the Cust/Mairaki Downs structure diverted the
Ashley River from its previous course down the Cust valley, tributary to the Waimakariri.
Figure 19. from QMAP (Forsyth et al, 2008). Blue grid lines are 10km apart. Arcadia-1 well location is shown just SE of
Summerhill. Bright yellow “mQa” is mid Quaternary alluvium forming the core of the Cust anticline.
Indo Pacific as Operator for PEP 38256 over onshore Canterbury, acquired seismic lines in 1999, with line
107 (PR ) along Summerhill Rd across the anticline axis. This line shows quite a tight and fairly symmetrical
36You can also read