A Simulated Look at the Effects of Pedestrian Lateral Velocity on Pedestrian Post Impact Trajectory - Mike W. Reade, IPTM Adjunct Forensic ...
←
→
Page content transcription
If your browser does not render page correctly, please read the page content below

A Simulated Look at the Effects
of Pedestrian Lateral Velocity on
 Pedestrian Post‐Impact
 Trajectory
 Mike W. Reade, IPTM Adjunct
 Forensic Reconstruction Specialists Inc.
Disclaimer
The information contained in this presentation was obtained from sources that to the best
of IPTM's knowledge are authentic and reliable. IPTM makes no guarantees of results and
assumes no liability in connection with either the information contained herein, or material
presented by the instructor. Moreover, it cannot be assumed that every acceptable
procedure has been presented or that some circumstances may not require additional or
substitute procedures. Students are reminded that statutes, ordinances and agency policies
will differ widely and wherever these are in conflict with the information contained in this
presentation, the former should govern. This presentation may contain materials created by
others. Such materials may be copyrighted by the original artist/owner. Such material is
used under a claim of fair use pursuant to the Fair Use guidelines in instructional education
activities. Other materials may be copyrighted by the presenter. Additional use of any of
the materials herein is prohibited without expressed written consent of IPTM and/or the
presenter.

Introduction
 •.
 • RCMP Law Enforcement – 1974 to 2000
 • All Service in New Brunswick, Canada
 •.
 • Consulting Services – 2000 to Present

 •.
 • Adjunct Instructor – 1993 to Present
 • Pedestrian Testing & Research – 1993 to Present
Conference Presentation
Topics:

• Pedestrian Crash Phases • Lower‐Body Rotational Effects
• Horizontal Speed Loss (ΔVHSL) • Pedestrian Friction Values
• Estimating Throw Distance • Pedestrian Crash Data
• Estimating Area of Impact Summary
• Lateral Velocity Effects on • Additional Materials & Papers
 Trajectories • Presentation Download Link
• Experiment Setup, Data
 Collection, Issues

Pedestrian Crash Phases

Pre‐Impact Phase
Pre‐Impact Deceleration:

 • Deceleration Distance Known
 • Deceleration Friction Known
 • Speed Lost Before Impact

Formula(s):

US: SI:

 30 254

 2 2
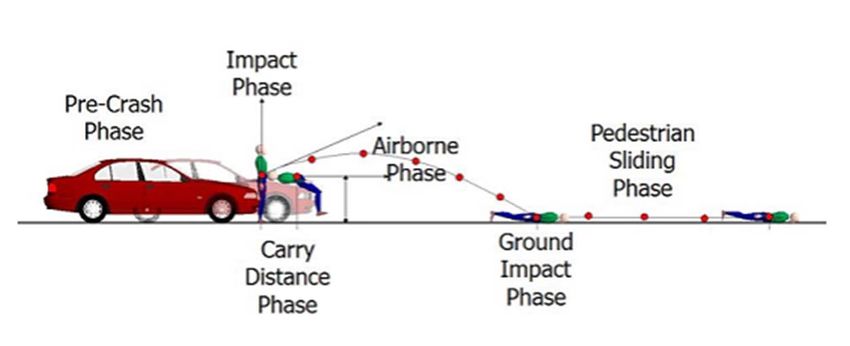
Impact & Carry Distance Phases
Impact:

 • COM – Hood Height Relationship
 • COM Height
 • Hood Height
 • Impact Location
 • Left, Center, Right
 • Head Contact Myth?

Carry Distance:

 • Signs of Pedestrian Trapping
 • Carry Distance Estimate?
 • ~2 ft (~0.61 m) or more
 • Post‐Impact Direction
 • Left, Center, Right
 • Reduce Throw Distance
Airborne Phase
Known Horizontal & Vertical Distance:

 • Takeoff Location Known
 • Landing Location Known
 • Takeoff Angle or Slope
 • Airborne Formula(s)
 • True Speed

Formula(s):

US: SI:

 2.73 1 7.96 1 Where:

 1 360

 [Source: Fundamentals of Traffic Crash Reconstruction, Daily‐Shigemura‐Daily, 3rd Printing (2007), Page 494]
Airborne Phase
Center of Mass Path (Example):

 • Takeoff Velocity
 • 45 fps (13.7 m/s)
 • 30.6 mph (49.2 km/h)
 • Takeoff Angle
 • 20 degrees
 • h = 5 ft (1.52 m)

Formula(s): US (SI):

 [Image Source: IMPACT© ‐ Collision Reconstruction Software]
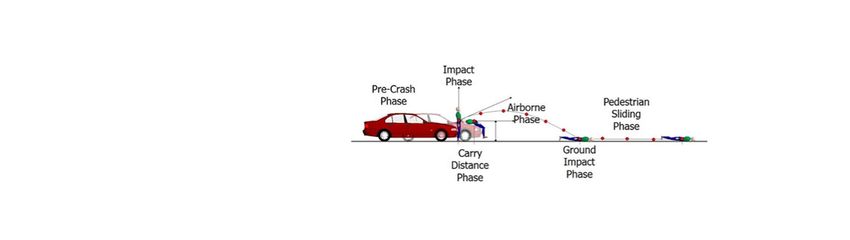
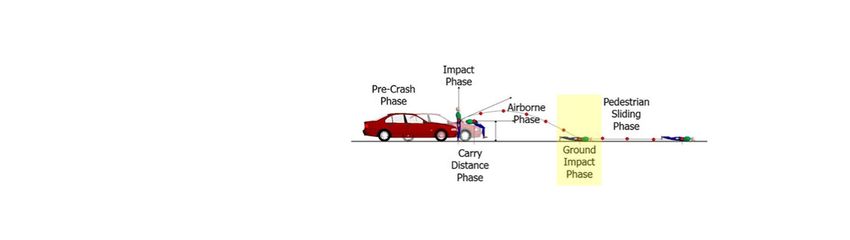
Ground Impact (HSL) Phase
Horizonal Speed Loss (HSL):

 • 1st Contact with Surface (ΔV)
 • Knowing…
 • COM Takeoff Height ∆
 • Vertical Landing Velocity
 • Takeoff Angle (If applicable)
 • Pedestrian Friction Value

Formula(s):

US (SI): (Results in fps or m/s)
 Where:
 2

 sin 2

 [Source: Searle, J.A. (2009) “The Application of Throw Distance Formulae.” IPTM Special Problems in Traffic Crash Reconstruction, Orlando, Florida.]
 [Source: Hague, D.J. (2001) “Calculation of Impact Speed from Pedestrian Slide Distance.” Metropolitan Laboratory Forensic Science Service, ITAI Conference.]
Pedestrian Throw Distance Phase
Known Pedestrian Throw Distance:

 • Total Throw Distance – Carry Distance
 • Known Impact Area
 • Known Final Rest Area
 (Throw Distance Phase: Airborne + Sliding)
 • Pedestrian Friction Value
 • Pedestrian Throw Formula(s)
 • Projectile Speed

Formula(s):

US: SI: US (SI):

 30 254 2

 1 1 1

 [There are several Pedestrian Throw Formulas. The above represents the Searle Minimum Formula for mph (km/h) results.]
Pedestrian Sliding Phase
Sliding Distance:

 • From Location of 1st Touch
 • To Location of Final Rest
 • Pedestrian Sliding Distance

 • Pedestrian Friction Value
 • Projectile Speed

Formula(s):

US: SI:

 30 254

 2 2
What If? (* VHSL + VSlide)
All You Know?

 • Know Final Rest Location
 • Pedestrian’s Sliding Direction
 • Evidence of 1st Touchdown
 • COM Vertical Height at Takeoff
 • MAY Know Takeoff Angle?

What Can I Figure Out?

 • Pedestrian Slide to Stop
 • Horizontal Speed Loss at 1st Touch
 • * (VHSL + VSlide)
 • * Pedestrian Speed at Touchdown
 • Total Airborne Time to Surface
 • Estimate of Total Throw Distance
What If? (Cannot Find Impact Area)
All You Know?

 • Know Final Rest Location
 • Pedestrian’s Sliding Direction
 • Evidence of 1st Touchdown
 • COM Vertical Height at Takeoff

What Can I Use or Figure Out?

 • Pedestrian Slide to Stop
 • Horizontal Speed Loss at 1st Touch
 • Then Figure Out:
 • Horizontal Velocity
 • Total Airborne Time
 • Horizontal Airborne Distance
Determining Impact Area?
From Evidence or Other?:

 • Location of 1st Evidence?
 • Shoe Scuff Evidence?
 • Pedestrian Sliding Evidence
 • Line Taken Back Along
 Roadway Evidence?
 • Other Ways?

Formula(s):

US: SI:

 ?
Estimating Throw Distance
Fortunately, YES!:

 • Pedestrian Takeoff Angle (?)
 • Pedestrian Sliding Distance
 • Pedestrian Friction Value
 • Pedestrian COM Height

Formula Results:

 • Minimum Airborne Distance
 • Minimum Projectile Velocity
 • Maximum Airborne Distance
 • Minimum Projectile Velocity

 [NOTE: Takeoff Angles Above 30 Degrees Produce Increased Results]

 [Source: Personal communications & conversations with Dr. Bob SCURLOCK, PhD (2020) – VirtualCRASH©]
Scurlock Formula Comparison
Scurlock Formula:

 • Ped Sliding Dist.: 55’ (16.76 m)
 • Ped Friction Value: 0.60
 • Ped COM Height.: 3.5’ (1.06 m)
 • Ped Takeoff Angle: 10 degrees Xmin = 25.69’ (7.83 m)
 • Spdmax = 39.42 mph (63.42 km/h) Throwmin = 80.69’ (24.59 m)
 Velmin = 55.11 fps (16.79 m/s)
 Spdmin = 37.57 mph (60.45 km/h)

Formula(s):

 • Searle Formulas: Xmax = 49.69’ (15.14 m)
 Angle: 39.84 mph (64.10 km/h) Throwmax = 104.69’ (31.91 m)
 Min: 37.20 mph (59.85 km/h) Velmax = 57.81 fps (17.62 m/s)
 Max: 43.38 mph (69.79 km/h) Spdmax = 39.42 mph (63.42 km/h)
 • Rich Formula:
 Angle: 39.40 mph (63.39 km/h)

 [Source: Personal communications & conversations with Dr. Bob SCURLOCK, PhD (2020) – VirtualCRASH©]
Scurlock Formula Comparison
Scurlock Formula: Xmax = 49.69’ (15.14 m)
 Throwmax = 104.69’ (31.91 m)
 Velmin = 57.81 fps (17.62 m/s)
 • Ped Sliding Dist.: 55’ (16.76 m)
 Spdmin = 39.42 mph (63.42 km/h)
 • Ped Friction Value: 0.60
 • Ped COM Height.: 3.5’ (1.06 m)
 • Ped Takeoff Angle: 10 degrees
 • Scurlock ‐ Xmax = 49.69’ (15.14 m)

True Vault Comparison:

 • Takeoff Vel.: 57.81 fps (17.62 m/s) US: SI:
 • Takeoff Angle: 10 degrees
 • COM Height: 3.5’ (1.06 m) 2.73 1 7.96 1

 • Horz Dist.: 49.68’ (15.14 m)

 [Image Source: IMPACT© ‐ Collision Reconstruction Software]

 [Source: Personal communications & conversations with Dr. Bob SCURLOCK, PhD (2020) – VirtualCRASH©]
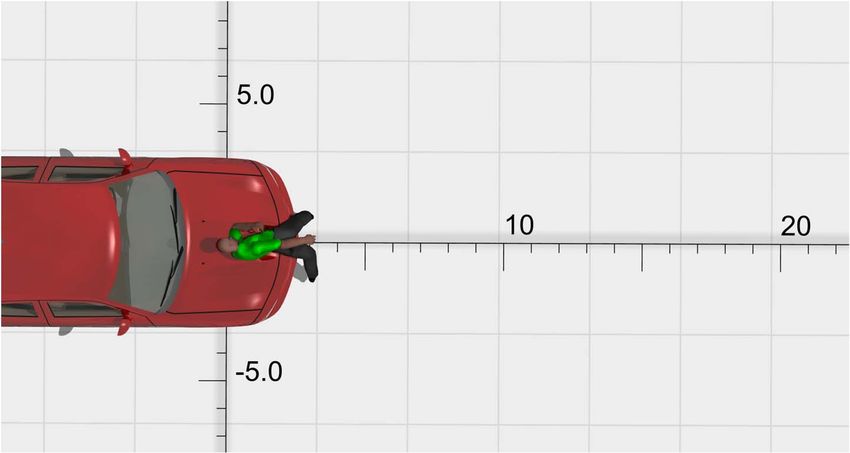
Research Protocol
Experiment Setup:

 • Same Size Pedestrian (All Tests)
 • Compact (Ford Focus Vehicle)
 • Family (Ford Crown Victoria)
 • High Front (Ford F‐150 Pickup)

Skippy:

 [Image Source: VirtualCRASH© Software Screen Captures]
Research Protocol Driver Side Center Passenger Side

Vehicle Speed/Impact Locations: [Right Leg Forward at Impact]

 • Speed: 30 mph (48.3 km/h)
 – All Tests
 • Driver Corner (Headlight Area)
 • Vehicle Centerline Area
 • Passenger Corner (Headlight Area)
 • Braking Initiated at Impact

Skippy: [Left Leg Forward at Impact]

 • Movement: (Right to Left)
 • Pedestrian Speeds:
 0, 2, 4, 6, 8, 10, 15 mph
 0, 3.2, 6.4, 9.6, 12.8, 16, 24.1 km/h
 • Left Leg Forward at Impact
 • Right Leg Forward at Impact

 [Image Source: VirtualCRASH© Software Screen Captures]
Research Results Compact Veh. Family Veh. Full‐Size Veh.
 [Left Leg Forward at Impact]
Experiment Vehicle Comparisons

 • Vehicle Speed: 30 mph (48.2 km/h)
 • Pedestrian Speed: 4 mph (6.4 km/h)
 • Impact Area: Driver’s Corner
 • Left Leg Forward at Impact
 • Right Leg Forward at Impact

Results: [Right Leg Forward at Impact]

 • Throw Distances:
 36.66 ft to 57.69 ft (11.17 m to 17.58 m)
 • X‐Axis Distances:
 35.97 ft to 57.63 ft (10.96 m to 17.57 m)
 • Y‐Axis Distances:
 0.31 ft to 7.09 ft (0.31 m to 2.16 m)
 • Offset Trajectory Angles: [R or L – Right or Left]
 1.48 deg [R] to 11.15 deg [R]
 [Experiment Data Source: Available Through an Internet Download Link]
Research Data Collected
Compact Vehicle Impacts:

 • Impact Area: Driver’s Corner • Impact Area: Driver’s Corner
 • Average Speed: ‐8.52 mph (‐13.7 km/h) • Average Speed: ‐8.65 mph (‐13.9 km/h)

 [Speeds Comparison: Speeds are compared to Searle Minimum Formula]
Research Data Collected
Compact Vehicle Impacts:

 • Impact Area: Centerline • Impact Area: Centerline
 • Average Speed: ‐4.64 mph (‐7.46 km/h) • Average Speed: ‐4.52 mph (‐7.27 km/h)

 [Speeds Comparison: Speeds are compared to Searle Minimum Formula]
Research Data Collected
Compact Vehicle Impacts:

 • Impact Area: Passenger’s Corner • Impact Area: Passenger’s Corner
 • Average Speed: ‐4.99 mph (‐8.02 km/h) • Average Speed: ‐3.57 mph (‐5.74 km/h)

 [Speeds Comparison: Speeds are compared to Searle Minimum Formula]
Research Data Collected
Family‐Size Vehicle Impacts:

 • Impact Area: Driver’s Corner • Impact Area: Driver’s Corner
 • Average Speed: ‐6.18 mph (‐9.94 km/h) • Average Speed: ‐6.00 mph (‐9.65 km/h)

 [Speeds Comparison: Speeds are compared to Searle Minimum Formula]
Research Data Collected
Family‐Size Vehicle Impacts:

 • Impact Area: Centerline • Impact Area: Centerline
 • Average Speed: ‐4.05 mph (‐6.51 km/h) • Average Speed: ‐4.97 mph (‐7.99 km/h)

 [Speeds Comparison: Speeds are compared to Searle Minimum Formula]
Research Data Collected
Family‐Size Vehicle Impacts:

 • Impact Area: Passenger Corner • Impact Area: Passenger Corner
 • Average Speed: ‐4.03 mph (‐6.48 km/h) • Average Speed: ‐3.36 mph (‐5.40 km/h)

 [Speeds Comparison: Speeds are compared to Searle Minimum Formula]
Research Data Collected
Pick‐Up Impacts:

 • Impact Area: Driver’s Corner • Impact Area: Driver’s Corner
 • Average Speed: ‐2.82 mph (‐4.53 km/h) • Average Speed: ‐1.57 mph (‐2.52 km/h)

 [Speeds Comparison: Speeds are compared to Searle Minimum Formula]
Research Data Collected
Pick‐Up Impacts:

 • Impact Area: Centerline • Impact Area: Centerline
 • Average Speed: ‐1.58 mph (‐2.54 km/h) • Average Speed: ‐2.44 mph (‐3.92 km/h)

 [Speeds Comparison: Speeds are compared to Searle Minimum Formula]
Research Data Collected
Pick‐Up Impacts:

 • Impact Area: Passenger Corner • Impact Area: Passenger Corner
 • Average Speed: ‐0.99 mph (‐1.59 km/h) • Average Speed: ‐1.42 mph (‐2.28 km/h)

 [Speeds Comparison: Speeds are compared to Searle Minimum Formula]
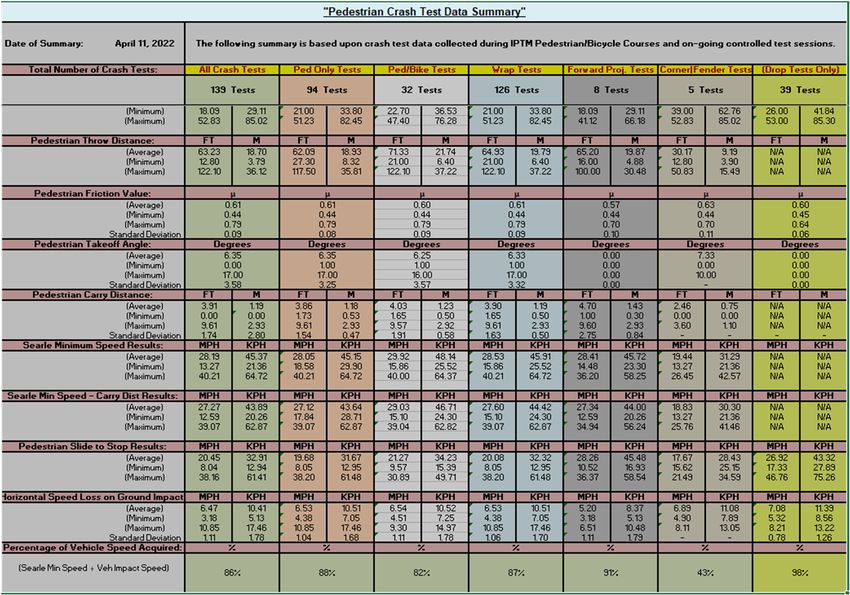
Rotational Effects on Trajectories
Left Leg Forward at Impact Rotational Effects: Time: + 0.00 seconds

 • Results in Lower‐Leg Clockwise
 Rotation
 • Tends to Decrease Lateral
 Separation Distance From Vehicle
 or Trajectory
 • Leading Leg (Closest to Veh.)
 Makes Contact First and Initiates
 Clockwise, Lower‐Body Rotation

 [Image Source: VirtualCRASH© Software Screen Captures]
Rotational Effects on Trajectories
Left Leg Forward at Impact Rotational Effects: Time: + 0.069 seconds

 • Results in Lower‐Leg Clockwise
 Rotation
 • Tends to Decrease Lateral
 Separation Distance From Vehicle
 or Trajectory
 • Leading Leg (Closest to Veh.)
 Makes Contact First and Initiates
 Clockwise, Lower‐Body Rotation

 [Image Source: VirtualCRASH© Software Screen Captures]
Rotational Effects on Trajectories
Left Leg Forward at Impact Rotational Effects: Time: + 0.149 seconds

 • Results in Lower‐Leg Clockwise
 Rotation
 • Tends to Decrease Lateral
 Separation Distance From Vehicle
 or Trajectory
 • Leading Leg (Closest to Veh.)
 Makes Contact First and Initiates
 Clockwise, Lower‐Body Rotation

 [Image Source: VirtualCRASH© Software Screen Captures]
Rotational Effects on Trajectories
Left Leg Forward at Impact Rotational Effects: Time: + 0.279 seconds

 • Results in Lower‐Leg Clockwise
 Rotation
 • Tends to Decrease Lateral
 Separation Distance From Vehicle
 or Trajectory
 • Leading Leg (Closest to Veh.)
 Makes Contact First and Initiates
 Clockwise, Lower‐Body Rotation

 [Image Source: VirtualCRASH© Software Screen Captures]
Rotational Effects on Trajectories
Right Leg Forward at Impact Rotational Effects: Time: + 0.0 seconds

 • Results in Counterclockwise
 Lower‐Leg Rotation
 • Tends to Increase Lateral
 Separation Distance From Vehicle
 or Trajectory
 • Leading Leg (Closest to Veh.)
 Makes Contact First and Initiates
 Counterclockwise, Lower‐Body
 Rotation

 [Image Source: VirtualCRASH© Software Screen Captures]
Rotational Effects on Trajectories
Right Leg Forward at Impact Rotational Effects: Time: + 0.069 seconds

 • Results in Counterclockwise
 Lower‐Leg Rotation
 • Tends to Increase Lateral
 Separation Distance From Vehicle
 or Trajectory
 • Leading Leg (Closest to Veh.)
 Makes Contact First and Initiates
 Counterclockwise, Lower‐Body
 Rotation

 [Image Source: VirtualCRASH© Software Screen Captures]
Rotational Effects on Trajectories
Right Leg Forward at Impact Rotational Effects: Time: + 0.149 seconds

 • Results in Counterclockwise
 Lower‐Leg Rotation
 • Tends to Increase Lateral
 Separation Distance From Vehicle
 or Trajectory
 • Leading Leg (Closest to Veh.)
 Makes Contact First and Initiates
 Counterclockwise, Lower‐Body
 Rotation

 [Image Source: VirtualCRASH© Software Screen Captures]
Rotational Effects on Trajectories
Right Leg Forward at Impact Rotational Effects: Time: + 0.279 seconds

 • Results in Counterclockwise
 Lower‐Leg Rotation
 • Tends to Increase Lateral
 Separation Distance From Vehicle
 or Trajectory
 • Leading Leg (Closest to Veh.)
 Makes Contact First and Initiates
 Counterclockwise, Lower‐Body
 Rotation

 [Image Source: VirtualCRASH© Software Screen Captures]
Pedestrian Friction Values

 • Searle’s Sandbag Method: 0.69 Mean
 • Searle Suggested Value: 0.66 (Asphalt)
 • Searle Suggested Value: 0.70 (Asphalt)
 • Hill’s Friction Results: 0.69 Mean
 • Bovington’s Friction Results: 0.58 Mean
 • IPTM Dummy Results: 0.59 Mean
 • IPTM Crash Tests (139 tests): 0.61 Mean
 • CATAIR Winter Testing: 0.52 Mean
 • Mean Value: 0.63
 • Std. Dev.: 0.06

 [Source: Controlled Crash Tests by Becker & Reade]
Crash Data Summary

 [Source: Controlled Crash Tests by Becker & Reade]
Resource Materials
• Updated Presentation Link:
 • http://www.frsi.ca/IPTM/2022IPTMSPReade.zip
• Additional Pedestrian‐Related Papers:
 • http://www.frsi.ca/IPTM/2022AdditionalPapers.zip
• Reference Material:
 • Fundamentals of Pedestrian/Cyclist Traffic Crash Reconstruction
 • IPTM Online Store: By: Becker & Reade
 • Fundamentals of Traffic Crash Reconstruction
 • IPTM Online Store: By: Daily & Shigemura & Daily

• Reconstruction Software
 • IMPACT© ‐ Collision Reconstruction Software (NEW 2022!)
 • http://www.frsi.ca/IMPACT/index.html
THANK YOU!
For attending this session. If you have any follow‐up questions, please
contact me by the following email address: mreade@frsi.ca
If I can help you in anyway, please do not hesitate to reach out.
Regards,

 Mike Reade
 Email:mreade@frsi.ca
 Web: http://www.frsi.ca
 Software: http://www.frsi.ca/IMPACT/index.html
You can also read