A Review of developments in The Global & Indian Steel Industry - Monthly edition Issue No. 53 - A Review of developments in The Global ...
←
→
Page content transcription
If your browser does not render page correctly, please read the page content below
A Review of developments
                          in
          The Global & Indian Steel Industry
                                         Monthly edition
                                              Issue No. 53
                                    AUGUST 2020 (Covering JULY 2020)

Compiled on behalf of Indian Steel Association,
By Mr. Anup Kashyap,
Deputy Manager-Technical

Strictly for Internal circulation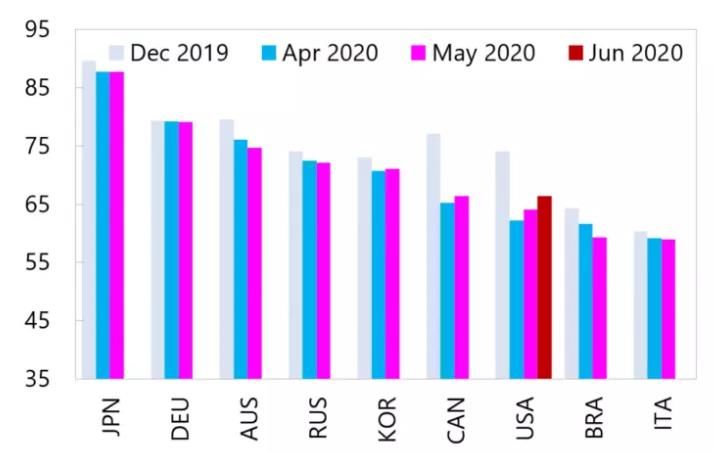
About the Report The Indian Steel Association introduced a monthly report titled ‘A REVIEW OF DEVELOPMENTS IN GLOBAL & INDIAN STEEL INDUSTRY’, from August 2016. The report provides general background information reviewing the status of the developments in the global and Indian steel industry, pertaining to raw material, production & consumption, trade, shipping, pricing & forecasts, country reportage, policy developments, economic parameters etc. The consistent format of the report provides an insight into the relevant aspects of steel scenario globally and domestically . The information has been sourced from independent third party databases, knowledge sources and news reports, and the authenticity of the same has not been independently verified by ISA. The report is issued in the last week of each month to the members of Indian Steel Association , various ministries / departments / institutions.

Contents of the Report

 SI. Title                           Page
 No                                 Number

 1.   Global Economic Development    4-7

 2.   Global Steel Development       8-13

 3.   Domestic Steel Development    14-19

 4.   Indian Economic Development   20-22

 5.   About ISA                     23-29
GLOBAL ECONOMIC DEVELOPMENTS

                           4
Country-wise Growth Forecasts
                                                                                                 2020 - 2024

  Countries                  in %                   2020             2021             2022       2023   2024

                     Real GDP Growth                  1.7              8.0              5.5      5.3    5.0
     China
                           Inflation                  3.7              3.1              3.0      2.9    2.7

                     Real GDP Growth                 -8.5              9.1              5.5      6.3    5.9
      India
                           Inflation                  3.4              3.6              4.5      4.2    4.4

                     Real GDP Growth                 -5.2              1.7              1.4      1.1    1.3
     Japan
                           Inflation                  0.2              0.4              0.7      0.9    1.2

                     Real GDP Growth                 -5.3              3.7              2.6      2.2    2.0
      USA
                           Inflation                  0.7              1.7              1.9      2.2    1.9

                     Real GDP Growth                 -8.1              5.3              3.0      2.3    1.9
     EU 27
                           Inflation                  0.7              1.3              1.7      1.8    1.8
 As of August 18th ,2020 .
 The assumptions for forecasts are available on the website of the Economist Intelligence Unit

Source: Global Forecasting Service, The Economic Intelligence Unit                                             5
Global Economic Outlook
• The coronavirus (Covid-19) pandemic will have a huge and lasting negative effect on the
global economy; 2020 and 2021 will be lost years in terms of growth and developments. The
pandemic will also place a heavy fiscal burden in both developed and developing countries.
• The US government passed two emergency relief bills at the start of the crisis, worth nearly
US$3trn. Some of the landmark elements of these bills have been extended, for example the
Paycheck Protection Programme (PPP), which will continue to offer forgivable loans to small
businesses from the original pool of funding. However, others, including supplementary
unemployment benefits of US$600/week, lapsed at end-July, when the programme expired.
• In July EU leaders agreed on a European economic recovery fund for 2021-24, involving
unprecedented joint debt issuance (worth €750bn, or US$888.2bn), to be channelled to the
less developed economies in the bloc and those hardest hit by the pandemic.
• Compared with those seen in North America and Europe, fiscal stimulus packages have been
modest across Asia. For the region as a whole, total fiscal spending will eventually amount t0
US$3trn. Factoring in a challenging year for economic growth and the likelihood that not all
of this spending will be on budget (especially in the case of China), this will push the regional
aggregate budget deficit ratio above 5%, which will, in turn, fuel public debt ratios
Source-Global Forecasting Service, The Economist 6Effects of COVID-19 on Economy In the COVID recession, economic conditions are too closely tied to the pandemic’s trajectory to be able to forecast with confidence the course of recovery. The decline in output and employment was much larger, and happened much faster, than in the Great Recession, and the early V-shaped recovery appears to be slowing – and is likely to continue at a more modest pace. The likely long-run effects include a huge loss of small businesses and human capital (due to unemployment and online-only instruction); more permanent telecommuting; acceleration of the digital transformation; and increased concentration and decreased competition in some sectors. COVID-19 has caused a recession from which global economies are only expected to recover by late 2022, if a vaccine is available Source-IMF and Global Data source-World Bank 7
GLOBAL STEEL DEVELOPMENTS

                            8
Global Steel Outlook World crude steel production for the 64 countries reporting to the World Steel Association (world steel) was 152.7 million tonnes (Mt) in July 2020, a 2.5% decrease compared to July 2019. China produced 93.4 Mt of crude steel in July 2020, an increase of 9.1% compared to July 2019. Japan produced 6.0 Mt of crude steel in July 2020, down 27.9% on July 2019. South Korea’s steel production for July 2020 was 5.5 Mt, down by 8.3% on July 2019. Germany produced 2.4 Mt of crude steel in July 2020, down 24.7% on July 2019. Production in the EU overall is estimated to be 9.8 Mt of crude steel in July 2020, down by 24.4% on July 2019. The United States produced 5.2 Mt of crude steel in July 2020, a decrease of 29.4% compared to July 2019. Production in the C.I.S. is estimated to be 8.1 Mt in July 2020, down 5.8% on July 2019. Ukraine produced 1.8 Mt of crude steel in July 2020, down 1.9% on July 2019. Turkey’s crude steel production for July 2020 was 3.1 Mt, up by 7.4% on July 2019. Source-World Steel Association 9
Region wise Crude Steel Production
The region wise crude steel production is provided in the chart below.
Jan-Jul Jan-Jul % Change
Region
2020 in (MT) 2019 in (MT)
EU-28 78.361 96.958 -19.2
CIS 57.010 59.584 -4.3
N. America 57.621 70.898 -18.7
S. America 20.811 25.130 -17.2
Africa 6.939 8.553 -18.9
Middle East 22.899 22.987 -0.4
Asia 759.257 774.893 -2.0
Oceania 3.487 3.538 -1.4
World 1027.409 1084.606 -5.3
Year on Year this reflects an decrease of crude steel production of 5.3%.
Source-World Steel Association 10World's Topmost Crude Steel Makers
July 2020
The world crude steel production totalled 152.694 million tonnes (Mt) in July this year, as
compared with the output of 156.679 Mt a year before.
Out of the leading steel producers, only China recorded higher steel output over the
previous year. Among regions, all except Asia, Oceania and Other Europe posted reduced
output
Top 10 Crude Steel makers in July 2020,Figures in metric tons
1,00,000 80,000 60,000 40,000 20,000 0
93,359 1.China
7,150 2.India
6,049 3.Japan
China, India and Japan continued to be the world’s 5,800 4.Russia
largest steel producers in the month of July 2020. 5,526 5.South Korea
5,241 6.USA
3,143 7.Turkey
2,592 8.Brazil
2,423 9.Germany
2,339 10 Iran
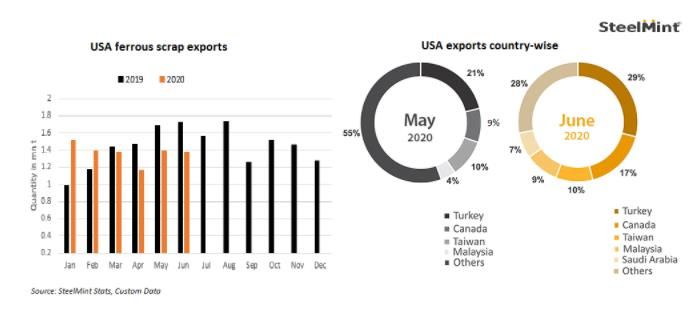
Source-World Steel and SEASI. 11Trend in USA Ferrous Scrap export
Ferrous scrap exports from the US fell by 3% y-o-y in H1 CY '20. The country exported
8.23 Mnt during Jan-Jun '20 in comparison with 8.51 Mnt during Jan-Jun '19.
Exports moved down on lowered scrap collection rates due to COVID-19 and tight scrap
availability due to pandemic shutdown. US scrap exporters were initially affected in
February-April by a global shortage of containers caused by lockdown measures in China,
followed by disruption to scrap collection and processing as the virus spread across the US
during the spring.
Source-Steel Mint 12Australian Coking Coal Prices
• Australian premium low-volatile (PLV) hard coking coal (HCC) price has increased
marginally during the latter half of the week, with fresh bookings done on FOB basis,
but medium-volatile HCC price has edged lower amid subdued demand in China.
Source-Coal Mint Research 13DOMESTIC STEEL DEVELOPMENTS
14Performance of Indian Steel Industry
Indian Steel Scene(Million Tons)
Items April-Aug April-Aug
% Change (Prov.)
2020 (Prov.) 2019 (Final)
Crude Steel Production 33.552 46.228 -27.4
Hot Metal Production 24.298 30.935 -21.5
Pig Iron Production 1.619 2.548 -36.5
Total Finished Steel ( Alloy + Non Alloy)
Production 29.05 43.515 -33.2
Import 1.667 3.453 -51.7
Export 5.680 2.917 94.8
Consumption 26.406 42.539 -37.9
Source-Joint Plant Committee, Ministry of Steel 15Trend in Iron Ore Prices
Physical Composition of this Iron Ore- 5-18mm,Fe-63 %,DR Grade
Taxes-Inclusive of Royalty (15%), DMF (4.5%) & NMET (2%). GST @ 5% extra
Odisha Index Prices-Price At which Iron Ore was actually traded in these Months.
Prices are till August 21st ,2020
Iron Ore Prices in Rupees
5550
6000
5000 4650
3750
4600
4000 4850
3450 3450
3000 3700
2000
1000
0
Dec-19 Jan-20 Mar-20 Apr-20 Jun-20 Aug-20 Sep-20
Source-IBM, Ministry of Mines 16Trend in Coal Supply • Coal ministry has approved supply under annual contracted quantity (ACQ) to 100% of the normative requirement for power plants, subsequent to the request made by CIL. • Normative requirement represents coal demand of a thermal power station based on its capacity, heat rate, boiler specifications and coal usage. • However, with excess stock availability and sluggish demand from non-power sector, CIL had asked to amend the directives in order to raise coal supplies for power sector under this route, which has been duly accepted. The company has highlighted that around 15 mnt would be committed upon enhancement of ACQ and this also enable it to implement the import substitution by supplying the excess volume without charging additional cost in the form of performance incentive, which has been relaxed to reduce the financial burden of power producers. Source-Coal Mint Research 17
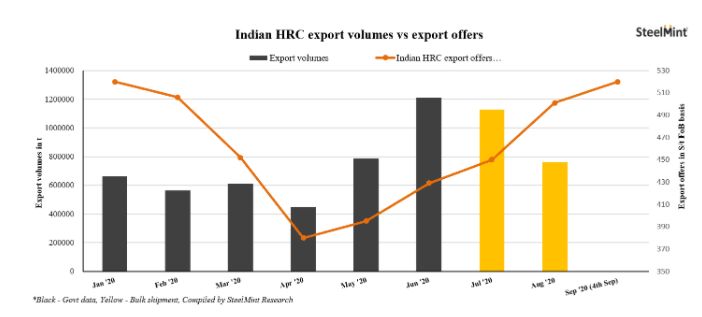
Trend in HRC Export Prices Indian HRC export prices records seven months high. Similar price levels were last seen in the month of Feb'20. Meanwhile Indian steel mills increased HRC export offers further by $10/t in recent deals concluded at around $535/t CFR basis for Oct shipments, against the last bookings which were reported in the range of $525-527/t CFR basis for Sep end shipments. Source-Steel Mint 18
Domestic Steel Price-Hot Rolled Coil
Physical Composition of Hot Rolled Coil-2.5-8 mm, IS 2062
Taxes-GST @ 18% extra.
This is Ex-Mumbai Price
Prices are till August 23rd ,2020.
Hot Rolled Prices in INR
42,000
41,000 40,750
40,000
39,500
39,000 38,250
38,000
36,750
37,000 36,250 37,000
37,750
36,000
35,000 36,000
34,000
33,000
Jan-20 Feb-20 Mar-20 Apr-20 May-20 Jun-20 Jul-20 Aug-20
Source- 19INDIAN ECONOMIC DEVELOPMENTS
20Highlights of Indian Economy
Aug. 2020
India’s economy contracted by 23.9 per cent in the first quarter of the current fiscal. It is for
the first time in 40 years when the GDP registered negative growth.
While the construction activity halved in first quarter, the manufacturing sector had a free-
fall. GVA of mining shrank 23.3 per cent; manufacturing 39.3 per cent; and construction fell
50.3 per cent.
All sectors except agriculture shrank in the first quarter. Agri GVA rose 3.4 per cent. While
private consumption expenditure fell on-year, the government expenditure rose significantly.
PFCE stood at 54.3 per cent of GDP, compared to 56.4 per cent last year; and GFCE shot
up from 11.8 per cent to 18.1 per cent in Q1.
With the latest data, there will be more clarity to assess the severity of the damage done to
the economy by the coronavirus pandemic and how to look after the economic revival in
the coming quarters. The first quarter saw an unprecedented closure of shops, markets, and
industries, which forced the wheels of the economy to a standstill. Except for agriculture,
almost all the corners of the economy were severely hit.
Steel, cement output sees the steepest fall in July. Steel fell 16.4 per cent while
cement shrank 13.5 per cent.
Source-CMIE , Ministry of Finance-Government of Indian 21Rates at Reserve Bank of India
2020
Reference Rates
Date Lending/ Deposit Rates
Currency
Aug 28,2020 Base Rate : 7.40-9.00%
I USD 73.35 Savings Deposit Rate : 2.70-3.00%
1 EUR 87.06 MCLR (Overnight) : 6.65-7.20%
Term Deposit Rate > 1 year : 5.00-5.40%
1 GBP 97.28
100 YEN 69.03
Policy Rates Reserve Ratios
Policy Repo Rate : 4.00% CRR : 3.00%
Reverse Repo Rate : 3.35% SLR : 18.00%
Marginal Standing Facility Rate : 4.25%
Bank Rate : 4.25%
Source: Reserve Bank of India 22ABOUT ISA
23About ISA The Indian Steel Association (ISA) is the voice of the Indian Steel Industry, in both domestic and global forums. It is at the forefront of all deliberations pertaining to matters of public & regulatory policy, raw materials, international trade, logistics, environmental concerns, technology and other aspects of steel-making. The Indian Steel Industry looks at ISA to further its critical agenda of sustained growth, both in steel production and in generating domestic demand. ISA was formed in 2014 and has 14 members – Five full members and Nine affiliates. The list of full members includes –Steel Authority of India (SAIL) and Rashtriya Ispat Nigam Ltd (RINL) – while heavyweights from the private sector include JSW Steel Ltd , Jindal Steel and Power Ltd, ArcelorMital Nippon Steel India Ltd. ISA, an affiliate member of World Steel Association (WSA), regularly collaborates with WSA on the organisation of events, as well as taking part in other key meetings with global partners. 24
Members of Indian Steel Association

Our Five Full Members are
  • Steel Authority of India Ltd.
  • JSW Steel Ltd.
  • Rashtriya Ispat Nigam Ltd.
  • ArcelorMittal Nippon Steel
      India Ltd.
  • Jindal Steel & Power Ltd.

Our Nine Affiliate Members are
Monnet Ispat & Energy Ltd., INSDAG
(Institute for Steel Development and
Growth), KISMA (Karnataka Iron and
Steel Manufacturer’s Association),
Arjas Steel, Jindal Stainless, Electro
steel     Steels   ,Shyam    steel    ,
Shyam Metalics and Orissa Metalliks
Pvt. Ltd
                                          (Orissa Metalliks Pvt. Ltd.)
                                                                         25
Vision and Objectives of ISA
Vision of ISA-
To work towards transforming the Indian Steel Industry as a
global leader acclaimed for its Quality, Productivity and
Competitiveness, with a focus on health, safety and
environment, along with a growing thrust on innovation through
R&D, adopting an inclusive and collective approach.
Objectives of ISA-
Promoting steel by raising awareness about the numerous
advantages of good quality steel
Collaborating with international steel organizations to
tackle issues of mutual interest.
Working with the government on matters affecting the
steel industry.
26Important Ministries/Department/Organization
Ministry of Steel
Name of the person Designation Contact Details
Shri Pradip Kumar Tripathi Secretary secy-steel@nic.in
Smt. Rasika Chaube Additional Secretary rasikachaube@nic.in
Smt. Ruchika Chaudhry Govil Joint Secretary ruchika.govil@nic.in
Ministry of Mines
Name of the person Designation Contact Details
Shri Anil Kumar Jain Secretary secy-mines@nic.in
Dr. K. Rajeswara Rao Additional secretary as_mines@nic.in
Ministry of Commerce
Name of the person Designation Contact Details
Shri Anup Wadhawan Secretary csoffice@nic.in
Shri Alok Vardhan Chaturvedi DGFT dgft@nic.in
Dr. K.C.Rout Additional Secretary-DGFT kcrout@nic.in
Ministry of Environment, Forest and Climate Change
Name of the person Designation Contact Details
Shri Rameshwar Prasad Gupta Secretary secy-moef@nic.in
Control Pollution Central Board
Name of the person Designation Contact Details
Shri Ravi Shankar Prasad Chairman ccb.cpcb@nic.in
Dr. Prashant Gargava Member Secretary mscb.cpcb@nic.in
Ministry of Finance
Name of the person Designation Contact Details
Shri Debasish Panda Secretary secy-fs@nic.in
27Contact Us for data related issues
Address:207-208, 2nd Floor
Kailash Building
New Delhi -110-001
India
Tel: +011 4266 8811
Fax: +011 4266 8805
E-mail: a.kashyap@indsteel.org
Website: http://indsteel.org/
28THANK YOU
DISCLAIMER
The material in this presentation has been prepared by Indian Steel Association (ISA) and is a general background information reviewing the
status of the developments in the global and Indian steel industry as at the date of this presentation. This presentation is strictly for internal use
of all the member companies of ISA, whose names have been stated in the presentation.
Information is given in summary form and does not purport to be complete or all inclusive. The information has been sourced from independent
third party databases, knowledge sources and news reports, and the authenticity of the same has not been independently verified by ISA.
Additionally, any third party forecasts on financial or economic parameters, projections or estimates should not be construed as an investment
advice or a recommendation to any ISA member. Recipients of this presentation from member companies of the ISA should each make their own
evaluation of the contents and adequacy of the information contained in the presentation.
ISA does not undertake any obligation to publicly release any changes to any revisions, modifications or forward looking statements in the
subsequent editions of this bi-monthly presentation. Unless otherwise specified, all information is for the period AUGUST 2020 or prior.
29You can also read


