A Pro le of Paci c Islanders in Oakland, California - Center on Culture, Immigration and Youth Violence Prevention, National Council on Crime ...
←
→
Page content transcription
If your browser does not render page correctly, please read the page content below
A Prole of Pacic Islanders in
Oakland, California
Center on Culture, Immigration and Youth Violence Prevention,
National Council on Crime and Delinquency
Lila K. Booth
September 2007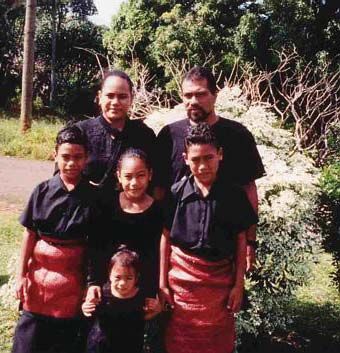
Cover information
Map Source: http://www.topsecretnet.com/intelink/werzit/maps/oceania.html
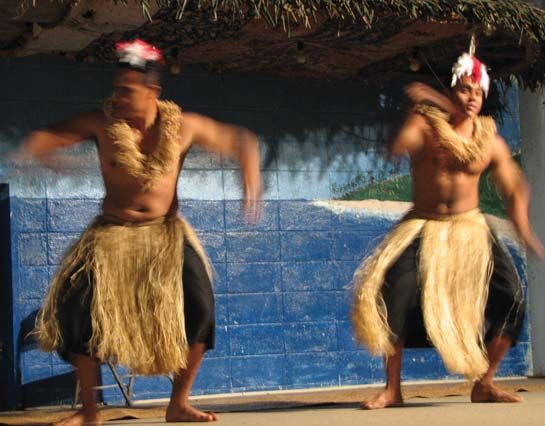
Pictures (clockwise from top right corner):
Family Reunion Fa’a Samoa—the Samoan Way (2005), http://www.ickr.com/photos/wiphey/33097418/
Dancer at National Council on Crime and Delinquency, Oakland, CA (2003)
Dancers at the Tongan Cultural Centre in Tongatapu, Tonga (2007), http://www.ickr.com/photos/
unincorporated/531209406/in/set-72157600313252988
Tongan children (2005), http://www.ickr.com/photos/nicole1980/67424927/in/set-72157594270978152
Uganda vs. Samoa (Rugby 7s), Melbourne XVIII Commonwealth Games (2006), http://www.ickr.com/photos/
kiaorabro/114994827/
Ready for Sunday church, Vava’u, Tonga (2001), http://www.ickr.com/photos/nicole1980/633690/in/set-
72157594270978152/
Lotus in Guam (2005), http://ickr.com/photos/santos/45292766/
Hip Hop Tonga, AYPAL May Arts Performance (2007)
NATIONAL COUNCIL ON CRIME AND DELINQUENCY
Headquarters Ofce 1970 Broadway Suite 500, Oakland, CA 94612
(510) 208-0500 FAX (510) 208-0511
Midwest Ofce 426 S. Yellowstone, Suite 250, Madison, WI 53719
(608) 831-8882 FAX (608) 831-6446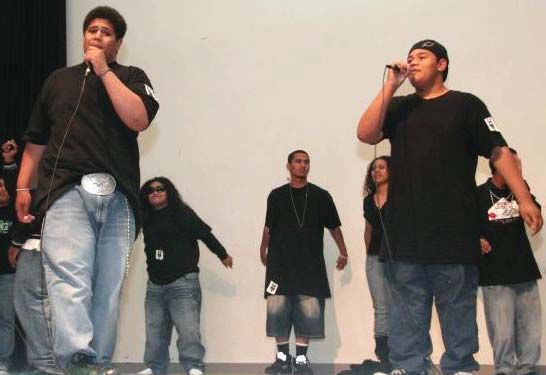
A Profile of Pacific Islanders in Oakland, California
     Pacific Islanders represent less than one percent (1%) of Oakland’s population and as a result
     may be overlooked or categorized with other disparate communities. Although small in numbers,
     this community has its unique issues and concerns including the distinctly different groups (such
     as Polynesian and Micronesian) that comprise the Pacific Islander community itself. At the same
     time it shares issues in common with other immigrant communities (e.g., Latino and Asian) that
     should not be overlooked as Pacific Islanders develop a Pacific Islander American identity.

                                                     Oakland Population, 2000
  African                                                  Hispanic
 American                                                   21.8%                                                     Samoan
  34.8%                                                                                                                18.2%

                                                                                                                             Native Hawaiian
                                                                   NHPI
                                                                   NHPI                      Tongan                                14.2%
                                                                   0.8%
                                                                   0.8%                      43.9%
                                                                                                                        Other Pacific Islander
                                                                                                                                8.1%
                                                           Asian                      Other Polynesian                    Other Micronesian
Other*                                                    14.9%                            2.5%                                 1.0%
3.8%                                                  AIAN                                                             Guamanian or Chamorro
                     White                            0.4%                                                                     12.1%
                     23.4%
                           N = 399,477                                                                 N = 3,371
Source: U.S. Census 2000. AIAN refers to American Indian or Alaskan Native and NHPI refers to Native Hawaiian or Pacific Islander. All ethnic
groups are alone except for NHPI and its subcategories which includes alone or in combination with another race/ethnic group.
*Other includes both Other Ethnic group and Two or More Ethnic groups.

     Since this profile is specific to the Oakland, California                                            Oceania subsections
     Pacific Islander community, its scope is limited by                                       Micronesia: Federated States of
     population (e.g., primarily Tongan, Samoan, Native                                        Micronesia, Republic of the Marshall
     Hawaiian, Guamanian or Chamorro, and some Fijian                                          Islands, U.S. Territories of Guam
     individuals!there are not enough Fijian households or                                     and Wake Island, Palau, Northern
     families to be included in the Census data) and location; not                             Mariana Islands, Nauru, and Kiribati.
     only are they not representative of all Pacific Islanders but
     their experience may be unique to Oakland (vs. other San                                  Polynesia: Hawai’i, New Zealand,
     Francisco Bay Area communities, Los Angeles, or                                           Easter Island, Samoa, Tonga, Cook
     California’s Central Valley). Hopefully, it will become                                   Islands, Tuvalu, and Wallis and
     clear that although other groups originating from Oceania                                 Futuna.
     (e.g., Papua New Guinea, New Zealand (Maori), or
     Solomon Islands) are not included, it would be a disservice                               Melanesia: Fiji, Papua New Guinea,
     to assume their experiences or circumstances would be the                                 Solomon Islands, Vanuatu, and New
     same as other Pacific Islanders in Oakland or in other                                    Caledonia.
     locations since each group is unique.

     While evaluating the following charts and graphs, please bear in mind the following. A high
     percentage of Pacific Islanders are multi-ethnic and therefore may be included in statistics for a

                                                                         1
                                                                         1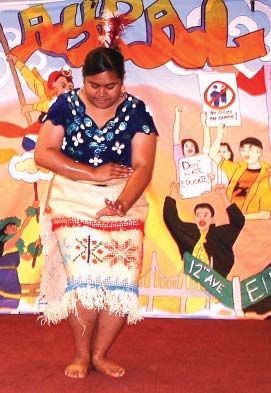
different ethnic group. Census data included in this report represents the ethnic group alone or in
   combination with another, so the total may not be the sum of the separate groups. For instance, if
   an individual reported in the Census as being both Tongan and another Pacific Islander group,
   they would be represented in both of those groups. The numbers are already very small, so the
   risk of counting individuals twice was acceptable in order to try to include all members of the
   community.

   In addition, the Pacific Islander group may at times be greater than the sum of the separate
   groups because some members of a group were not disaggregated into a separate group because
   of small numbers (e.g., Melanesians including Fijians) but they are still included in the Pacific
   Islander category.

   Finally, the Pacific Islander group ‘Guamanian and Chamorro’ refer to Micronesian people from
   Guam and the Northern Mariana Islands who are also sometimes referred to as ‘Chamoru.’

   Population

       !      Compared to the total Oakland population, Pacific Islanders have a higher proportion of
              young people.
       !      Over a third of the Pacific Islander population was under 18 years old at Census 2000 as
              compared to 25% of the Oakland population.
       !      Less than 4% were 65 years or older.
       !      Most notably, almost half (47%) of Tongans were under 18 years old and over a quarter
              (28.1%) were under 10 years old.

                                                  Population Distribution by Age
                                                                        Under 10, 21.7%
    Pacific                                              10-17, 16.7%
                                               18-25, 13.6%
   Islander                                                                             26-40, 25.0%                               Under 10
  (N=3,218)                                                        41-64, 19.4%
                           3.6%                                                                                                    10-17
                                                    Under 10, 16.5%
   Native                                              10-17, 14.3%                                                                18-25
                                            18-25, 13.0%
  Hawaiian                                                                                   26-40, 26.9%                          26-40
  (N=547)                                                                         41-64, 23.8%
                                  5.7%                                                                                             41-64
                                                              10-17, 18.1%
                                                                                 Under 10, 24.1%                                   65 and older
   Samoan                                            18-25, 15.6%
   (N=514)                                                                                26-40, 25.9%
                                                  41-64, 14.6%
                    1.8%
                                                                                              Under 10, 28.1%
                                                                  10-17, 19.3%
   Tongan                          18-25, 10.2%
  (N=1,129)                                                                       26-40, 23.6%
                                                       41-64, 16.1%
                         2.7%
                                                                      Under 10, 21.2%
 Guamanian                         10-17, 9.9%
                                                         18-25, 16.5%
or Chamorro                                                                                              26-40, 30.2%
  (N=212)                                                   41-64, 17.5%
                                4.7%
                                          Under 10, 13.3%
                                                            10-17, 17.1%
    Fijian                                                                         18-25, 23.8%
   (N=105)                                             26-40, 16.2%
                                                                                                   41-64, 28.6%
                  1.0%

           0.0%                             10.0%                              20.0%                              30.0%                           40.0%
           Source: US Census 2000
                                                                              2 since some categories may not be disaggregated from total.
           Note: The sum of the individual categories may not equal the total group
Immigration

                                    !   Approximately a third (34%) of Oakland’s Pacific Islander population was born outside
                                        the US.
                                    !   Of Pacific Islanders not born in the US, over half entered the US after 1985.

                                                                                      Entry Year of Foreign-Born
                             100%

                             90%
                                                          1990s
                                                          31.2%                                                                                                          1990s
                                                                             1990s                                                  1980s              1990s
                             80%                                                                                                                                         37.1%
                                                                             40.7%                                                  42.9%              43.5%

                             70%                                                               1970s
                                        1990s
                                                                                               65.4%
Percentage of Foreign-Born

                                        68.2%
                             60%
                                                                                                                  1990s
                                                                                                                  91.9%
                             50%
                                                          1980s              1980s                                                                                       1980s
                                                          46.7%              29.6%
                                                                                                                                                       1980s             37.8%
                             40%
                                                                                                                                                       34.9%

                             30%                                                                                                    1970s
                                                                                                                                    57.1%

                             20%                                                               1960s
                                        1970s                                1960s                                                                     1970s             1970s
                                        31.8%                                                  34.6%
                                                          1970s              29.6%                                                                     11.9%             19.9%
                             10%                          21.1%
                                                                                                                  1980s                                1960s
                                                                                                                                                       9.7%               1960s
                                                                                                                  8.1%
                              0%                       1960s, 1.0%                                                                                                        5.2%
                                    Native Hawaiian Tongan (N=673) Samoan (N=27) Other Polynesian             Guamanian or          Other           Other Pacific      All Pacific
                                        (N=22)                                       (N=52)                    Chamorro           Micronesian     Islander (N=278)      Islanders
                                                                                                                (N=74)             (N=21)                              (N=1,147)
                                Source: US Census 2000
                                Note: The sum of the individual categories may not equal the total group since some categories may not be computed separately from total. In addition,
                                1990s includes up until March 2000 and 1960s includes entrance before 1960 as well.

                              Families and Households

                                    !   Households include everyone at a residence, whereas families are two or more people in
                                        the residence who are related by birth, marriage, or adoption. When the average
                                        household size is larger than the average family size, the average household contains
                                        members that may include extended family although they are not defined as such by
                                        birth, marriage, or adoption. Similarly, when the average household is smaller than the
                                        average family size, a large percentage of people may be living alone, with a partner, or
                                        with friends.
                                    !   The average Pacific Islander household is 60% larger than the average Oakland
                                        household, although the average Pacific Islander family size is only 30% larger.

                                                                                                    3
Average Sizes
                                                                      Household            Family
                               Oakland Average                           2.6                3.4
                               Pacific Islander                          4.2                 4.7
                               Native Hawaiian                           2.2                 3.5
                               Samoan                                    8.7                4.9
                               Tongan                                    6.9                6.0
                               Guamanian or Chamorro                     3.1                 3.1
                               Fijian                                     --                4.1
                               Source: US Census 2000

   !   Not only do households and families have more members, but a third of all Pacific
       Islander households are overcrowded or severely overcrowded according to the US
       Census.
   !   In addition to having over 2.5 times the average household members (6.9 vs. 2.6), more
       than a quarter of all Tongan households are severely overcrowded with more than 1.5
       people per room. Over two thirds (69.5%) of all Tongan households are overcrowded or
       severely overcrowded.

                                       Overcrowded Housing Rates by Household
                Guamanian or           13.3%
              Chamorro (N=121)           7.0%

                                                             42.2%
               Tongan (N=187)
                                                 27.3%

                                                                                           78.9%
                Samoan (N=57)
                                             21.1%
                                                                                    Overcrowded
                  Native              2.5%
                                                                                    (>1 person/room)
              Hawaiian (N=163)      0.0%
                                                                                    Severely Overcrowded
                    Pacific                19.9%                                    (>1.5 person/room)
               Islander (N=785)         15.5%

                                0.0%                 25.0%              50.0%               75.0%              100.0%
                  Source: US Census 2000
                  Note: T he sum of the individual categories may not equal the total group since some categories may not be
                  disaggregated from total.

Religion

   !   Although no formal statistics about religious practices or beliefs (the US Census is not
       allowed to ask any questions regarding religion) are available, this section will itemize
       some of the local resources in Oakland.
   !   The local phonebook identifies six Samoan and Tongan-specific related places of
       worship (not to mention local Catholic and Latter Day Saint [Mormon] places of
       worship): Samoan First Assembly of God (9431 Cherry St), First Tongan Assembly of
       God (Mac Arthur Ave), Church of Tonga Tauataian (1901 Fruitvale Ave), Free Church
       of Tonga (1901 Fruitvale Ave), Melrose Tongan United Methodist Church (54th Ave &
       Wentworth Ave), Fale Maama Tongan United Methodist Church (2385 103rd Ave).

                                                                  4
!   Christianity is the primary religion in Oceania. Different denominations were introduced
      and influenced by Christian missionaries who traveled to the region. For instance, in
      Tonga (NoMoa.com 2007):
         o Methodist missionaries arrived in 1826. The Free Wesleyan Church of Tonga (the
              Methodist Church in Tonga—Siasi Uesiliana Tau'ataina 'o Tonga) was later
              established in 1924 by Queen Salote Tupou III in order to unite the Free Church
              of Tonga and the Wesleyans.
                  ! Separating from the Wesleyan Church in 1885, the Free Church of Tonga
                      was founded by the first King, George Tupou I.
                          ! Church of Tonga broke away from the Free Church of Tonga in
                              1928.
         o Roman Catholic missionaries (Bishop JP Pompallier and French Marists) were
              granted permission to stay in Tonga in 1842.
         o Latter-Day Saint missionaries originally arrived in Nuku’alofa in 1891 from the
              Samoa Mission and a Tongan Mission was founded in 1916.
         o Seventh Day Adventist missionaries arrived in 1895.
         o Missionaries for the Assemblies of God (AOG) arrived in 1906.

Income

  !   The median income for Pacific Islander families was slightly higher than Oakland as a
      whole at $45,625 (vs. $40,005), but varied within ethnic groups.

                                       Median Family Income in 1999
                    Guamanian or Chamorro          $16,500
                                  Tongan                                    $48,173
                                  Samoan                             $42,311
                          Native Hawaiian               $25,000
                           Pacific Islander                            $45,625
                                  Oakland                          $40,005

                                              $0      $15,000     $30,000     $45,000   $60,000
                                      Source: US Census 2000

  !   Income directly correlates to the groups who have three or more workers in the family;
      the highest median incomes are correlated with high percentages of multiple workers.
      Most striking is that less than 10% of Samoan families have fewer than three workers
      contributing to the family’s income.

                                                             5
Families with Three or More Workers
                       Guamanian or Chamorro (N=68)             5.9%
                                        Tongan (N=217)                      25.3%
                                         Samoan (N=61)                                          90.2%
                                 Native Hawaiian (N=66)         6.1%
                                 Pacific Islander (N=587)                   24.5%
                                     Oakland (N=87,334)             12.2%

                          Source: US Census 2000
                                                         0.0%        25.0%          50.0%     75.0%       100.0%
                          Note: T he sum of the individual categories may not equal the total group since some
                          categories may not be disaggregated from total.

                                           Percentage Below Poverty Level, 1999
              Guamanian or                                                                                 26.9%
            Chamorro (N=390)                     7.9%
            Tongan (N=1,452)                                                                21.8%
                                                                13.0%
             Samoan (N=588)
                                      1.9%
                                  0.0%
             Native Hawaiian                                                         19.5%
                 (N=476)                        7.8%
             Pacific Islanders                                                      19.3%               Poverty
                (N=3,678)                             9.5%
                    Oakland                                                          19.4%              Child Poverty
                 (N=394,473)                                 12.2%
                             0.0%                           10.0%                           20.0%                        30.0%
                    Source: US Census 2000
                    Note: The sum of the individual categories may not equal the total group since some categories may not be
                    disaggregated from total.

   !   Although the percentage of Pacific Islanders living below the poverty level is similar to
       Oakland’s overall population, the overall living conditions are very different (e.g.,
       number of people in families and households, the high percentage of overcrowding, and
       families with multiple sources of income).

Issues at Home

   !   According to a survey of Pacific Islander adults (Taesali 2005):
          o For resources (e.g., emergency cash, translations, advice), half (50.0%) of survey
             respondents (N=82) would seek out family members and the rest would use
             religious avenues (ask God and church) and friends (43.9% and 6.1%,
             respectively).
          o Traditionally, physical discipline is an accepted practice in Pacific Islander
             ancestral homelands. Of the parents interviewed (N=121), almost half (46%)
             agree that physical discipline is useful to foster better behavior from their child.
             Of the parents who agreed (N=56), less than a fifth (17.8%) strongly agreed about
             discipline, whereas the parents who disagreed (N=65), almost two-thirds (64.6%)
             strongly disagreed. When the parents (N=124) were asked how many times they
             had used physical discipline in the past week to improve a child’s behavior,

                                                                    6
                                                                        6
almost half (46%) had never used physical discipline, a third (32.6%) had once or
twice, and almost a quarter (22.6%) had done so three or more times.
o Domestic violence is a largely taboo subject and not one that the adult focus
group was interested in addressing. More than a third (37.6% or 133) of adult
respondents had experienced some verbal, mental, or physical abuse in the home.
Experienced Verbal, Mental, or Physical Abuse
in Home (N=133)
At no time All the time
83 (62%) 4 (3%)
Many times
6 (5%)
Some times
13 (10%)
Few times
27 (20%)
Source: Getting Out of the Box: The UNSEEN Pacific Islanders, Taesali (2005)
! The average number of births has dropped substantially for Samoan and Guamanian girls
between the periods of 1990-1999 and 2000-2006. However, the differences may be due
to mis-categorization since Tongans, the most populous Pacific Islander ethnicity, are
noticeably absent.
Average Number of Births for Pacific Islander Girls (15-19) for
2000-2006 and 1990-1999, by Ethnicity
Other Pacific
Islander* 9.2
4.0
Samoan 1990-1999
2.7
4.8 2000-2006
Guamanian
1.0
8.0
Native Hawaiian
1.3
0.0 2.0 4.0 6.0 8.0 10.0
Average Number of Births
Source: Under the Microscope: Asian and Pacific Islander Youth in
Oakland (2007)
*No information is available for years 1990-1999 for Other Pacific Islanders
7! Pacific Islanders have the lowest rate of early prenatal care for Alameda County (Iton
2006). However, with the small Pacific Islander population numbers and possible mis-
categorization of ethnic group (e.g., due to multiple ethnicities), interpretation of these
results require caution in order to prevent inaccurate conclusions.
Linguistic Isolation
! Less than 10% of Pacific Islander households are linguistically isolated. Linguistic
isolation refers to all household members over 14 years of age having some difficulty
with English (do not solely speak English and speak English with a proficiency of less
than ‘very well’)
Linguistic Isolation by Household
Guamanian or Chamarro (N=121) 0.0%
Tongan (N=217) 8.8%
Samoan (N=61) 9.8%
Native Hawaiian (N=152) 0.0%
Pacific Islander (N=813) 6.6%
Source: US Census 2000 0.0% 5.0% 10.0%
Note: The sum of the individual categories may not equal the total group since some categories may
not be disaggregated from total.
8Educational Attainment for Population 25 years old and older
Guamanian 57.9%
11.9% Post-secondary
or Chamorro
9.4%
N=235 20.9%
High School Diploma
21.0% or Equivalency
Tongan 41.1% Some High School
N=625 27.2%
10.7% Elementary or
8.4% no formal schooling
Samoan 26.4%
N=178 50.6%
14.6%
Native 59.9%
27.6%
Hawaiian
8.1%
N=297 4.4%
40.5%
Pacific Islander 28.7%
n=1,729 19.0%
11.8%
0.0% 10.0% 20.0% 30.0% 40.0% 50.0% 60.0%
Source: US Census 2000
Note: The sum of the individual categories may not equal the total group since some categories may not be disaggregated from
total. Some High School includes 9th grade or higher and Post-secondary includes some college or a degree (Associates,
Bachelors, Masters, PhD).
Education
! More than two-thirds (69.2%) of Pacific Islanders have at least a high school diploma (or
equivalent status). Nearly a quarter (21.0%) of Tongans completed some college-level
coursework or have an advanced degree.
! From a database of Oakland high school students in the 2006-2007 school year, Pacific
Islanders comprised 1.1% of the students (117 of 9,908). That database revealed the
following about Pacific Islander students:
o Students were primarily enrolled at Skyline (21.4%), Oakland Tech (12.0%), and
Castlemont Business and Tech High (11.1%).
o The students were fairly evenly male and female (54.7% and 45.3% respectively)
and spread out throughout 9th and 12th grades (9 – 32.5%, 10 – 21.4%, 11 – 24.8%
12 – 21.4%). Unfortunately, different ethnic groups other than Pacific Islander
were not identified.
o Pacific Islander students had an overall passing grade point average (GPA) of
2.38 which was slightly higher than the overall average of 2.35 Oakland high
school students.
o Although a smaller percentage of PI students took Advanced Placement (AP)
classes than the total student population (10.3% vs. 13.3%), those who did had a
larger average number of AP classes (1.75 vs. 1.33) than other students who took
AP classes.
o California High School Exit Exam (CAHSEE) English Language Art (ELA)
results: 60.3% of Pacific Islander students passed (75.7% of all students passed)
and the average score was 357.62 (vs. 365.03 for all students).
9o California High School Exit Exam (CAHSEE) Math results: 64.6% of Pacific
Islander students passed (73.4% of all students passed) and the average score was
355.34 (vs. 366.66 for all students).
! Enrollment information from the Oakland Unified School District (2007) shows that the
percentage of Pacific Islander youth enrolled has grown steadily since 1993 and
stabilized at around 1.15% of the Oakland student body by 2000.
Percentage of Pacific Islander Students Enrolled in Oakland Unified School District,
1993-2006
1.20%
1.14% 1.16%
1.14% 1.14%
1.13%
1.12%
1.10%
0.99% 1.01%
1.00%
Percentage
0.91%
0.90%
0.86%
0.83%
0.80%
0.78%
0.71%
0.70%
0.60%
0 93-94
1 94-95
2 95-96
3 96-97
4 97-98
5 98-99
6 99-00
7 00-01
8 01-02
9 02-03
10 03-04
11 04-05
12 05-06
13 14
School Year
Source: Oakland Unified School District School & District Data, http://dataportal.ousd.k12.ca.us/
! The percentage of Pacific Islanders who drop out from 7th through 12th grade is not
substantially different from other OUSD students. From the 1991-1992 school year
through the 2005-2006 school year, the drop out percentages rarely varied 10% more or
less than the drop out percentages for all OUSD students according to the California
Department of Education (2007).
o The difference in drop out percentage was never greater than 10% below, but
exceeded 10% in some years for 10th, 11th, or 12th graders.
o The average difference for all 15 years is within one percent (for all grades except
for 12th grade because of one year when five of ten Pacific Islander students
didn’t return to school).
10Difference in Drop Out Percentages between Pacific Islander and all OUSD
students
45
35
25
15
5
-5
-15
05-06 04-05 03-04 02-03 01-02 00-01 99-00 98-99 97-98 96-97 95-96 94-95 93-94 92-93 91-92
7th grade 8th grade 9th grade 10th grade 11th grade 12th grade
Source: http://dq.cde.ca.gov/dataquest/
! California has a goal for all students to score as proficient or advanced on the California
Standards Test. Students in grades 2-11 are tested for English-language arts (ELA), as
well as other subjects such as math, science, social studies, etc. This comparison between
Pacific Islander students and the rest of the OUSD students is only with the ELA tests
since they are administered to all students (whereas other subjects are not). Comparing
achievement levels between grades is not possible, but comparisons within a grade can be
made between years.
o A zero value indicates that there is no difference between the percentages of
Pacific Islander students and all students who had proficient or advanced scores; a
negative value indicates that the percentage of Pacific Islander students was less
than OUSD students who scored at the goal level.
o For most years, the biggest discrepancy in achievement occurs during grades four
through six.
o The most consistently similar scores (and even some instances of the percentage
of Pacific Islander youth being a little higher than OUSD students) occur during
high school.
11Difference between Percentage of all OUSD Students and Pacific
Islander Students Scoring Advanced or Proficient Scores on California
Standards Test (CST) English Language Arts (ELA) Test
5
0
0 0
Difference
-5
-10
-15
-20
-25
2 3 4 5 6 7 8 9 10 11
Grade
2006 2005 2004 2003
Source: California Department of Education, http://www.cde.ca.gov/ta/tg/sr/
! According to the 2002 California Healthy Kids Survey administered to Oakland Unified
School District youth (Lai & Tov 2004):
o Under “school victimization on school property in the last 12 months”: Pacific
Islander youth (N=14) had the smallest percentage for having been in a physical
fight and being harassed due to race, ethnicity, or origin, and second smallest
percentage for having been offered illicit drugs and being harassed in general on
school property.
o Under “perception of safety”: Pacific Islander youth (N=12) had the lowest rating
of sense of safety at school (2.58) and second lowest rating of sense of safety in
neighborhood (3.00) on a 4-point scale where 1=Very Unsafe, 2=Unsafe, 3=Safe,
and 4=Very Safe.
! According to Getting Out of the Box: The UNSEEN Pacific Islanders (Taesali 2005),
which used a focus group with 10 youth:
o Youth feel like their personal options in schools are limited by being perceived
merely as representatives of a group rather than an individual (e.g., all Tongan
students at a school being expelled because of one Tongan youth’s actions).
o Due to the small size of the group, youth also feel that they need to support other
members and assert their cultural pride even if that includes physical violence.
Juvenile Justice
! Pacific Islander youth were responsible in Oakland for just over a half percent (0.6%) of
felony referrals to probation and less than a quarter percent (0.2%) of misdemeanor
referrals in 2006. Although disaggregating by Pacific Islander groups has limited
usefulness since the numbers involved are so small, it still shows some interesting
characteristics.
o Although Tongans are the most populous of Oakland’s Pacific Islander groups,
they do not appear in the Alameda County Probation records: instead Samoan
youth are the most prominently represented in Alameda County Probation data.
Whether Tongans are represented in the Other Pacific Islander category, mis-
categorized as another group, or simply not represented is beyond the scope of
this analysis.
12Pacific Islander Referrals (Misdemeanors and Felonies) by
Ethnicity (N=45)
100%
11.8% 17.4% 18.2% 14.3%
36.4% 30.8%
80%
60%
70.6%
40% 78.3% 81.8% 85.7%
63.6% 69.2%
20%
17.6%
0% 4.3%
2001 2002 2003 2004 2005 2006
Native Hawaiian Samoan Other Pacific Islander
Source: NCCD Analysis of Alameda County Probation Department data
Disproportionate Minority Contact (DMC)
! DMC refers to when the proportion of a minority group involved with the criminal justice
system is either higher or lower than their proportion in the population.
! Pacific Islander youth are twice more likely than White youth to be arrested/booked at
Juvenile Hall in Alameda County in 2006.
Juvenile Arrest per Thousand Population in Alameda County (2006)
Total Arrest Incidents
0 600 1200 1800 2400
116
African-American
2112
13
White
68
140
Samoan
13
Arrest Rate Per 1000
15 Total Arrest Incidents
Pacific Islander
5
0 40 80 120 160
Arrest Rate per 1000
Source: Under the Microscope: Asian and Pacific Islander Youth in Oakland (2007)
13
13! The arrest rate per 1000 for Samoan youth is the highest for all ethnic groups in Oakland.
The arrest rate is determined by dividing the number of arrests by juvenile population
(obtained for the US Census) and multiplied by 1,000.
o Although Tongans are the most populous of Oakland’s Pacific Islander groups,
they do not appear in the Alameda County Probation records. Whether Tongans
are represented in the Other Pacific Islander category, mis-categorized as another
group, or simply not represented is beyond the scope of this analysis.
o In addition, classifying Tongans as Samoans artificially inflates the arrest rate
because the juvenile population of Tongans is larger than Samoans (an equal
number of arrests but a higher population would lead to a smaller arrest rate).
! Pacific Islanders have the third highest average number of days spent in detention for all
youth booked into Alameda County Juvenile Hall. The average number of days is 23.7.
Average Number of Days Youth in Alameda County Spent in
Detention by Race/Ethnicity (2006)
African American 25.7
Other 23.4
Pacific Islander 22.6
Asian 21.6
Hispanic 20.3
White 18.3
American Indian/ Alaskan
17.8
Native
0 10 20 30
Source: Alameda County Probation Department (2006)
14
14References
Alameda County Probation Department (2006). Data provided to National Council on Crime and
Delinquency for analysis.
California Department of Education. Standardized Testing and Reporting (STAR). Viewed
online at http://www.cde.ca.gov/ta/tg/sr/ on February 12, 2007.
California Department of Education. Viewed online at http://dq.cde.ca.gov/dataquest/ on
February 12, 2007.
CIA The World Factbook. Viewed online at https://www.cia.gov/library/publications/the-world-
factbook/index.html on May 16, 2007.
Encyclopædia Britannica Online. Viewed online at http://www.britannica.com/eb/article-54087
on May 16, 2007.
Iton, A (2006). Transforming Public Health Practice to Address Health Inequities:
Communicating with Staff. Viewed at:
http://www.naccho.org/conferences/NACCHOannual06/Transforming
PublicHealthPracticeIton.ppt.ppt on May 16, 2007.
Lai, M, and Tov, W (2004). California Healthy Kids Survey 2002 Analysis
Le, T, Arifuku, I, Krisberg, B, & Tang, E (2001). Not Invisible: Asian Pacific Islander Arrests in
Alameda County
National Council on Crime and Delinquency (2007). Under the Microscope: Asian and Pacific
Islander Youth in Oakland
NoMoa.com. Christianity and the Kingdom of Tonga. Viewed online at
http://www.tongatapu.net.to/tonga/convictions/christianity/default.htm on May 16, 2007.
Oakland Unified School District School & District Data. Viewed online at
http://dataportal.ousd.k12.ca.us/ on February 12, 2007.
Taesali, P A (2005). Getting Out of the Box: The UNSEEN Pacific Islanders
United States Census 2000.
15You can also read