A novel data driven methodology for influenza outbreak detection and prediction
←
→
Page content transcription
If your browser does not render page correctly, please read the page content below
www.nature.com/scientificreports
OPEN A novel data‑driven methodology
for influenza outbreak detection
and prediction
Lin Du1,3 & Yan Pang1,2*
Influenza is an infectious disease that leads to an estimated 5 million cases of severe illness and
650,000 respiratory deaths worldwide each year. The early detection and prediction of influenza
outbreaks are crucial for efficient resource planning to save patient’s lives and healthcare costs. We
propose a new data-driven methodology for influenza outbreak detection and prediction at very local
levels. A doctor’s diagnostic dataset of influenza-like illness from more than 3000 clinics in Malaysia
is used in this study because these diagnostic data are reliable and can be captured promptly. A new
region index (RI) of the influenza outbreak is proposed based on the diagnostic dataset. By analysing
the anomalies in the weekly RI value, potential outbreaks are identified using statistical methods.
An ensemble learning method is developed to predict potential influenza outbreaks. Cross-validation
is conducted to optimize the hyperparameters of the ensemble model. A testing data set is used to
provide an unbiased evaluation of the model. The proposed methodology is shown to be sensitive
and accurate at influenza outbreak prediction, with average of 75% recall, 74% precision, and 83%
accuracy scores across five regions in Malaysia. The results are also validated by Google Flu Trends
data, news reports, and surveillance data released by World Health Organization.
The World Health Organization (WHO) released the top 10 issues that required attention in 2019, of which
infectious diseases dominated the list. Influenza is one of them1. Influenza is a highly contagious respiratory tract
infection that causes diseases ranging from mild respiratory tract infection (RTI) to severe pneumonia and even
death. Worldwide, seasonal influenza leads to an estimated 5 million cases of severe illness and 650,000 respira-
tory deaths every y ear2. It also causes a significant hospitalization burden, workplace absences, and productivity
losses. For example, based on a study conducted at the University of Malaya Medical Centre in Malaysia in 2009,
the direct healthcare cost for each hospitalized H1N1 patient was USD 510, which was 60% higher than the year
2007 per capita national expenditure on health of USD 3183. Given these circumstances, investigators are work-
ing on detecting and predicting influenza outbreaks early. This prediction would bring tremendous value to the
world’s healthcare systems. Firstly, the early detection of influenza outbreaks is crucial to the healthcare system
to enable efficient resource planning and save healthcare costs. Secondly, early detection can potentially help
save people’s lives. Thirdly, we can control the spread of influenza if we can predict it early.
Traditional surveillance is widely used to monitor anomalies in influenza-like illness (ILI) cases in selected
hospitals or clinics. For example, in Malaysia, the Ministry of Health designs and deploys a system to monitor
national influenza status efficiently at a low cost. One to two clinics are selected per state as sentinel sites to
conduct both clinical-based and laboratory-based s urveillance4. However, this traditional surveillance method
used in Malaysia requires weeks or even months to gather, process, report, and finally release the surveillance
data through W HO5–7. In addition, with only fifteen hospitals or clinics m onitored4, the national ILI trend may
not be captured accurately due to the small sample size and low coverage.
In recent years, there have been more research papers on influenza outbreak prediction. Many papers built
prediction models based on historical ILI case data from traditional surveillance or WHO reports. These data
had the limitations such as low geographic coverage and small sample size. Other papers used simulated data
or Google Flu Trends (GFT) data. GFT was launched in 2008 to provide estimated influenza activities using
Google searches8. GFT provided near real-time estimates of seasonal influenza activity each day and stimulated
many innovative research projects.
In 2013, Dugas9 developed a model to forecast influenza cases number based on influenza data from one
medical center. It was shown that the generalized linear autoregressive moving average (GARMA) model with
1
Business Analytics Centre, National University of Singapore, Singapore 119613, Singapore. 2Department of
Analytics and Operations, National University of Singapore, Singapore 119613, Singapore. 3Data Analytics, Zuellig
Pharma Holdings Pte. Ltd., Singapore 228233, Singapore. *email: jamespang@nus.edu.sg
Scientific Reports | (2021) 11:13275 | https://doi.org/10.1038/s41598-021-92484-6 1
Vol.:(0123456789)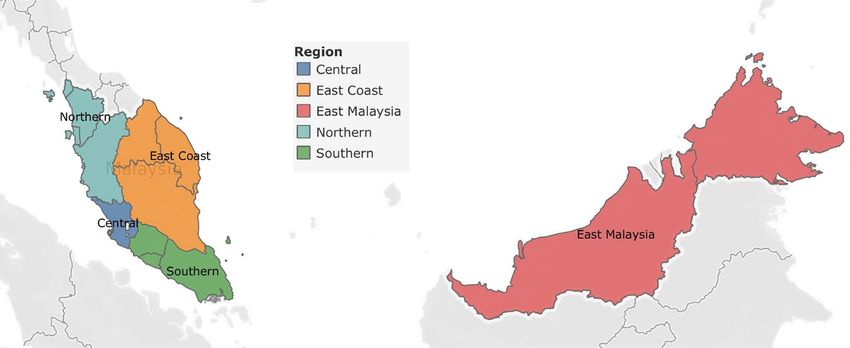
www.nature.com/scientificreports/
ICD10 Diagnosis Selected Reason
J09, J10, J11 Influenza Patients diagnosed with influenza are included in the analysis to ensure specificity.
R50 Fever According to Julia (2017)15, an ILI is defined by the WHO as “An acute respiratory illness with a meas-
ured temperature of > 38 ◦ C and cough, with onset within the past 10 days”, in which fever and cough
R05 Common Cough are the two key diagnoses.
Yang (2015)16 studied the key diagnosis associated with influenza. Fever + cough showed the best sensi-
R06.7 Sneezing tivity and fever + cough + sneezing showed the best specificity at 77%. Therefore, sneezing was selected
to increase specificity.
Charles (2016)17 noted that common cold and influenza normally share similar symptoms . Influenza
J00, J30 Common Cold
patient might have been diagnosed as having the common cold at the beginning of their illness.
Table 1. ICD10 Code and ILI Diagnosis.
Negative Binomial distribution integrating GFT information provided the highest influenza case forecast confi-
dence at 83%. The model aims to provide advanced warning of future influenza cases for medical centers. How-
ever, it was tested on only one medical centre. Hence, its geographic generalizability must be further evaluated.
García10 used Bayesian model selection and Bayesian regression to detect outbreaks of ILI using surveillance
data in 2015. Their method was applied to both Spanish influenza outbreaks in San Francisco, USA, in 1918
and acute respiratory illnesses (ARIs) from San Luis Potosí, Mexico, for validation. The paper claimed to have
accurate and consistent predictions. However, the model performance evaluation was based on observations
and lacked statistical measure reporting.
Bédubourg11 compared different statistical methods for early temporal detection of outbreaks by using R
package surveillance on simulated data generated using a negative binomial model. Among all the models, the
CUSUM generalized linear model (GLM) gave the best recall at 79.5% but had a very low precision value at 9.9%.
Periodic Neg Binomial GLM gave the best precision value at 68.4% but had a very low recall value of 20.7%. All
the tested models struggled to reach a high balanced score for both precision and recall. Therefore, they were
either insensitive, missing out on real outbreaks, or overreacting to give many false alarms.
In 2019, Z hang13 combined GFT together with surveillance data FluNet published by WHO and developed a
multivariate seasonal autoregressive integrated moving average model to track influenza epidemics in Australia,
China, the USA, and the UK . In 2020, D arwish12 investigated the performance of three different feature spaces
in different models to forecast the weekly ILI rate in Syria using Early Warning, Alert and Response System
(EWARS) data from WHO. Both papers showed promising results. However, similar to traditional surveillance
conducted by the government, the published WHO data could be delayed by several weeks or months.
In this paper, we propose a new data-driven methodology to detect and predict influenza outbreaks. A near
real-time diagnostic dataset is used in this study, which covers information from over three thousand clinics in
Malaysia. A new region index (RI) is developed to capture the ILI trend in the regions. By analysing the anomalies
in the weekly RI value, potential outbreaks are identified using statistical methods. An ensemble learning method
is developed to predict potential influenza outbreaks. Cross-validation is conducted to evaluate the prediction
model performance. The proposed methodology is shown to be sensitive and accurate at influenza outbreak
prediction, with around 80% accuracy, 75% recall, and 75% precision scores. It is also validated further with
publicly available information, including the GFT data, news, and WHO FluNet d ata6,7.
Methods
Data. For this study, a dataset was provided by Zuellig Pharma, covering over 3000 clinics’ diagnostic records
in their Malaysia clinic partner network. The dataset consists of approximately two million ILI case records from
4 Jan 2016 to 21 July 2019 with patient diagnostic details, such as the patient ID, diagnosis, prescription drugs,
visiting date, etc. The pre-processing of diagnostic data is required to filter the relevant ILI data, because the
raw dataset contains data from all types of illnesses. In this study, the ILI data were identified by ICD10 codes,
HO14. To sound an early alarm on influenza out-
the international classification of diseases codes used by the W
breaks, both confirmed cases and early symptoms are considered. Table 1 shows the ICD10 codes used to filter
the ILI data from the original diagnostic dataset.
All the diagnostic data are collected automatically and refreshed in real time. The data can be aggregated into
different frequencies, e.g., daily, weekly, or monthly. Similar to past surveillance systems, weekly data are used
in this study. We aggregate the data by clinic and count the number of weekly ILI cases. So that, we can detect
the weekly outbreak status and predict whether the next coming week will bring an outbreak. Our approach
can provide outbreak alerts several weeks earlier than official reports from traditional surveillance methods.
Region Index (RI). As the data is from the clinic partner network, it is common for new clinics to join the
partner network from time to time. Therefore, the number of clinics in the dataset might be different over time.
In addition, the clinics’ size could be varied from tens of patient visits a week to hundreds of patient visits a
week. To study the regional influenza outbreak, we introduce the RI, a metric that normalizes the impact of the
weekly number of clinics and the clinic size. Using the diagnostic data from the clinics, we have the flexibility to
decide on the granularity of the regions by grouping the clinics based on geographic location. In this paper, we
define five regions in Malaysia by following the definition used by the Malaysia Federal Department of Town and
Country (Table 2)18. All clinics are segmented into five regions: the Central, East Coast, East Malaysia, Northern,
and Southern regions (Fig. 1). After segmentation, each of the regions still has good coverage for the number
Scientific Reports | (2021) 11:13275 | https://doi.org/10.1038/s41598-021-92484-6 2
Vol:.(1234567890)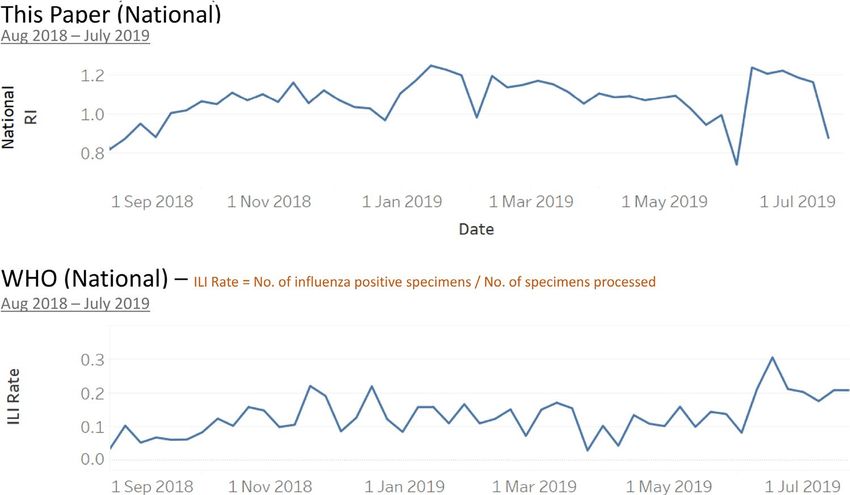
www.nature.com/scientificreports/
Region States Number of clinics Number of ILI cases
Central Selangor 1,442 966,817
East Coast Kelantan, Pahang, Terengganu 204 67,047
East Malaysia Sabah, Sarawak 240 84,661
Northern Kedah, Penang, Perak, Perlis 655 535,452
Southern Johor, Melaka, Negeri Sembilan 506 350,115
Table 2. Definition of the Five Regions in Malaysia18.
Figure 1. Five Regions in Malaysia (generated using Tableau version 2020.3.2) (https://www.tableau.com/suppo
rt/releases/desktop/2020.3.2).
Region Date Region Index
Central Week 4 - 10 Jan 2016 1
Central Week 11 - 17 Jan 2016 1.2
Central ... ...
Central Week 15 - 21 July 2019 1.5
East Coast Week 4 - 10 Jan 2016 1
... ... ...
Southern Week 15 - 21 July 2019 1.6
Table 3. Regional Index (RI) of Diagnostic Data.
of clinics and the number of ILI cases (Table 2). In a paper by S antillana25, the influenza surveillance for ten
regions in the USA was studied and analysed independently. With the same concept, we will study each of the
five regions independently in this paper.
The following data preparation step is to calculate RI for each of the five regions weekly. The mathematical
definition of RI is shown in Equation (1). Table 3 shows an example of the regional RI.
nj,r
Ni,j,r
Rj,r = i=1
nj,r ,j ≥1 (1)
i=1 Si,j,r
where
Rj,r is Region Index (RI) at week j of region r
r ∈ {Central, East Coast, East Malaysia, Northern, Southern} (Table 2)
Ni,j,r is number of ILI cases of clinic i at week j of region r
nj,r is number of clinics at week j of region r
Si,j,r is average size of the clinic i at week j of region r as defined in Equation (2)
J=j−1
J=k Ni,J
Si,j = j−k if j > 1; (k is the week number that clinic i joined the partnership) (2)
Ni,1 if j = 1
Scientific Reports | (2021) 11:13275 | https://doi.org/10.1038/s41598-021-92484-6 3
Vol.:(0123456789)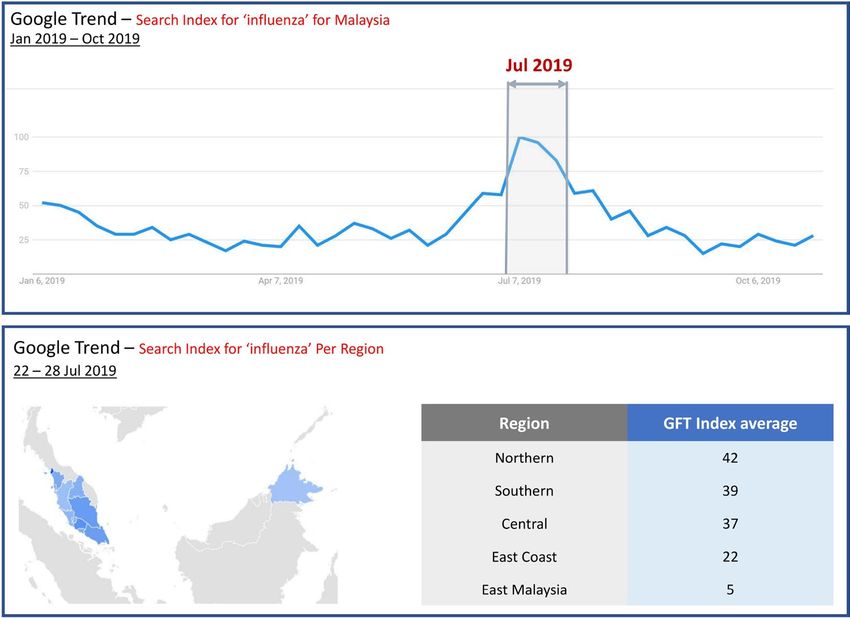
www.nature.com/scientificreports/
Figure 2. Histogram of RIs.
Number of Weeks %
RI Range Central East Coast East Malaysia Northern Southern
RI < 1.05 71% 71% 71% 61% 82%
RI in [1.05, 1.2) 23% 19% 21% 26% 13%
RI ≥ 1.2 6% 10% 8% 14% 5%
Table 4. Weekly RIs statistics Summary.
Figure 3. Example: Apply 70% and 90% threshold to Southern region’s RIs.
In Malaysia, no publicly available dataset contains all the clinics or hospitals. The data we use contain partner
clinics, which may be of different sizes and may have joined the partnership at different times. By averaging the
clinic sizes and normalizing based on this average number, we can avoid biases from missing data.
Influenza outbreaks detection method. The RI had normalized the original ILI cases for each week
and each region. A histogram is plotted below to show the distribution of RI, which is close to a normal distri-
bution (Fig. 2). Next, we will apply anomaly detection models to label the regional outbreak on a weekly basis.
From the past research p apers19–21, the 70th and 90th percentiles are often used on normalized ILI cases to iden-
tify weak and strong indications of influenza outbreaks. Applying these thresholds to the data, RI ≥ 1.05 and
RI ≥ 1.2 give weak and strong indications of influenza outbreaks at the 70th and 90th percentiles, respectively
(Table 4). In the example illustration plot for the southern region, the weeks in the pink range represent strong
indications of influenza outbreaks above the 90th percentile; the weeks in the light pink range represent weak
indications of influenza outbreaks between the 70th and 90th percentiles (Fig. 3).
These thresholds are used to design the anomaly detection models. The majority (70%) of the RIs were below
RI=1.05, representing a normal situation. A RI=1.05 will be used as the minimum requirement for a week to be
Scientific Reports | (2021) 11:13275 | https://doi.org/10.1038/s41598-021-92484-6 4
Vol:.(1234567890)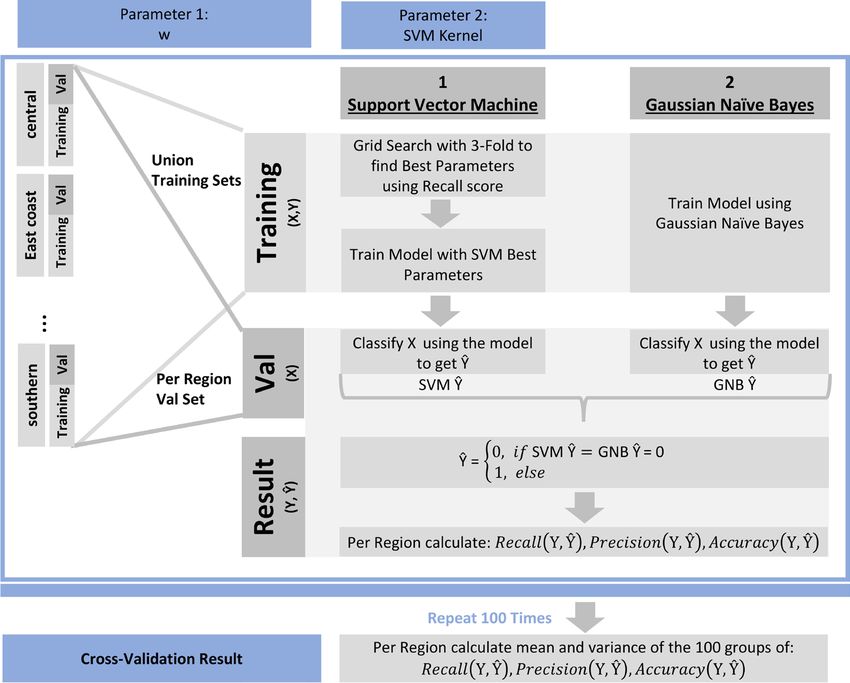
www.nature.com/scientificreports/

Method                          Explanation                                     Model                                        Feature
                                                                                                                             Interpretable and captures all extremely high
                                                                                1) Simple Threshold: RI >= 1.2
                                                                                                                             RIs, i.e. RI over 90th percentile
                                 Statistical models that attempt to identify    2) Z-score Model: RI > 90% Confidence        Captures higher than upper bound points using
 A. Outliers over Upper Bound
                                anomalies with value outside of the norm band   Interval’s upper bound                       the mean and standard deviation
                                                                                                                             Captures higher than upper bound points using
                                                                                3) Tukey’s Model: RI > 90% IQR upper bound
                                                                                                                             quantiles
                                                                                4) Growth Value: RI growth value > median
                                 Statistical models that attempt to identify                                                 Captures abrupt growth in value
 B. Abrupt Growth                                                               (positive weekly growth value)
                                anomalies that have abrupt growth
                                                                                5) Growth Rate: RI growth rate > 10%         Captures abrupt growth in percentage

                                    Table 5.  Five Statistics Models used for Anomaly Detection.

                                    Figure 4.  Outlier lables from five Statistics Models.

                                    labelled as an outbreak. (Equation (10)). A RI=1.2 is applied in one of the anomaly detection models. (Equation
                                    (3)).

                                    Anomaly detection models. We consider influenza outbreaks as anomalies in the weekly RI values. To identify
                                    the anomalies, we use two types of statistical methods, including five statistical models (Table 5). The type A
                                    method is focused on detecting the anomalies over the statistical upper bound of the dataset, and the type B
                                    method identifies the abrupt growth in the time-series data. The type B method complements the type A method
                                    when the base values are low. The details of the anomaly detection models are described below. Here we use Oj,r,i
                                    as the anomaly label at week j in the region r using model i. The southern region is used as an example, in which
                                    labelled weeks are plotted in red triangles for each of the five models (Fig. 4).

                                    • Model 1: Simple Threshold
                                    	  The first model is the simple threshold model. The anomaly label using the simple threshold model is
                                      given in Equation (3). RI=1.2 is selected as the threshold to give a 90% confidence interval (Table 4). This RI
                                      indicates that the labelled weeks have at least 20% more ILI cases than the historical average.

Scientific Reports |    (2021) 11:13275 |                       https://doi.org/10.1038/s41598-021-92484-6                                                                   5

                                                                                                                                                                     Vol.:(0123456789)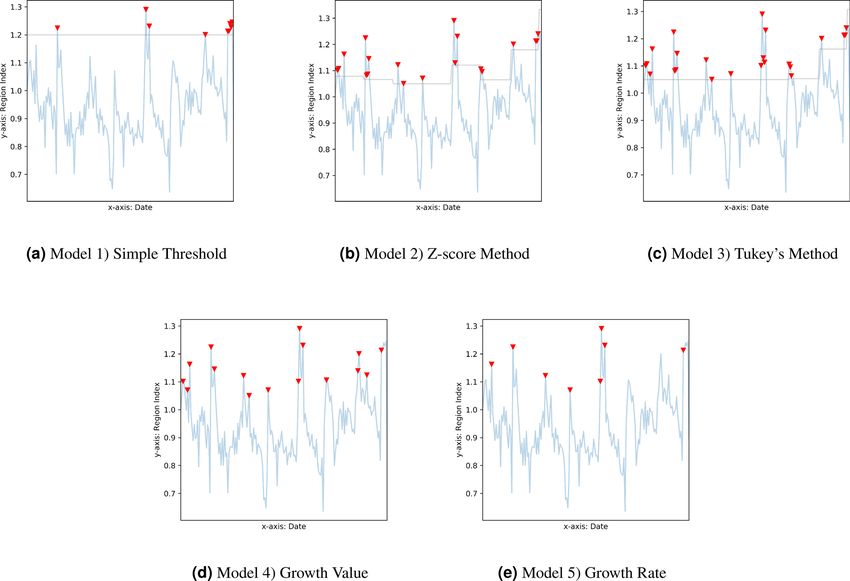
www.nature.com/scientificreports/


                                                                                            1 if Rj,r ≥ 1.2
                                                                             Oj,r,1 =
                                                                                            0 else
                                                                                                            ,j ≥1                                            (3)

                                            • Model 2: Z-score Model
                                            	  In the Z-score model, the anomaly label is given in Equation (4). In each region, the µ and the σ are the
                                              mean and the standard deviation of the RIs every half-year. p=1.3 is used for the 90th percentile (Equation
                                              (5)).

                                                                                       1 if Rj,r ≥ µ + p ∗ σ
                                                                            Oj,r,2 =
                                                                                       0 else
                                                                                                              ,j ≥1                                    (4)

                                                                                        Pr(Oj,r,2 = 1) = 1 − Zscore (p)                                      (5)
                                            where:
                                              µ is the mean of the RIs for each of the half-year (26 weeks) windows
                                              σ is the standard deviation of the RIs for each of the half-year (26 weeks) windows
                                              p is a constant. In this paper p = 1.3 is used to obtain a 90% confidence interval using Equation (5)

                                            • Model 3: Tukey’s Model
                                            	  The anomaly label using Tukey’s model is given in Equation (6). The confidence interval is computed using
                                              the quantiles of the RIs every half-year. Here, we use q=0.4 for the 90% confidence interval (Equation (7)).

                                                                                        1 if Rj,r ≥ Q75 + q × IQR
                                                                            Oj,r,3 =
                                                                                        0 else
                                                                                                                    ,j ≥1                              (6)

                                                                                    normal approximation
                                                                    Pr(Oj,r,3 = 1) −−−−−−−−−−−−→ 1 − Zscore (0.6745 + q ∗ 1.35)                              (7)

                                            where Q75 is the 75th-Percentile of the RIs of the half-year (26 weeks) windows
                                              IQR is the Z-score interquartile range of the RIs of the half-year (26 weeks) windows
                                              q is a constant. In this paper q = 0.4 is used to obatain a 90% confidence interval using Equation (7)

                                            • Model 4: Growth Value
                                            	  The fourth model uses the RI growth value as a measurement to identify the abruptly growing RIs. The
                                              anomaly label using the growth value is given in Equation (8). This values indicates that the labelled weeks
                                              have RI growth values exceeding the median of the positive growth values.

                                                                       1 if Rj,r − Rj−1,r ≥ median(RJ,r − RJ−1,r ) where RJ,r > RJ−1,r
                                                            Oj,r,4 =
                                                                       0 else                                                                          (8)

                                            • Model 5: Growth Rate
                                            	  The fifth model uses the RI growth rate as a measurement to identify abruptly growing RIs. The anomaly
                                              label using the growth rate is given in Equation (9). This rate indicates that the labelled weeks have an RI
                                              growth rate exceeding 10%.

                                                                                               R −R
                                                                                          1 if j,rRj−1,rj−1,r ≥ 10%
                                                                               Oj,r,5 =                             ,j >1                              (9)
                                                                                          0 else

                                            Outbreak labelling. The weekly outbreak labelling in each region is performed in two steps, as given by Equa-
                                            tion (10) and (11) respectively. An illustration of this labelling process is shown in Fig. 5.
                                               In the first step (Equation (10)), as long as one of the five anomaly detection models detects the anomaly, the
                                            week will be labelled as an outbreak. Because the five models complemented each other in anomaly detection,
                                            they increased the sensitivity of the influenza outbreak detection. Note that an Rj,r greater than 1.05 from the
                                            70th percentile is imposed, so that the weeks labelled as outbreaks were at least 5% more frequent in ILI cases
                                            than the historical average to avoid over-labelling.
                                               In the second step (Equation (11)), a two-week outbreak window is proposed in this paper. This is because the
                                            development of an infectious disease outbreak takes some time. Based on our study of the historical diagnostic
                                            dataset, for any region r that starts to show a strong indication of an outbreak in weeks j − 1, the next week j will
                                            be considered as a continuity of the previous outbreak. In accordance with the empirical observation, this paper
                                            defines the start of an influenza outbreak as a two-week period.

                                                                                      1 if Rj,r ≥ 1.05 and m=5

                                                                            Ij,r =                           m=1 Oj,r,m ≥ 1 , j ≥ 1                         (10)
                                                                                      0 else

          Scientific Reports |   (2021) 11:13275 |               https://doi.org/10.1038/s41598-021-92484-6                                                    6

Vol:.(1234567890)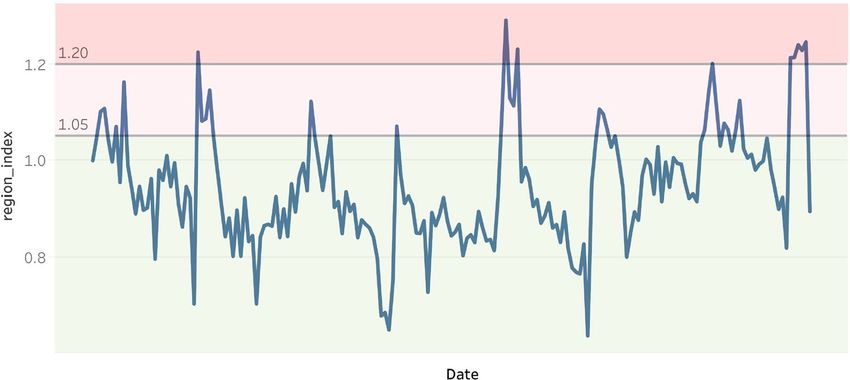
www.nature.com/scientificreports/
Figure 5. Influenza outbreak detection for historical data illustration.
Region (r) Date (j) RI ( Rj,r) Influenza outbreaks ( Ij,r)
Central Week 4 - 10 Jan 2016 1 0
Central Week 11 - 17 Jan 2016 1.2 1
Central ... ... ...
Central Week 15 - 21 July 2019 1.5 1
East Coast Week 4 - 10 Jan 2016 1 0
... ... ... ...
Southern Week 15 - 21 July 2019 1.6 1
Table 6. Diagnostic data with labelled influenza outbreaks.
Date Week (j) W1 W2 W3 ... Wn−1 Wn
RI ( Rj,r) R1 R2 R3 ... Rn−1 Rn
Outbreak Indicator ( Ij,r) I1 I2 I3 ... In−1 In
Table 7. Reformat of Table 6 for Each Region r.
where:
Ij,r is the influenza outbreak indicator at week j of Region r,
1 means outbreak, and 0 means non-outbreak
1 if Ij−1,r = 1
Ij,r =
Ij,r else (11)
Influenza outbreaks prediction method. With the labelled influenza outbreak data (Table 6), we
develop an ensemble learning method26 to predict future outbreaks.
Feature generation—Focus on prior outbreak pattern. In supervised learning, feature X in response Y relation-
ship must be constructed to train the model using historical data. Then, given a new X, the model can predict the
corresponding Y. In this paper, response Y is the outbreak indicator of the next week. Feature X is constructed
as the RI patterns of w weeks prior. Here, w is a parameter. This feature-response construction allows the model
to address patterns before an outbreak.
Assuming there are n weeks of historical data available, Table 6 can be reformatted into Table 7 for each region
r. The feature set X to respond to Y construction is shown in Equation (12) for historical data. In each region r,
X takes the past w weeks’ RI, and Y is the influenza outbreak indicator. The same construction works to predict
Scientific Reports | (2021) 11:13275 | https://doi.org/10.1038/s41598-021-92484-6 7
Vol.:(0123456789)
www.nature.com/scientificreports/
future outbreaks, as shown in Equation (13). Given the known Xn−w+1, i.e., the most recent w weeks’ RI from the
historical data, the classification model predicts unknown Yn−w+1, i.e., the outbreak indicator of the next week.
Note that the (X, Y) pairs are mutually independent. It has been assumed that the outbreak indicator of week
j only depends on the RI pattern of the week j-w to week j-1. In other words, it is the week j-w to week j-1’s RI
pattern that decides whether week j is an outbreak. That is why parameter w must be selected with care. We will
discuss the use of cross-validation to select the optimal value for parameter w.
(Xu , Yu ) = ((Ru , Ru+1 , ..., Rw+u−1 ), (Iw+u )) for 1 ≤ u ≤ n − w (12)
where:
Xu is the feature constructed at week w + u, which is composed of RIs from w weeks prior
Yu is the response at week w + u, which is the outbreak indicator
(Xn−w+1 , Yn−w+1 ) = ((Rn−w+1 , Rn−w+2 , ..., Rn ), (In+1 )) (13)
Model design. Response Y, the outbreak indicator, is a 1/0 binary variable, where 1 represents outbreaks and 0
represents non-outbreaks. This paper uses an ensemble learning method with a support vector machine (SVM)
and Gaussian naive Bayes (GNB) and a simple OR function as the c ombiner26. The pseudocode of the ensemble
learning method is shown in Algorithm 1.
SVM is selected because it fits perfectly into the paper’s problem setup. As it is widely known, SVM can be
used in supervised learning, which plots each example X as points in space. Its aim is to find a hyperplane to
separate the points by category Y as widely as possible. With the hyperplane, new example X entering the space
will fall to one side of the hyperplane, therefore being predicted to belong to a category Y. The same concept is
then applied to the data structure defined in section ”Feature Generation - Focus on Prior Outbreak Pattern”.
For features constructed using historical data as described in Equation (12), each example X is a point in space.
SVM aims to find a hyperplane to separate Y=1 outbreaks from Y=0 non-outbreaks as widely as possible. With
the hyperplane, the Equation (13) new X (X is the last W weeks RI) entering the space will be categorized to be
either Y=1 or Y=0 (Y is the prediction for next week’s outbreak indicator).
SVM might fail to separate outbreak cases from non-outbreak cases if the pattern for Y is not so distinct. If
relying purely on SVM, it might lead to false negative predictions that the model may fail to capture all outbreaks
correctly. In this paper, we select one more classification model to complement the SVM model, GNB. GNB
can be applied because we have shown that the RI value follows a Gaussian distribution (Figure 2). It uses Bayes
theorem for prediction using conditional probability function and is able to capture outbreaks that SVM might
miss out from a different angle.
Model training and parameter tuning. To build a robust prediction model and provide an unbiased perfor-
mance evaluation of the final model, we divide the whole data set into training, validation, and test data sets. 15%
of the data are set aside as a test dataset. The remaining 85% of the data are used in a cross-validation process,
which is further split into training (70%) and validation (30%) data. Details about the cross-validation process
using repeated random sub-sampling27 are described in Algorithm 2 (Fig. 6) to optimize the hyperparameter w
and SVM kernel.
Scientific Reports | (2021) 11:13275 | https://doi.org/10.1038/s41598-021-92484-6 8
Vol:.(1234567890)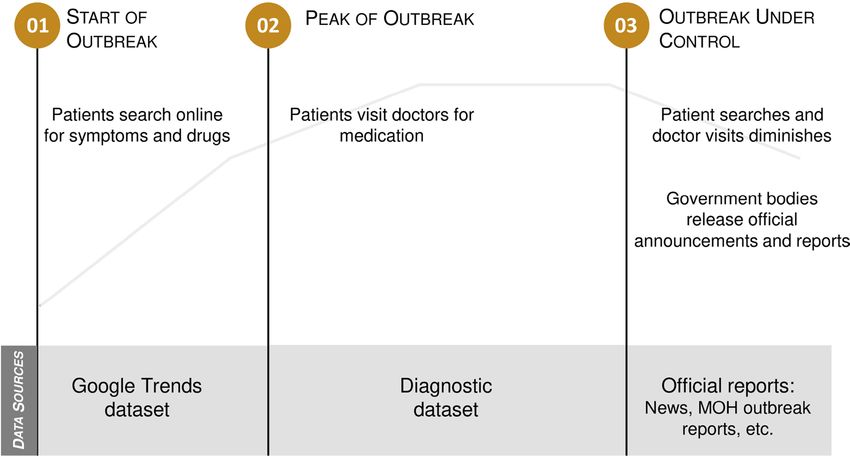
www.nature.com/scientificreports/

                                  Figure 6.  Cross-validation architecture.

Scientific Reports |   (2021) 11:13275 |              https://doi.org/10.1038/s41598-021-92484-6        9

                                                                                                   Vol.:(0123456789)
www.nature.com/scientificreports/
Parameters Recall score: means (standard deviation)
Kernel w Central East Coast East Malaysia Northern Southern
poly 2 0.56 (0.12) 0.68 (0.10) 0.68 (0.11) 0.69 (0.10) 0.60 (0.16)
poly 3 0.58 (0.13) 0.75 (0.10) 0.73 (0.10) 0.69 (0.01) 0.71 (0.13)
poly 4 0.58 (0.11) 0.75 (0.11) 0.72 (0.11) 0.67 (0.10) 0.65 (0.13)
poly 5 0.58 (0.13) 0.76 (0.12) 0.68 (0.13) 0.61 (0.09) 0.60 (0.16)
poly 6 0.60 (0.13) 0.71 (0.10) 0.77 (0.12) 0.64 (0.09) 0.63 (0.14)
rbf 2 0.67 (0.11) 0.74 (0.09) 0.71 (0.11) 0.75 (0.08) 0.66 (0.15)
rbf 3 0.65 (0.14) 0.74 (0.10) 0.75 (0.11) 0.74 (0.11) 0.71 (0.14)
rbf 4 0.67 (0.12) 0.75 (0.10) 0.72 (0.11) 0.74 (0.10) 0.68 (0.13)
rbf 5 0.67 (0.12) 0.82 (0.11) 0.74 (0.12) 0.70 (0.10) 0.62 (0.16)
rbf 6 0.66 (0.11) 0.77 (0.10) 0.77 (0.12) 0.69 (0.10) 0.64 (0.14)
Table 8. Cross-validation result of recall score.
Central East Coast East Malaysia Northern Southern
Recall 0.65 (0.14) 0.74 (0.10) 0.75 (0.11) 0.74 (0.11) 0.71 (0.14)
Precision 0.74 (0.10) 0.63 (0.11) 0.72 (0.12) 0.72 (0.10) 0.73 (0.12)
Accuracy 0.81 (0.04) 0.80 (0.05) 0.83 (0.05) 0.78 (0.06) 0.89 (0.04)
Table 9. Detailed Cross-Validation results with optimal parameter: Kernel = rbf, w=3.
Three evaluation metrics are selected to be reported for model performance evaluation in this paper.
1. Recall score as the primary metrics aiming to find all real outbreaks
The recall score measures how sensitive the model is at reporting actual outbreaks, i.e., how many real
outbreaks are being predicted correctly by the model. The primary purpose of the project is to detect potential
outbreaks early and not miss any actual outbreaks. The historical data are imbalanced in the outbreak indi-
cator labelling, and there are many more 0s (non-outbreak weeks) than 1s (outbreak weeks). Therefore, the
recall score is the optimal option for evaluating the sensitivity of the model in identifying real outbreaks. The
recall score is used in the cross-validation process for parameter tuning and to increase the model sensitivity.
2. Precision score to ensure predicted outbreaks are real outbreaks
The precision score measures the precision of the model in reporting outbreaks, i.e., for all the weeks pre-
dicted as an outbreak by the model, how many are real outbreaks. The precision score is reported together
with the recall score during cross-validation to avoid over-labelling of the outbreaks. It is also reported as
the confidence level of the prediction result, indicating the probability of the predicted outbreak being a real
outbreak.
3. Accuracy score for reference
Accuracy is the most intuitive performance measure. Due to the nature of imbalanced data, the accuracy
is quite high in general. Therefore, it is reported just for reference.
We use Algorithm 2 to select the best hyperparameters for the prediction model. The cross-validation result of
the recall score is shown in Table 8. SVM kernel = rbf and w = 3 are selected as the best parameters, because
they provide high, balanced, and stable recall scores across all five regions. Table 9 reports the precision and
accuracy scores on top of the recall scores for the selected best hyperparameters. For all the regions, there are
high recall and precision scores and low standard deviations. Once we obtain the optimal hyperparameter set, we
use the test data set to measure the final model performance, which is further elaborated in the results section.
Ethical use of data. The authors confirm that all methods were carried out in accordance with relevant
guidelines and regulations. All the experimental protocols were approved by Zuellig Pharma Holdings Pte Ltd
and National University of Singapore. Written informed consent was obtained from all subjects by the approv-
ing ethics committee. The consent of use of the data for this study by the authors has been provided by Zuellig
Pharma Holdings Pte Ltd.
Results
We compared the model outbreak detection and prediction results with both the WHO and the GFT data.
Currently, Malaysia Ministry of Health (MOH) reports ILI cases to WHO based on the traditional surveillance
method4. A total of 15 clinics or hospitals in the whole country monitor and report ILI cases to WHO every two
weeks or longer. The WHO published weekly influenza data including the total number of specimens processed
Scientific Reports | (2021) 11:13275 | https://doi.org/10.1038/s41598-021-92484-6 10
Vol:.(1234567890)www.nature.com/scientificreports/
Figure 7. National level RI vs. WHO weekly influenza rate in the past 1 year.
and the total number of confirmed influenza cases on FluNet7. In this study, we used WHO data to validate the
high-level ILI trend at the national level.
Although the WHO data is able to show some useful national ILI trends, it is very approximate due to the
small sample size. In addition, the WHO data cannot support the detailed weekly analysis at the regional level.
Therefore, we compared the regional detection and prediction results with the GFT data. As an example of col-
lective intelligence, GFT has attracted a lot of attention in the past 10 years28,29. On the one hand, GFT unlocked
the power of big data in the public health area. It is able to understand the prevalence of influenza at very local
levels with more finely granular data from search engines, which is not practical for the traditional surveillance
systems to widely produce. In addition, GFT can provide influenza alerts much earlier than the traditional
surveillance systems. On the other hand, GFT was challenged by some researchers because its predictions have
sometimes been inaccurate. This is because that people making influenza-related Google searches may know
very little about how to diagnose influenza. Therefore, searches for influenza or influenza symptoms may well
be researching disease symptoms that are similar to influenza but are not influenza.
The GFT data are selected in this study for comparison for the following reasons. Firstly, GFT is one of the
best public data sources for providing near real-time influenza information at very local levels. GFT can specify
search terms and geographic granularity to align with our model at the regional level. We can use ILI-relevant
search terms and choose the cities in the same region from GFT to provide the closest comparison with our
model results. Secondly, despite its limitations, GFT is still able to provide useful influenza alert information in
many cases based on previous r esearch8,28,29. Thirdly, the potential problem of GFT can be identified and rectified
as we also use the WHO data to validate the national-level results in this study.
Result of the Influenza outbreaks detection method. We extracted Malaysia’s influenza data from
WHO FluNet w ebsite7 and computed the influenza rate as the percentage of influenza cases found in all the pro-
cessed specimens. We calculated the aggregated RI at the national level and compared it with WHO influenza
rate data trend. Overall, these national-wide data are aligned and show a similar trend (Fig. 7).
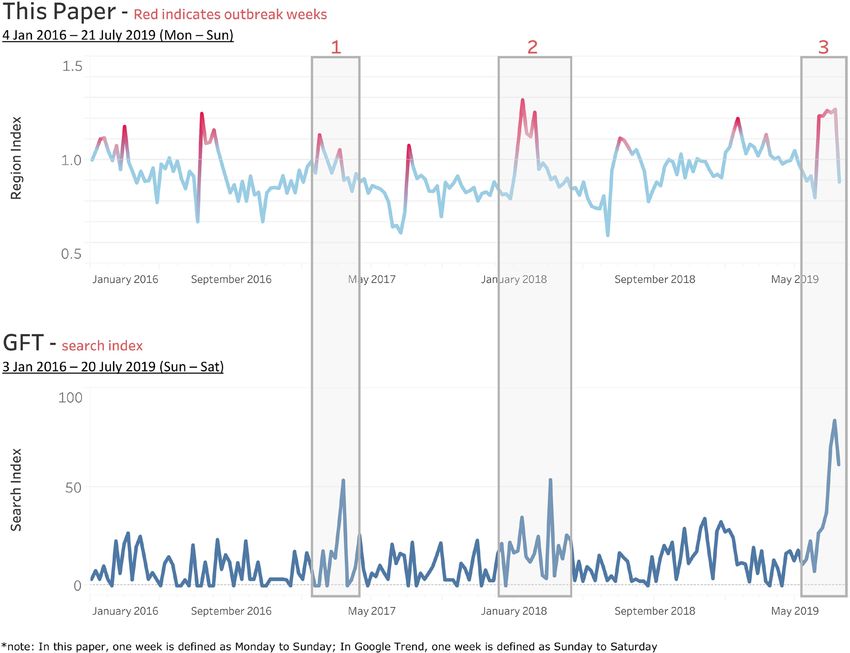
To validate the influenza detection results at the regional levels, GFT data are used. Figure 8 shows an example
of the comparison in the southern region. As defined in Table 2, the region is composed of three states: Johor,
Melaka, and Negeri Sembilan. The upper graph shows the influenza outbreaks in the southern region as labelled
using the approach proposed in this paper (red color indicates outbreaks). The lower graph shows the GFT search
index of ILI-relevant terms for the same region. From this comparison, the GFT shows outbreak periods similar
to those of our model. However, as we used real ILI case data from more than three thousand clinics while GFT
relied on the search results from the general public, our method was able to detect the outbreaks more obviously
in most cases while GFT patterns were not so clear in some cases.
In Fig. 8, we highlighted three local outbreaks in the southern region, in which GFT also shows distinct
spikes in the search index. To further validate the outbreak detection results, we also collected published news
reports. In week 27 of 2019 (from 30 June to 6 July), the Selangor Journal reported that ILI cases soared in Negri
Sembilan22, which is a state in the southern region. The finding is aligned with the model detection result, as
specified in Fig. 8 outbreak period 3. In addition, we compared the time at which our paper gives the signal with
that of the GFT for the 3 highlighted outbreaks, as summarized in Table 10. From the comparison, our method
could detect the same outbreak during the same week or earlier than the GFT.
Scientific Reports | (2021) 11:13275 | https://doi.org/10.1038/s41598-021-92484-6 11
Vol.:(0123456789)www.nature.com/scientificreports/
Figure 8. Outbreak detection result vs GFT for the southern region.
Outbreak ID Our Paper GFT Conclusion
1 Week 30 Jan 2017 Week 12 March 2017 Our paper detects outbreaks earlier than the GFT
2 Week 15 Jan 2018 Week 14 Jan 2018 Our paper detects outbreaks at the same week as the GFT
3 Week 10 Jun 2019 Week 7 July 2019 Our paper detects outbreaks earlier than the GFT
Table 10. First spike date comparison of this paper’s outbreak detection vs. the GFT for the southern region in
sample periods.
Central East Coast East Malaysia Northern Southern
Recall 0.78 0.86 0.80 0.67 0.63
Precision 0.88 0.60 0.89 0.60 0.71
Accuracy 0.90 0.83 0.90 0.67 0.83
Table 11. Testing Data Set Results with Optimal Parameter: Kernel = rbf, w=3.
Result of the Influenza outbreaks prediction method. To provide an unbiased evaluation of the
prediction model, we use a testing data set to measure the performance of the model trained early on. The test-
ing data set includes 15% of the total data, which are not used in the model training and validation stage. Model
performance results (Table 11) are summarized below.
Scientific Reports | (2021) 11:13275 | https://doi.org/10.1038/s41598-021-92484-6 12
Vol:.(1234567890)www.nature.com/scientificreports/
Central East Coast East Malaysia Northern Southern
Predicted 1 1 0 1 1
Table 12. Predicted Influenza Outbreaks for Next Week 22 to 28 Jul 2019 with Optimal Parameter: Kernel =
rbf, w=3 1 represents outbreak, and 0 represents non-outbreak.
Figure 9. WHO weekly influenza rate in 2019.
• The model is proven to be reliable and stable, with average of 75% recall, 74% precision and 83% accuracy
scores across the five regions. (Table 11).
• The model is sensitive to capturing the real outbreaks, that around 75% of the real outbreaks can be correctly
predicted by the model across the five regions (Table 11. Recall).
To further validate the prediction model performance, we predict whether the next week, i.e., week 22 to 28
Jul 2019, would be an outbreak for each of the five regions by using the historical data from 4 Jan 2016 to 21 Jul
2019. The model predicts that East Malaysia would not have an influenza outbreak in the next week, and all the
rest of the regions will have an influenza outbreak then (Table 12). To be specific, there is around 88% of prob-
ability central will have an outbreak; 60% of probability east coast will have an outbreak; 89% of probability east
Malaysia will have an outbreak; 60% of probability northern will be an outbreak; and 71% of probability southern
region will have an outbreak (Table 11).
We also compared the new prediction result with WHO FluMart data in the national level (Fig. 9). It shows
that there is a spike around week 30 (22 to 28 Jul 2019), which is consistent with our prediction.
From the GFT data (Fig. 10), we can see that there is also a distinct spike in searches for ’Influenza’ for
Malaysia overall in the week of 22 to 28 Jul 2019. This is consistent with the prediction result from our model
(Table 12). More specifically at the region level:
• Northern, southern, central and east coast regions have the top GFT Indexes indicating high influenza
searches, which is consistent with the model result that these regions will have an outbreak (Table 12).
• East Malaysia has the lowest GFT index with the least likelihood of an outbreak, which is consistent with the
model result showing 0, no outbreak (Table 12).
Discussion
This paper proposes a data-driven methodology using a diagnostic dataset from over 3000 clinics in Malaysia
to detect and predict influenza outbreaks at very local levels effectively. The main objective of this study is to
provide a good supplement to traditional influenza surveillance systems instead of a replacement. We believe
that when our method is deployed in conjunction with traditional surveillance systems and GFT, it will provide
better influenza detection and prediction outcomes.
During a typical outbreak life-cycle as plotted in Fig. 11, there are three types of datasets that can be used for
the influenza outbreak study: Google Trends dataset, diagnostic datasets, and official reports. Diagnostic data
stand out for the following reasons. First, they are used to monitor ILI cases based on licensed doctor diagnoses,
Scientific Reports | (2021) 11:13275 | https://doi.org/10.1038/s41598-021-92484-6 13
Vol.:(0123456789)www.nature.com/scientificreports/
Figure 10. Google Flu Trend Result (week 22 – 28 Jul 2019) (Map screenshot from GFT w
ebsite23).
Figure 11. A typical outbreak lifecycle.
which are usually more reliable than Google Trends search-based data. Second, diagnostic data provide earlier
detection insights into influenza outbreaks compared to the official reports. Andrea validated that diagnostic data
from one medical center work well for the influenza case forecasting9. In this study, we used diagnostic data from
over three thousand clinics, covering half of the clinics in M alaysia24. We can extend Andrea’s work to address
geographic generalizability. In addition, as this dataset is directly extracted from a real-world healthcare system,
our methodology can be easily integrated with this system and deployed for daily operations.
A new measurement metric of influenza outbreaks, i.e., the RI, is proposed in this paper. The RI compares the
number of ILI cases during the current week with the historical weekly average in the region. Unlike previous
papers13,19,21, which simply use the total number of cases from all hospitals or clinics, the RI uses the average size
of individual clinics and handles cases when new clinics are added into or removed from the dataset during the
sample period. In statistical terms, the RI eliminates the biases of different clinic sizes and a varying number of
clinics. It gives a good indication of whether the current week shows an anomaly in the ILI cases in the region.
We designed an influenza outbreak detection method based on RI using statistical outlier detection models
and validated the method with GFT results. In real-world scenarios, the sensitivity of the outbreak detection
Scientific Reports | (2021) 11:13275 | https://doi.org/10.1038/s41598-021-92484-6 14
Vol:.(1234567890)www.nature.com/scientificreports/
model is crucial because we try to detect as many outbreaks as possible. To improve the sensitivity of outbreak
detection methods, we introduce five complementary statistical models in this paper. These models are used to
label the weekly regional outbreaks to train the prediction model.
This paper emphasizes the study of RI patterns before an outbreak and develops a machine learning model to
predict future outbreaks. There are usually two types of methodologies when detecting outbreaks, i.e., regression
models and classification models. Regression models focus on seasonal or periodical outbreaks and fit long-term
predictions better. By contrast, classification models capture dynamic patterns and fit short-term predictions
better. In this paper, we decided to use classification models because Malaysia, which is located in Southeast
Asia, does not have distinctive seasons; therefore, there are no clear seasonal trends in ILI c ases4. Moreover, we
can give early alerts using classification models by learning the patterns right before the outbreaks.
The methodology has consistent performances, with average of 75% recall, 74% precision, and 80% accuracy
scores on the testing set across five regions in Malaysia. Therefore we conclude that the methodology is sensitive
and accurate in predicting influenza outbreaks at very local levels. Compared to previous similar research works,
the proposed methodology is more reliable, effective, and scalable to influenza outbreak detection and prediction.
In the future, the proposed methodology introduced in this paper can be easily adapted to other diseases
covered by diagnostic data, such as hand foot mouth disease, dengue fever, and COVID-19, etc. Moreover,
the methodology, as currently predicting at the regional level, can be extended easily to the city level, or any
granularity by grouping clinics based on geographic location. In addition to the short-term prediction results
presented in this paper, the methodology can be extended for long-term outbreak prediction by restructuring
the data and incorporating other machine learning models. In addition, we can apply more complex nonlinear
models such as LSTM or other neural networks to the data set to explore if they have better prediction accuracy.
Received: 14 November 2020; Accepted: 8 June 2021
References
1. World Health Organization. Ten Health Issues WHO Will Tackle This Year, https://www.who.int/news-room/feature-stories/ten-
threats-to-global-health-in-2019 (2019).
2. World Health Organization. Influenza (Seasonal), https://www.who.int/en/news-room/fact-sheets/detail/influenza-(seasonal)
(2018).
3. Ong, M. P. et al. High direct healthcare costs of patients hospitalised with pandemic (H1N1) 2009 influenza in Malaysia. J. Infect.
61, 440–2 (2010).
4. Sengol Selvanesan, Norizah Ismail, Yusof Mohd Apandi, Thayan R. MALAYSIA INFLUENZA SURVEILLANCE PROTOCOL.
https://www.researchgate.net/publication/329023936_MALAYSIA_INFLUENZA_SURVEILLANCE_PROTOCOL (2018).
5. World Health Organization. Influenza update, https://www.who.int/influenza/surveillance_monitoring/updates/latest_update_
GIP_surveillance/en (2020).
6. World Health Organization. FluNet Summary, https://w ww.w
ho.i nt/i nflue nza/g isrs_l abora tory/u
pdate s/s ummar yrepo rt/e n/ (2020).
7. WHO FluMart platform, https://apps.who.int/flumart/Default?ReportNo=12
8. Ginsberg, J. et al. Detecting influenza epidemics using search engine query data. Nature 457, 1012–1014. https://doi.org/10.1038/
nature07634 (2009).
9. Andrea, Dugas et al. Influenza Forecasting with Google Flu Trends. PLoS ONE 8(2), e56176. https://doi.org/10.1371/journal.pone.
0056176 (2013).
10. García, Y. E., Christen, J. A. & Capistrán, M. A. A bayesian outbreak detection method for influenza-like illness. BioMed Res.
Int.https://doi.org/10.1155/2015/751738 (2015).
11. Bédubourg, G. & Le Strat, Y. Evaluation and comparison of statistical methods for early temporal detection of outbreaks: A
simulation-based study. PLoS ONE 12(7), e0181227. https://doi.org/10.1371/journal.pone.0181227 (2017).
12. Darwish, A., Rahhal, Y. & Jafar, A. A comparative study on predicting influenza outbreaks using different feature spaces: applica-
tion of influenza-like illness data from Early Warning Alert and Response System in Syria. BMC Res. Noteshttps://d oi.o
rg/10.1 186/
s13104-020-4889-5 (2020).
13. Zhang, Y. et al. Predicting seasonal influenza epidemics using cross-hemisphere influenza surveillance data and local internet
query data. Sci. Rep. 9, 3262. https://doi.org/10.1038/s41598-019-39871-2 (2019).
14. World Health Organization. ICD10 code for Diagnosis, https://icd.who.int/browse10/2016/en (2016).
15. Fitzner, J. et al. Revision of clinical case definitions: influenza-like illness and severe acute respiratory infection. Bull. World Health
Organ. 96(2), 122–128. https://doi.org/10.2471/BLT.17.194514 (2018).
16. Yang, J. H. et al. Predictive Symptoms and Signs of Laboratory-confirmed Influenza: A Prospective Surveillance Study of Two
Metropolitan Areas in Taiwan. Medicine 94(44), e1952. https://doi.org/10.1097/MD.0000000000001952 (2015).
17. Charles Patrick Davis, Cold vs. Flu, https://www.medicinenet.com/cold_vs_flu/article.htm#cold_vs_flu_facts (2016).
18. MLIT, An Overview of Spatial Policy in Asian and European Countries - Malaysia. https://www.mlit.go.jp/kokudokeikaku/inter
national/spw/general/malaysia/index_e.html (2015).
19. Pung, R. & Lee, V. J. M. Implementing the World Health Organization Pandemic Influenza Severity Assessment framework–Sin-
gapore’s experience. Influenza Other Respirat. Viruses 14, 3–10. https://doi.org/10.1111/irv.12680 (2020).
20. ElGawad, B. A. et al. Evaluating tools to define influenza baseline and threshold values using surveillance data, Egypt, season
2016/17. J. Infect. Public Health 13(3), 430–437. https://doi.org/10.1016/j.jiph.2019.05.005 (2020).
21. Guo, P. et al. Monitoring seasonal influenza epidemics by using internet search data with an ensemble penalized regression model.
Sci. Rep. 7, 46469. https://doi.org/10.1038/srep46469 (2017).
22. 15 Clusters of ILI Detected in N. Sembilan as of 6 July. Selangor J.. https://selangorjournal.my/2019/07/15-clusters-of-ili-detec
ted-in-n-sembilan-as-of-6-july/ (2019).
23. Google Trend data – search term ‘influenza’. https://trends.google.com/trends/explore?q=influenza
24. Makmor, T., Khaled, T., Ahmad Farid, O. & Nurul Huda, M. S. Demographic and socioeconomic factors associated with access
to public clinics. J. Health Transl. Med. 21(1), 28–33 (2018).
25. Santillana, M. et al. Cloud-based Electronic Health Records for Real-time. Region-specific Influenza Surveillance. Sci. Rep. 6,
25732. https://doi.org/10.1038/srep25732 (2016).
26. Kuncheva LI. Classifier ensembles for changing environments. In International Workshop on Multiple Classifier Systems, LNCS
3007. Springer, (2004).
27. Picard, R. & Cook, R. Cross-validation of regression models. J. Am. Stat. Assoc. 79(387), 575–583. https://doi.org/10.2307/22884
03 (1984).
Scientific Reports | (2021) 11:13275 | https://doi.org/10.1038/s41598-021-92484-6 15
Vol.:(0123456789)www.nature.com/scientificreports/
28. Kandula, S. & Shaman, J. Reappraising the utility of Google Flu Trends. PLoS Comput. Biol. 15(8), e1007258. https://doi.org/10.
1371/journal.pcbi.1007258 (2019).
29. Olson, D. R., Konty, K. J., Paladini, M., Viboud, C. & Simonsen, L. Reassessing Google Flu Trends Data for Detection of Seasonal
and Pandemic Influenza: A Comparative Epidemiological Study at Three Geographic Scales. PLoS Comput. Biol. 9(10), e1003256.
https://doi.org/10.1371/journal.pcbi.1003256 (2013).
Acknowledgements
We thank Zuellig Pharma Holdings Pte Ltd for providing the diagnostic data for this research work. We thank
Tristan Tan, Vice President of Zuellig Pharma analytics team for supporting this study.
Author contributions
L.D. and P.Y. conceived and designed the study. L.D. prepared the data and built the models. Both authors vali-
dated the models, wrote the manuscript, and reviewed and approved the final manuscript.
Funding
This work was supported by Zuellig Pharma Analytics and NUS Business Analytics Centre.
Competing interests
The authors declare no competing interests.
Additional information
Correspondence and requests for materials should be addressed to Y.P.
Reprints and permissions information is available at www.nature.com/reprints.
Publisher’s note Springer Nature remains neutral with regard to jurisdictional claims in published maps and
institutional affiliations.
Open Access This article is licensed under a Creative Commons Attribution 4.0 International
License, which permits use, sharing, adaptation, distribution and reproduction in any medium or
format, as long as you give appropriate credit to the original author(s) and the source, provide a link to the
Creative Commons licence, and indicate if changes were made. The images or other third party material in this
article are included in the article’s Creative Commons licence, unless indicated otherwise in a credit line to the
material. If material is not included in the article’s Creative Commons licence and your intended use is not
permitted by statutory regulation or exceeds the permitted use, you will need to obtain permission directly from
the copyright holder. To view a copy of this licence, visit http://creativecommons.org/licenses/by/4.0/.
© The Author(s) 2021
Scientific Reports | (2021) 11:13275 | https://doi.org/10.1038/s41598-021-92484-6 16
Vol:.(1234567890)You can also read