Wireless wearable biosensor smart physiological monitoring system for risk avoidance and rescue
←
→
Page content transcription
If your browser does not render page correctly, please read the page content below

MBE, 19(2): 1496−1514.
 DOI: 10.3934/mbe.2022069
 Received: 22 October 2021
 Accepted: 03 December 2021
 Published: 08 December 2021
http://www.aimspress.com/journal/MBE

Research article

Wireless wearable biosensor smart physiological monitoring system for
risk avoidance and rescue

Kezhou Chen1, Xu Lu1,2,*, Rongjun Chen1 and Jun Liu1

1 College of Computer Science, Guangdong Polytechnic Normal University, Guangzhou 510665,
 China
2 Pazhou Lab, Guangzhou 510330, China

* Correspondence: Email: bruda@126.com; Tel: +8613760693799.

Abstract: Most existing physiological testing systems broadly classify monitored physiological data
into three categories: normal, abnormal, and highly abnormal, but do not consider differences in the
importance of data within the same category, which may result in the loss of data of higher importance.
In addition, the purpose of physiological monitoring is to detect health abnormalities in patients earlier
and faster, thus enabling risk avoidance and real-time rescue. Therefore, we designed a system called
the adaptive physiological monitoring and rescue system (APMRS) that innovatively incorporates
emergency rescue functions into traditional physiological monitoring systems using the rescue of
modified-MAC (RM-MAC) protocol. The relay selection (RS) algorithm of APMRS can select the
appropriate relay to forward based on the importance of the physiological data, thus ensuring priority
transmission of more important monitoring data. In addition, we apply deep learning target trajectory
prediction technology to the indoor rescue module (IRM) of APMRS to provide high-performance
scheduling of location tracking nodes in advance by trajectory prediction. It reduces network energy
consumption and ensures perceptual tracking accuracy. When APMRS monitors abnormal
physiological data that may endanger a patient's life, IRM can implement effective and fast location
rescue to avoid risks.

Keywords: wireless wearable biosensors; real-time physiological monitoring; deep learning node
scheduling; risk avoidance and rescue

1. Introduction
1497

 With the development of wireless wearable biosensors, more heterogeneous wireless wearable
biosensors are used in combination to identify and monitor complex physiological states of the human
body [1], and these combinations are called wireless body area networks (WBANs) with low power
and low cost. WBSNs have several application areas, such as healthcare [2−5], military, entertainment,
and sports [6−8]. Currently, the main application area of WBANs is medical treatment and there is a
growing demand for high-performance WBANs, which leads to the creation of IEEE 802.15.6 [9], a
communication standard specifically designed for WBANs [10]. Scholars have designed many
algorithms and communication protocols with advanced performance based on the IEEE 802.15.6
standard to further improve the network lifetime (NL) and quality of service (QoS) of WBANs.
 Excellent protocols can ensure the transmission of important physiological data, reduce data
transmission delays, and extend the working life of biosensors, thus improving the performance of the
monitoring network in general. The adaptive MAC protocol (A-MAC) proposed by Yuan et al. [11]
adapts the super-frame structure of the IEEE 802.15.6 protocol into four phases to further improve the
throughput and transmission delay of WBANs. Ibrahim et al. [12] designed a modified-MAC (M-
MAC) protocol by adding a data type field to the MAC frame structure to classify the transmitted
information into normal data (ND), high normal data (HD), and critical data (CD) types and to improve
the QoS of WBANs by using the weighted energy and QoS (WEQ) algorithm to guarantee the
transmission of critical data. In terms of extending the lifetime of WBANs, Samal et al. [13] proposed
a traffic priority balancing scheduling (TPLBS) algorithm for different priority queues in wireless body
area networks based on the IEEE 802.15.6 model, which extends the lifetime of WBANs and reduces
the network packet loss rate by balancing the load on personal devices (PDs). The lifetime
maximization relay selection scheme (LMRSS) proposed by Zhang et al. [14] aims to maximize the
lifetime of WBAN. LMRSS can fully consider the remaining energy of each node and adjust the
communication network structure in time.
 Although most scholars treat data between normal and highly abnormal as a separate class, the
scale of this type of data is large, and traditional routing protocols are prone to the loss of higher
importance and more valuable data. In addition, WBANs in medical monitoring and diagnosis [3,15]
have developed rapidly, but most scholars have not considered the corresponding emergency rescue
measures when an emergency event is detected. However, corresponding emergency rescue measures
are necessary. In this work, we innovatively use indoor localization technology [16] and deep learning
pedestrian trajectory prediction technology [17] to design an IRM module to achieve pre-scheduling
of target tracking nodes, which saves the energy of heterogeneous tracking networks while ensuring
tracking accuracy. The structural framework of APMRS is shown in Figure 1.
 To improve the overall performance of APMRS real-time monitoring, the main contributions are
as follows:
 1) The rescue M-MAC (RM-MAC) protocol was designed by adding rescue packets to the M-
MAC protocol. This protocol subdivides high normal data into three layers to further improve APMRS
physiological monitoring data processing.
 2) The relay selection algorithm RS designed in this work can automatically select the appropriate
forwarding relay according to the importance of abnormal data, which further improves the
performance and intelligence of APMRS real-time physiological monitoring.
 3) To ensure the timely rescue of patients in indoor emergencies, we use deep learning trajectory
prediction technology for the first time to achieve pre-scheduling of the heterogeneous sensing nodes.
The tracking accuracy of heterogeneous sensing networks is ensured while saving network energy.

Mathematical Biosciences and Engineering Volume 19, Issue 2, 1496-1514.

1498

 Figure 1. The framework of APMRS.

 Finally, the work is arranged in the following structures to present the proposed APMRS in detail.
Section 1 briefly describes the status of WBAN development and the contribution of this study.
Section 2 briefly introduces the related work of WBANs. Section 3 details the specific architecture
and related algorithms of the APMRS. Section 4 simulates and verifies the performance of the APMRS.
Finally, Section 5 summarizes the results obtained in the experiments and discusses the preliminary
future research directions.

2. Related work

 WBANs routing protocols are classified according to their design goals and focus [18−21], but
they cannot be separated from the two key elements: NL and QoS. The focus of this section is to
explore the performance of existing WBAN routing protocols in healthcare and their shortcomings.
 First, low energy consumption is a fundamental requirement for the WBAN scheme design [22].
Many scholars apply the protocols of wireless sensor networks (WSNs) to WBANs, considering that
WBANs are an emerging subfield of WSNs. Qi et al. [23] used a MAC protocol based on a wake-up
radio mechanism, set priorities for service types and sensor nodes, simplified emergency service data
flow, and used a TDMA modulation mechanism to optimize the radio-based wake-up protocol to
reduce WBAN energy consumption and extend the network lifetime. However, the protocol of
WBANs is different from that of WSNs. Because the dormancy of nodes may lead to the loss of
important monitoring data and endanger the life of the patient. Thus, WBANs should be continuously
maintained in working conditions. Our paper combines the intelligent node scheduling and tracking
technology of heterogeneous WSN with WBAN real-time physiological parameter monitoring
technology, which can better protect users' lives. Some other researchers have also introduced the WSN
multipath routing approach into the routing design of WBANs [24], using a node-independent
multipath routing approach. Multipath refers to the simultaneous establishment of multiple
transmission paths between the source and destination nodes to transmit data in grouped parallel pairs.
In addition, node-independent multipath routing refers to independent paths between the source and

Mathematical Biosciences and Engineering Volume 19, Issue 2, 1496-1514.
1499

destination nodes. Independent paths between source and destination nodes have no common nodes or
paths between them. The advantage of this approach is that multipaths can be used to ensure stable
transmission, balance the energy consumption of nodes, and extend the network lifetime. However,
multiple transmissions also greatly increase the probability of packet transmission errors. In addition,
when the density of WBAN nodes increases, the difficulty of path planning increases dramatically.
Therefore, Ullah et al. [25] and Abidi et al. [26] cited cluster-based routing algorithms. A dual-sink
node clustering-based routing protocol (DSCB) proposed by Ullah et al. [25] can effectively overcome
the drawbacks of single-sink node network congestion, high data transmission failure rate, and inability
to adapt to dynamic environments. On the other hand, Nadeem et al. [27] uses a dual cluster head
model to further extend the network lifetime of WBANs by balancing the load and energy consumption
between the two sink nodes. However, the method of selecting cluster heads is simple. It only considers
distance and remaining energy, resulting in cluster heads close to the gateway consuming too much
energy to dying early and affecting the performance of the whole network.
 Although WBANs are an emerging subfield of WSNs, the vast majority of WSN routing
algorithms are inapplicable to WBANs. In addition, the research on cluster-based routing algorithms
is insufficiently mature [20]. Thus, some energy-efficient routing protocols specifically designed for
WBANs have proliferated. For example, the SIMPLE protocol [27] minimizes network energy
consumption and increases network throughput by using multi-hop communication and a cost function.
To further improve the performance of WBAN, increase the network lifetime, and maximize the
throughput, the authors [28] used a fuzzy logic approach to optimize the selection of relay forwarding
nodes. Moreover, Huang et al. [29] explored the energy loss rate of the nodes and designed a load
balancing and energy efficiency scheme (LBEE). This scheme can balance the energy consumption
differences caused by node heterogeneity, assign forwarding tasks based on the current capacity and
load state of nodes, avoid rapid death of nodes due to overload, and effectively improve network
lifetime and throughput.
 Although these methods of extending the lifetime of WBANs have yielded some results, as
WBANs are refined and developed, scholars are once again demanding more QoS. Ensuring QoS in
resource-limited WBANs is a serious challenge, which requires balancing multiple aspects of
performance, including data priority, link reliability, node temperature, energy efficiency, and
transmission latency [20]. The LRPD (lightweight QoS routing protocol for delay-sensitive wireless
body area networks) protocol proposed by Kumar et al. [30] is specifically designed to optimize
delayed QoS by using a modular approach with tight coordination between the modules to achieve the
target optimization. Data from the upper layers are initially fed to the data classification module for
prioritization. The data are classified into general-purpose packets (GP) and the highest priority delay
sensitive packets (DP). Then, DP and GP data enter the general-purpose module and the delay module,
respectively, and are finally sent to the queue processing module. DP packets do not require waiting
for direct transmission, whereas low-priority data should wait for the appropriate transmission time to
ensure the non-delayed transmission of DP data. The hybrid routing protocol (HDPR) [31] considers
path loss, link reliability, data transmission delay, and node temperature for full optimization. The
HDPR classifies data into delay-sensitive data (DSD), normal data (ND), critical data (CD), and
reliability-sensitive data (RSD). Data are prioritized from highest to lowest, and CD, DSD, RSD, and
ND data are classified into QoS-aware modules through their respective data modules. The task of this
module is to send them to the appropriate module according to the requirements of each module. For
example, DSD data are sent to the delay estimation module, and then the routing module finds the best

Mathematical Biosciences and Engineering Volume 19, Issue 2, 1496-1514.
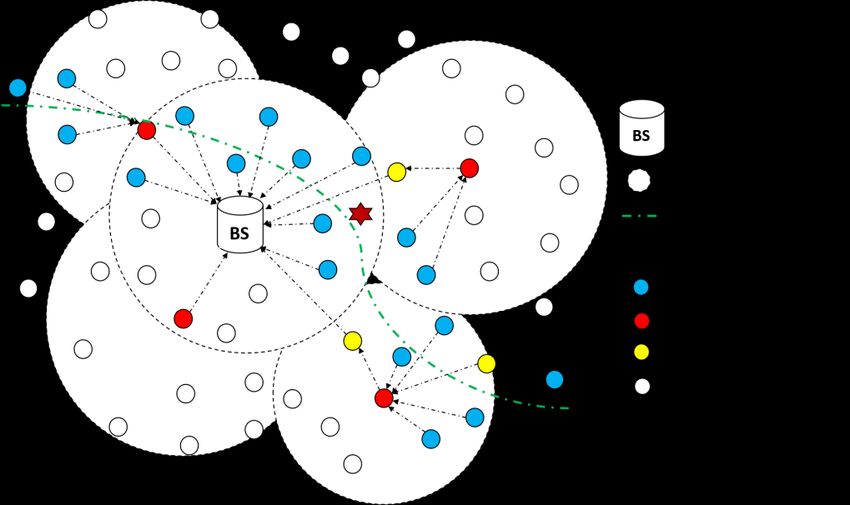
1500

path for them. The HDPR also eliminates the data sensing function of relay nodes, reducing the loss
of sensing capability of relay nodes and further extending the network lifetime. The HDPR protocol uses
a MAC frame structure and it does not specify how the priority of forwarded data should be identified
between nodes. The specific differences between the above protocols are compared in Table 1.

 Table 1. Comparison of different routing protocols.
 Name Critical technologies Optimization Deficiency
 Wake-up Radio Sensor node prioritization, Wake-up Critical monitoring data may
 Mechanism [23] Optimized radio wake-up protocol mechanism be lost.
 Power Node-independent The probability of packet
 Data transmission
 Control-AODV [24] multipath routing approach transmission errors increases.
 Dual-sink node clustering-based Cluster heads close to the
 DSCB [25] Clustering method
 routing protocol gateway will die early.
 Cost function, Cluster head The algorithm is
 SIMPLE [27]
 Multi-hop communication selection insufficiently mature.
 Energy-efficient multi- The data collection time will
 Fuzzy logic Data transmission
 hop routing protocol [28] be extended.
 Data transmission; Critical monitoring data may
 LBEE [29] Load balancing
 Throughput be lost.
 Modular approach with tight
 coordination between the Energy efficiency
 LRPD [30] modules, Delayed QoS
 is not high.
 Data classification

 On the other hand, the most common method to extend the network lifetime of WSNs is the sleep
schedule, where partially redundant nodes are put into a dormant state since guaranteed coverage of
the monitored area, and then the node states are updated by a wake-up algorithm [32]. The work of
Radhika et al. [33] also introduces a machine learning approach for similarity analysis of node data,
and nodes with high similarity will switch to sleep mode. All these methods have the risk of degrading
the accuracy of localization tracking, while our work uses a node sleep scheduling method based on
target trajectory prediction, which can reduce the scheduling of active nodes to a greater extent and
extend the network lifetime while ensuring tracking accuracy, as shown in Figure 2.

 Figure 2. Pre-scheduling method of wireless sensor nodes based on trajectory prediction.

Mathematical Biosciences and Engineering Volume 19, Issue 2, 1496-1514.
1501

 The pre-scheduling method eliminates the need to keep most of the nodes active throughout the
network for a long time as in the traditional node sleep scheduling algorithm. During the idle period,
the network only needs to keep the nodes at the key entry and exit points and the nodes used for
communication transmission active, and the rest of the nodes can be woken upon demand. In addition,
this method can enhance the number of active nodes near the target and improve localization tracking
accuracy to some extent.
 A comprehensive analysis of these methods shows that scholars have focused only on mimicking
the performance of WBANs in terms of monitoring and lacking methods to respond in unexpected
situations. The ability of patients to receive timely rescue when unexpected situations occur is also one
of the important indicators of the QoS of WBANs. APMRS is designed to extend the M-MAC protocol
by introducing the emergency relief field and specifying the priority level of each packet, and the
proposed RS algorithm can adaptively select the appropriate forwarding nodes in accordance with the
priority level of the packet to ensure the low latency transmission of packets with higher importance.
Integrating indoor positioning technology with a deep learning trajectory prediction network, an IRM
system is designed to ensure that patients can be rescued in time to cope with the lack of rescue
measures for emergencies.

3. APMRS and algorithms

 Figure 3. Operation process of APMRS.

Mathematical Biosciences and Engineering Volume 19, Issue 2, 1496-1514.

1502

 APMRS consists of two modules, WBANs and IRM. WBAN monitors physiological data in real-
time, and IRM assists in emergency rescue when monitoring abnormal physiological data to ensure
patient's life safety. The WBAN module can deceptively select appropriate forwarding relays
according to the priority of patient data to reduce critical data transmission delays and extend system
lifetime. The overall workflow of APMRS is shown in Figure 3.

3.1. WBANs module

 Many studies have shown the significant role of the MAC protocol in improving the reliability and
energy efficiency of network information transmission [10]. The MAC frame is composed of a frame
header, a frame e body, and a frame check sequence (FCS). The MAC frame header consists of four
fields. The first field is the control field, and it consists of four eight-bit bytes. M-MAC is an improved
version of the MAC protocol, which adds a data type field to the MAC frame header, and the frame
header length remains unchanged. The data type of RM-MAC is expanded into four categories, namely,
normal data (ND), high normal data (HD), critical data (CD), and rescue data (RD). The priority level
of HD packets is further refined to reduce the loss rate of high-value data, as shown in Table 2 and
Figure 4.

 Table 2. Data type expression and sending method.
 Data type Binary expression form Sending method
 Normal 00 No Sending
 High normal 01 Using RS
 Critical 10 Send Directly

 Figure 4. RM-MAC frame structure.

 In Table 2, RD and CD data are transmitted directly to the sink node, and ND and HD packets are
transmitted in a multi-hop fashion. However, the prioritization of data as in Table 2 is not sufficient,
and the more important ND and HD packets may be discarded during transmission because they exceed

Mathematical Biosciences and Engineering Volume 19, Issue 2, 1496-1514.
1503

the expiration date. The labeling of data priority is also unclear in many studies [30,31], where the
importance of the same type of packets is different, ensuring that the transmission of data with higher
importance (HD data with higher anomalies) is more beneficial for disease prevention and diagnosis.
The RM-MAC protocol can solve these problems well.

3.2. RS algorithm

 The APMRS lifetime and monitoring performance are two conflicting factors. Reducing energy
consumption will affect monitoring performance, while ensuring high monitoring performance
requires more energy consumption. Therefore, choosing the right solution for the current situation is
the key to balancing the system’s lifetime and monitoring performance. The RS algorithm is
specifically designed for the RM-MAC protocol to improve the intelligence of APMRS physiological
monitoring, and the RS algorithm is defined as follows:

 = , = 0,1,2 (1)
 + +

 = + ( [ 1 , 2 , ⋯ , ]) (2)
 In Eq (1), is the residual energy of the relay node, is the real-time load of the relay node,
 is a constant factor, is the priority level of similar data, and is the real-time transmission delay
of the relay node. In particular, the value of only represents the priority level of the data, the exact
value can be adjusted appropriately in practical applications, and the generation of is random in
the simulation experiments. In Eq (2), is the load generated by the node itself and (∙) is the
forwarding load from other surviving nodes.

3.3. IRM module

 The overall framework of the IRM is shown in Figure 5, which consists of two main parts: first,
the pedestrian trajectory prediction network; second, the adaptive confidence radius-based node
scheduling module. In this work, we use the sparse graph convolution network (SGCN) for target
trajectory prediction [17]. SGCN explicitly models sparse directed interactions with sparse directed
spatial graphs to capture adaptive interactions of pedestrians. Meanwhile, SGCN uses sparse directed
temporal graphs to model motion trends. Finally, the estimates of the above two sparse graphs are used
to predict the target trajectories of pedestrians. In Figure 5, the prediction trajectories output from
SGCN are transmitted to the error analysis module to obtain confidence intervals for each prediction
coordinate error. In the same prediction, the width of the confidence interval is proportional to the
length of the predicted trajectory. After obtaining the predicted coordinates, the sensing nodes are
scheduled in advance based on the coordinates of known nodes and the remaining energy and other
information. At present, WSN indoor location tracking techniques have been developed quite maturely,
so the focus of this module study is not on the tracking scheme, but on the scheduling method of
tracking nodes.

Mathematical Biosciences and Engineering Volume 19, Issue 2, 1496-1514.
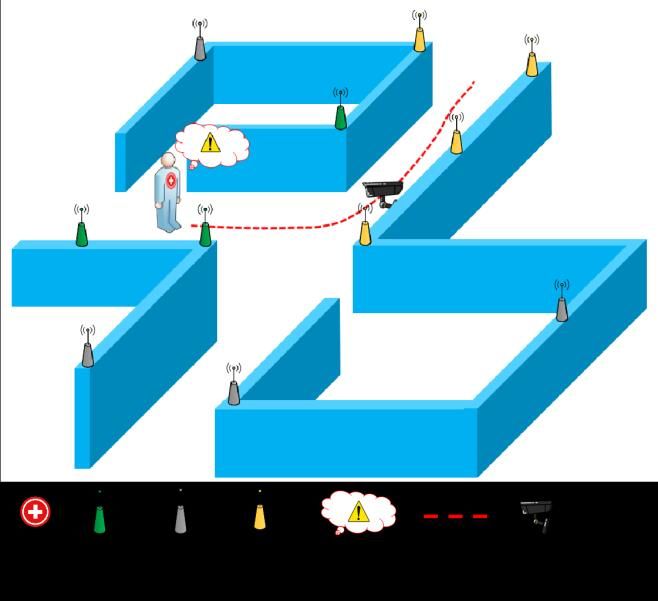
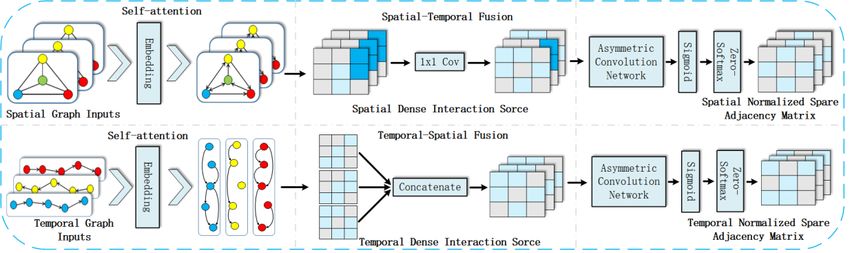
1504

 Figure 5. The framework of IRM.

 Sparse graph convolution network. The contribution of SGCN is the use of sparse directed spatial
graph interactions to capture adaptive interaction pedestrians. Meanwhile, sparse directed temporal
graphs are used to model pedestrian movement trends. Finally, parameters of a bi-Gaussian distribution
for trajectory prediction are estimated by fusing the above two sparse graphs. As shown in Figure 5,
the SGCN network mainly consists of sparse graph learning and bi-Gaussian distribution parameter
estimation based on trajectory representation. Figure 6 shows the sparse graph of the learning structure.
In Figure 6, self-attention generates dense spatial interaction scores and temporal interaction scores
based on the inputs of the spatial and temporal maps, respectively. Then, the spatial interaction score
of each time step and the temporal interaction score of each pedestrian are spatially-temporally fused
by a 1 × 1 convolutional layer and a self-attentive mechanism.

 Figure 6. Sparse graph learning.

 Scheduling module. The analysis of the prediction trajectory generated by SGCN shows that the
average displacement error (ADE) and the endpoint displacement error (FDE) both increase as the
prediction distance grows. Therefore, how to realize the adaptive adjustment of pre-scheduling radius
is also a key issue. The adaptive confidence radius (ACR) is defined as shown in Eq (3) and Figure 7.

Mathematical Biosciences and Engineering Volume 19, Issue 2, 1496-1514.
1505

 = +⊚ ( , ( [[ 1 , 2 , ⋯ , ]])) , ∈ ∗ (3)

 In Eq 3, [∙] is the set of errors between the actual and predicted coordinates, (∙) is the
sorting function, and ⊚ (∙) is the confidence interval size solving function with a significant level of
 = 0.05. The function ⊚ (∙) counts the upper and lower limits of the confidence interval and then
takes the difference. is the shortest distance to successfully locate the predicted coordinates.
The IRM uses the classical three-point localization algorithm, so = ( ( [ 1 , 2 , 3 ])) .
Where the above equation [∙] is the set of scheduling nodes needed to successfully locate the
predicted coordinates, and the function (∙) calculates the distance between the predicted
coordinates and the nodes.
 In addition, as shown in Figure 7, the ACR can also be referred to as the adaptive sensing node
scheduling radius, i.e., with the predicted coordinates as the centre of the circle, all dormant nodes
within the ACR radius are activated, and the set of these nodes is referred to as the pre-scheduled set
(PS). The actual coordinates of the pedestrian also correspond to a set of nodes to be scheduled, and
the set of these nodes is referred to as the actual scheduling set (AS). To show more clearly the
performance of the ACR node-based scheduling method, two metrics are defined, one of which is the
scheduling accuracy (SA) and the other is the radius ratio (RR). SA is the ratio between the number of
successful schedules N and the total number of schedules TN, and when ⊆ this pre-scheduling
is successful. As shown in Figure 7, the radius ratio is the ratio of to ACR.

 Figure 7. Node scheduling based on trajectory prediction.

 In Figure 7, the green dashed line indicates the coverage of the actual scheduled set, and the blue
dashed line indicates the coverage of the pre-scheduled set. The node that exists with both sets is the
node that successfully achieves pre-scheduling. When the pre-scheduled set covers just the actual
scheduled set, the nodes have the best pre-scheduling performance and the network has the least energy
loss, i.e., the radius ratio is higher under the same conditions.

Mathematical Biosciences and Engineering Volume 19, Issue 2, 1496-1514.
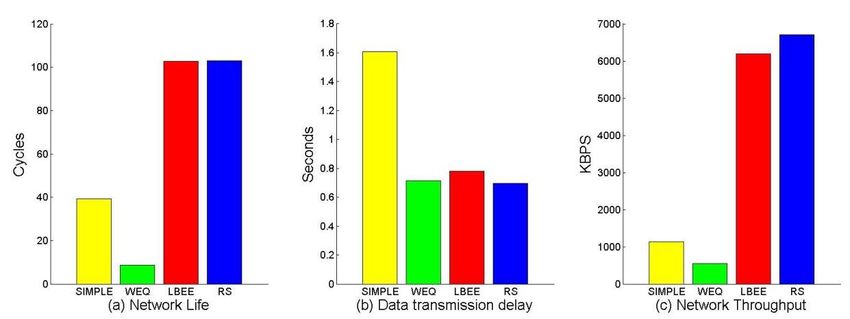
1506

4. Simulation results

 In this work, we conducted simulation comparison experiments using MATLAB 2018a to
compare the performance of RS, LBEE [29], WEQ [12] and SIMPLE [27] in terms of network lifetime,
throughput, and data transmission delay.

4.1. Network model parameters

 The simulation site size of this experiment is 2 × 2 , 30 nodes are randomly distributed on
the site, and the nodes can automatically adjust the transmitting power according to the actual
communication distance. Details of the network parameters are listed in Table 3.

 Table 3. Network model parameters.
 Parameter Name Values
 Sink coordinates (1,1)
 Receiving and sending energy consumption 50 /
 10 / / 2
 0.0013 / / 4
 Number of sink nodes 1
 Maximum packet size 2
 Initial energy 0.1
 Communication Standard IEEE 802.15.6
 10
 Random delay range 0.1 ~0.5

 The period is defined as the time for all nodes to complete one data transmission, the real-time
load of each node in each period is randomly generated, the size of the node’s own packet is
proportional to the real-time load, and each node in the network has the same initialization energy. The
network lifetime is the number of cycles in which the first node dies, and the transmission delay is the
average of the time required by all nodes to complete data transmission. The throughput is the ratio of
the total amount of data received by the water sink nodes to the time required to receive the data, and
its mathematical expression takes the form of Eq (4), as follows:

 ℎ ℎ =
 (4)

4.2. WBANs simulation results

 The comprehensive performance of the LBEE, WEQ, SIMPLE and RS algorithms in the most
energy-efficient mode (k = 0) is compared, and Figure 8(a) shows that the RS and LBEE algorithms
have the longest network lifetime and the WEQ algorithm has the shortest. This is because the WEQ
algorithm tends to select nodes closer to the sink to forward data, resulting in the rapid energy depletion
and death of these nodes. In Figure 8(b) the differences between the transmission delay of RS, LBEE
and WEQ algorithms are small, but the SIMPLE algorithm data transmission delay is much higher

Mathematical Biosciences and Engineering Volume 19, Issue 2, 1496-1514.
1507

than that of the three other algorithms because the SIMPLE algorithm does not consider the forwarding
delay of the node when selecting the next-hop routing node. According to the data in Figure 8(c), the
throughput of the RS algorithm is the highest, and the throughput of RS and LBEE algorithms is much
higher than that of WEQ and SIMPLE algorithms. The RS algorithm has the highest comprehensive
performance among all simulation algorithms.

 Figure 8. Comprehensive performance comparison of simulation algorithms, k = 0.

 The data transmission delay and throughput are important parameters in QoS, and Figure 9 shows
the effect of RS performance on the response to data of different priority levels (k). In Figure 9(a), the
energy of the network is intensively lost when providing lower transmission delay for data with larger
k values, resulting in a 28.33% decrease in network lifetime. However, Figure 9(b),(c) show that with
the decrease in network lifetime, the data transmission delay decreases by 30.77% and the throughput
improves by 14.94%. The growth rates of data transmission delay and throughput are the highest in
phase, reaching 26.25% and 15.85%, respectively.

 Figure 9. RS algorithm data forwarding performance comparison by priority level.

 Network structure compatibility is also an important criterion for considering the performance of
network operation, and Figure 10 shows the performance of the RS, LBEE, WEQ and SIMPLE
algorithms at different node densities. Figure 10 (a) shows that the RS and LBEE algorithms maintain
the highest and most stable network lifetime despite the increase in network node density, followed by

Mathematical Biosciences and Engineering Volume 19, Issue 2, 1496-1514.
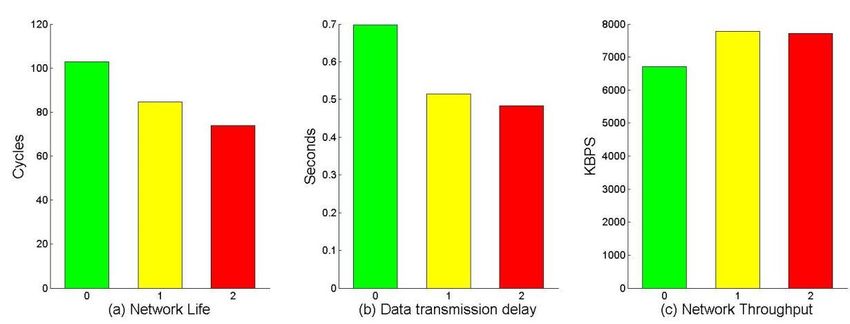
1508

the SIMPLE algorithm, while the WEQ algorithm has the shortest network lifetime. The data in Figure
10(b) shows that the transmission delay of SIMPLE is the highest at different node densities and the
data transmission delay of WEQ varies more steadily and stays at a low level, while the data
transmission delay of the RS and LBEE algorithms decreases sharply with the increases of node density.
When X = 30, the delay of the RS algorithm is the lowest. In Figure 10(c), the throughput of WEQ and
SIMPLE algorithms remains stable, and the throughput of RS and LBEE algorithms increases with the
increase in node density. Among them, RS has the highest growth rate. The analysis in Figure 10(a)−(c)
shows that the RS algorithm maintains a stable network lifetime, reduces transmission delay by about
60% and increases network throughput by 640% as the network node density increases. It is more
flexible than the LBEE algorithm in which the packet can adaptively choose a more appropriate
sending path. In addition, the RS algorithm is more suitable for application in networks with high node
density, a feature that fits perfectly with the trend of network complexity and high performance of
WBANs.

 (a) (b)

 (c)

 Figure 10. RS algorithm network compatibility test, k = 0. (a) Network life (cycles). (b)
 Data transmission delay (seconds). (c) Network throughput (kbps).

Mathematical Biosciences and Engineering Volume 19, Issue 2, 1496-1514.
1509

 A more detailed network performance comparison of these simulation algorithms is shown in
Table 4.

 Table 4. Detailed performance comparison of simulation algorithms.
 K Number of
 Parameters Name
 0 1 2 nodes
 RS 0.6975 0.5144 0.4829
 LBEE 0.7800 0.7809 0.7668
 Delay (s)
 WEQ 0.7148 0.7309 0.7257
 SIMPLE 1.6086 1.6601 1.6353
 RS 6873200 7962700 7899800
 Throughput LBEE 6342700 6301700 6626100
 30
 (bps) WEQ 564340 555340 561320
 SIMPLE 1162800 1082500 1127400
 RS 102.945 84.505 73.785
 LBEE 102.74 102.68 102.94
 Lifetime (cycles) WEQ 8.61 8.62 8.88
 SIMPLE 39.415 37.615 38.36
 RS 0.9396 0.6761 0.6195
 LBEE 1.031 1.0333 1.033
 Delay (s)
 WEQ 0.8479 0.8063 0.8281
 SIMPLE 1.6862 1.67 1.691
 RS 3352800 3928400 3884400
 Throughput LBEE 3110400 3120400 3145500
 20
 (bps) WEQ 437320 463990 439500
 SIMPLE 843810 843930 805500
 RS 102.135 84.375 74.79
 LBEE 102.99 103.13 103.33
 Lifetime (cycles)
 WEQ 11.7 11.6 11.175
 SIMPLE 44.465 43.275 41.715
 RS 1.6957 1.2383 1.1171
 LBEE 1.7842 1.734 1.7631
 Delay (s)
 WEQ 0.601 0.6193 0.5875
 SIMPLE 1.8656 1.8402 1.8647
 RS 928530 1058800 1080200
 Throughput LBEE 886850 917170 898060
 10
 (bps) WEQ 998340 869960 704520
 SIMPLE 461570 478510 457590
 RS 101.7 84.555 75.775
 LBEE 101.23 101.525 100.54
 Lifetime (cycles)
 WEQ 21.815 21.81 20.17
 SIMPLE 53.45 53.855 52.685

Mathematical Biosciences and Engineering Volume 19, Issue 2, 1496-1514.
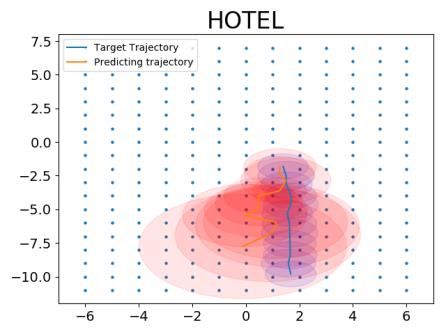
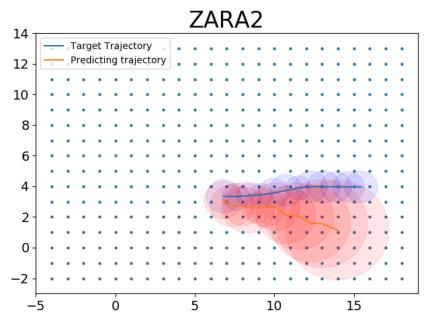
1510

4.3. IRM Simulation results

 Evaluation datasets. To validate the effectiveness of our proposed method, we first used two
public pedestrian trajectory datasets for training the SGCN network, namely ETH [34] and UCY [35],
which are the most widely used trajectory benchmarks. In particular, the ETH dataset contains the ETH
and HOTEL scenes, while the UCY dataset contains three different scenes including UNIV, ZARA1,
and ZARA2. We follow existing works of SGCN that observe 8 frame trajectories and predict the next
12 frames.
 Evaluation metrics. We employ two metrics, namely Scheduling Accuracy (SA) and Radius Ratio
(RR) to evaluate the pre-scheduling results. SA is the ratio of the number of successful advances
scheduled to the total number of scheduled. A successful pre-scheduling is achieved when the
scheduled nodes corresponding to each actual trajectory in each of the predicted 12 frames are included
in the set of pre-scheduled nodes corresponding to each frame. RR indirectly represents the net loss of
pre-scheduling, and a smaller RR value indicates that the range of pre-scheduling is relatively larger,
and more nodes are woken up. When the predicted coordinates overlap with the actual coordinates, the
closer the RR value is to 1, the better the pre-scheduling effect is.
 Experimental settings. In our experiments we refer to SGCN [17], the embedding dimension of
self-attention and the dimension of graph embedding are set to 64. The number of self-attention layers
is 1. The spatial-temporal GCN and temporal-spatial GCN cascade 1 layer, respectively. The TCN
cascades 4 layers. The asymmetric convolution network comprises 7 convolution layers with a kernel
size of S = 3. The threshold value ξ is empirically set to 0.5. PRelu is adopted as the nonlinear
activation δ(·). The proposed method was trained using the Adam optimizer for 150 epochs with data
batches of size 128. The initial learning rate was set at 0.001.
 We ignore the actual environment at the time of ETH and UCY acquisition and place these
trajectories on an obstacle-free planar space, with wireless sensing nodes uniformly distributed on
these planes. Figure 11 shows the predicted scheduling of sensing nodes for five different datasets. The
blue circles in the figure indicate the minimum node coverage required to locate the true coordinates,
and the red circles indicate the coverage of the pre-scheduling nodes. The error in trajectory prediction
accumulates as the predicted trajectory length increases, so the range of pre-scheduling is gradually
expanded. The pre-scheduling range of the sensing nodes is related to the prediction quality of the
target trajectory, the smaller the error of the predicted trajectory and the pre-scheduling range, the
higher the energy efficiency of the network. In addition, the uniformly distributed blue dots in the
figure indicate the sensing nodes, which all works properly, except for the red circle range and the
nodes used for forwarding data (which are not marked in the figure), which are active, while all other
nodes are dormant. The input trajectories used for trajectory prediction are also ignored in the figure,
and the blue circles indicate the scheduling range in the ideal state. The pre-scheduling results of the
five datasets show that the adaptive confidence scheduling radius can achieve the pre-scheduling of
nodes better even if the accuracy of trajectory prediction is not high enough. The pre-scheduling effect
of ETH and ZARA1 trajectory segments in the figure is the best, and the pre-scheduling effect of
ZARA2 is slightly lacking, but based on the coverage of the pre-scheduled nodes, it can be judged that
the pre-scheduling can still achieve the localization of real coordinates. In addition, the pre-scheduling
range is related to the density of the monitored spatial sensing nodes. Figure 12 shows the SA as well
as the RR for the five datasets ETH, HOTEL, NUIV and ZARA1ZARA2. The SA of all five datasets
exceeds 90% and is relatively smooth, but the values of the RR are not high and are between 0.4

Mathematical Biosciences and Engineering Volume 19, Issue 2, 1496-1514.
1511

and 0.6. By referring to the trajectory prediction results of five public data sets of SGCN [17], it can
be known that the comprehensive prediction quality of ZARA1 and ZARA2 is the best. Therefore, in
Figure 12, THE RR values of ZARA1 and ZARA2 are the highest. Obviously, the better the trajectory
prediction quality is, the higher the RR value will be, and the less the energy loss of the indirect ground
network will be. Therefore, to achieve more accurate pre-scheduling of sensing nodes, improving the
accuracy and stability of trajectory prediction is a key breakthrough.

 Figure 11. Sensing node pre-scheduling visualization.

 Figure 12. The effect of pre-scheduling of sensing nodes.

Mathematical Biosciences and Engineering Volume 19, Issue 2, 1496-1514.
1512

5. Conclusions

 To further improve the processing capability of APMRS monitoring data and reduce the packet
loss rate of high-value data, we designed the RM-MAC protocol, added rescue data to the data type of
M-MAC, and further refined the classification of packets with the same priority to ensure that data
with higher importance can reach the sink smoothly. The RS algorithm can adaptively select the
appropriate forwarding relay according to the priority of data, thus further improving the intelligence
of APMRS physiological monitoring. The most important feature of APMRS is that it can achieve a
high-performance emergency rescue function, and the SGCN deep learning trajectory prediction
network is invoked to pre-dispatch the wireless sensing nodes to ensure the accuracy of sensing
tracking while reducing network energy consumption to provide timely rescue for patients. However,
the choice of k and α in the RS algorithm is slightly difficult, resulting in a slight decrease in throughput,
which does not affect the overall advantage of APMRS. Therefore, the impact of and on
APMRS performance and how to improve the prediction accuracy of target trajectories will be
explored in the future.

Acknowledgments

 This work was supported in part by the National Natural Science Foundation of China (62176067,
61802073); National Key Research and Development Program of China (SQ2020YFF0416833); Scientific
and Technological Planning Project of Guangzhou, China (201903010041, 202103000040); Key Project
of Guangdong Province Basic Research Foundation (2020B1515120095); Project Supported by
Guangdong Province Universities and Colleges Pearl River Scholar Funded Scheme (2019).

Conflict of interest

 The authors declare that there is no conflict of interest regarding the publication of this paper.

References

1. A. Haleem, M. Javaid, R. P. Singh, R. Suman, S. Rab, Biosensors applications in medical field: A
 brief review, Sens. Int., 2021 (2021), 100100. doi: 10.1016/j.sintl. 2021.100100.
2. C. Chakraborty, B. Gupta, S. K. Ghosh, A review on telemedicine-based WBAN framework for
 patient monitoring, Telemed. e-Health, 19 (2013), 619−626. doi: 10.1089/tmj.2012.0215.
3. P. Kassal, M. D. Steinberg, I. M. Steinberg, Wireless chemical sensors and biosensors: A review,
 Sens. Actuators B Chem., 266 (2018), 228−245. doi: 10.1016/ j.snb.2018.03.074.
4. E. M. Green, R. van Mourik, C. Wolfus, S. B. Heitner, O. Dur, M. J. Semigran, Machine learning
 detection of obstructive hypertrophic cardiomyopathy using a wearable biosensor, NPJ Digit.
 Med., 2 (2019), 1−4. doi: 10.1038/s41746-019-0130-0.
5. R. Karthickraja, R. Kumar, S. Kirubakaran, R. Manikandan, COVID-19 prediction and symptom
 analysis using wearable sensors and IoT, in International Journal of Pervasive Computing and
 Communications, (2020). doi: 10.1108/IJPCC-09-2020-0146.

Mathematical Biosciences and Engineering Volume 19, Issue 2, 1496-1514.
1513

6. Y. Mao, W. Yue, T. Zhao, M. Shen, B. Liu, S. Chen, A self-powered biosensor for monitoring
 maximal lactate steady state in sport training, Biosensors, 10 (2020), 75. doi:
 10.3390/bios10070075.
7. A. Salim, S. Lim, Recent advances in noninvasive flexible and wearable wireless biosensors,
 Biosen. Bioelectron., 141 (2019), 111422. doi: 10.1016/j.bios. 2019.111422.
8. Y. Song, J. Min, Y. Yu, H. Wang, Y. Yang, H. Zhang, et al, Wireless battery-free wearable sweat
 sensor powered by human motion, Sci. Adv., 6 (2020), eaay9842. doi: 10.1126/sciadv.aay9842.
9. K. S. Kwak, S. Ullah, N. Ullah, An overview of IEEE 802.15.6 standard, in 2010 3rd International
 Symposium on Applied Sciences in Biomedical and Communication Technologies, (2010). doi:
 10.1109/ISABEL.2010.5702867.
10. S. Ullah, M. Mohaisen, M. A. Alnuem, A review of IEEE 802.15. 6 MAC, PHY and security
 specifications, Int. J. Distrib. Sens. Netw., 9 (2013), 950704. doi: 10.1155/2013/950704.
11. D. Yuan, G. Zheng, H. Ma, J. Shang, J. Li, An adaptive MAC protocol based on IEEE802.15.6
 for wireless body area networks, Wirel. Commun. Mob. Comput., 2019 (2019). doi:
 10.1155/2019/3681631.
12. A. A. Ibrahim, O. Bayat, O. N. Ucan, S. Salisu, Weighted energy and QoS based multi-hop
 transmission routing algorithm for WBAN, in 2020 6th International Engineering Conference
 “Sustainable Technology and Development”, (2020). doi: 10.1109/IEC49899.2020.9122909.
13. T. Samal, M. R. Kabat, A prioritized traffic scheduling with load balancing in wireless body area
 networks, J. King Saud Univ. Comput. Inf. Sci., 2021 (2021). doi: 10.1016/j.jksuci.2020.12.023.
14. Y. Zhang, B. Zhang, S. Zhang, An adaptive energy-aware relay mechanism for IEEE 802.15. 6
 wireless body area networks, Wirel. Pers. Commun., 115 (2020), 2363−2389. doi:
 10.1007/s11277-020-07686-4.
15. R. C. Tseng, C. C. Chen, S. M. Hsu, H. S. Chuang, Contact-lens biosensors, Sensors, 18 (2018),
 2651. doi: 10.3390/ s18082651.
16. J. Hu, D. Liu, Z. Yan, H. Liu, Experimental analysis on weight K-nearest neighbor indoor
 fingerprint positioning, IEEE Internet Things J., 6 (2018), 891−897. doi:
 10.1109/JIOT.2018.2864607.
17. L Shi, L. Wang, C. Long, S. Zhou, M. Zhou, Z. Niu, et al., SGCN: Sparse graph convolution
 network for pedestrian trajectory prediction, preprint, arXiv:2104.01528v1.
18. J. I. Bangash, A. H. Abdullah, M. H. Anisi, A. W. Khan, A survey of routing protocols in wireless
 body sensor networks, Sensors, 14 (2014), 1322−1357. doi: 10.3390/s140101322.
19. J., Anand, D. Sethi, Comparative analysis of energy efficient routing in WBAN, in 2017 3rd
 International Conference on Computational Intelligence and Communication Technology, (2017).
 doi: 10.1109/CIACT.2017.7977373.
20. Y. Qu, G. Zheng, H. Ma, X. Wang, B. Ji, H. Wu, A survey of routing protocols in WBAN for
 healthcare applications, Sensors, 19 (2019), 1638. doi: 10.3390/s19071638.
21. A. S. Alzahrani, K. Almotairi, Performance comparison of WBAN routing protocols, in 2019 2nd
 International Conference on Computer Applications and Information Security, (2019). doi:
 10.1109/CAIS.2019.8769594.
22. Z. Ullah, I. Ahmed, F. A. Khan, M. Asif, M. Nawaz, T. Ali, et al., Energy-efficient harvested-
 aware clustering and cooperative routing protocol for WBAN (E-HARP), IEEE Access, 7 (2019),
 100036−100050. doi: 10.1109/ACCESS.2019.2930652.

Mathematical Biosciences and Engineering Volume 19, Issue 2, 1496-1514.
1514

23. Z. Qi, Y. Y. Xin, Study on WBAN-based efficient and energy saving access mechanisms, Int. J.
 Multimed Ubiquitous Eng., 11 (2016), 35−42. doi: 10.14257/ijmue.2016.11.6.04.
24. Y. Peng, S. Zhang, A power optimization routing algorithm for wireless body area network,
 Electron. Sci. Technol., 7 (2018), 34−37.
25. Z. Ullah, I. Ahmed, K. Razzaq, M. K. Naseer, N. Ahmed, DSCB: Dual sink approach using
 clustering in body area network, Peer Peer Netw. Appl., 12 (2019), 357−370. doi:
 10.1007/s12083-017-0587-z.
26. B. Abidi, A. Jilbab, E. H. Mohamed, An energy efficiency routing protocol for wireless body area
 networks, J. Med. Eng. Technol., 42 (2018), 290−297. doi: 10.1080/03091902.2018.1483440.
27. Q. Nadeem, N. Javaid, S. N. Mohammad, M. Y. Khan, S. Sarfraz, M. Gull, Simple: Stable
 increased-throughput multi-hop protocol for link efficiency in wireless body area networks, in
 2013 eighth international conference on broadband and wireless computing, communication and
 applications, (2013). doi: 10.1109/BWCCA.2013.42.
28. S. R. Chavva, R. S. Sangam, An energy-efficient multi-hop routing protocol for health monitoring
 in wireless body area networks, Netw. Model. Anal. Health Inform. Bioinform., 8 (2019), 1−10.
 doi: 10.1007/s13721-019-0201-9.
29. Q. Huang, J. Tan, W. Jiang, A new load balancing routing scheme for wireless body area networks,
 in 2019 IEEE 3rd Information Technology, Networking, Electronic and Automation Control
 Conference, (2019). doi: 10.1109/ ITNEC.2019.8729343.
30. M. A. Kumar, C. V. Raj, On designing lightweight qos routing protocol for delay-sensitive
 wireless body area networks, in International Conference on Advances in Computing,
 Communications and Informatics, (2017).
31. S. Vetale, A. V. Vidhate, Hybrid data-centric routing protocol of wireless body area network, in
 2017 International Conference on Advances in Computing, Communication and Control, (2017).
 doi: 10.1109/ ICAC3.2017.8318793.
32. P. S. Banerjee, S. N. Mandal, D. De, B. Maiti, iSleep: Thermal entropy aware intelligent sleep
 scheduling algorithm for wireless sensor network, Microsyst. Technol., 26 (2020), 2305−2323.
 doi: 10.1007/s00542-019-04706-7.
33. S. Radhika, P. Rangarajan, Fuzzy based sleep scheduling algorithm with machine learning
 techniques to enhance energy efficiency in wireless sensor networks, Wirel. Pers. Commun., 118
 (2021), 3025−3044. doi: 10.1007/s11277-021-08167-y.
34. J. Amirian, J. B. Hayet, J. Pettré, Social ways: Learning multi-modal distributions of pedestrian
 trajectories with gans, in Proceedings of the IEEE/CVF Conference on Computer Vision and
 Pattern Recognition Workshops, (2019).
35. A. Mohamed, K. Qian, M. Elhoseiny, C. Claudel, Social-stgcnn: A social spatio-temporal graph
 convolutional neural network for human trajectory prediction, in Proceedings of the IEEE/CVF
 Conference on Computer Vision and Pattern Recognition, (2020).

 ©2022 the Author(s), licensee AIMS Press. This is an open access
 article distributed under the terms of the Creative Commons
 Attribution License (http://creativecommons.org/licenses/by/4.0)

Mathematical Biosciences and Engineering Volume 19, Issue 2, 1496-1514.
You can also read