A Longitudinal Follow-up Study of the Doodle Den After-school Programme
←
→
Page content transcription
If your browser does not render page correctly, please read the page content below
A Longitudinal Follow-up Study of the Doodle Den After-school
Programme
Biggart, A., Sloan, S., & O'Hare, L. (2014). A Longitudinal Follow-up Study of the Doodle Den After-school
Programme. Childhood Development Initiative (CDI).

Document Version:
Publisher's PDF, also known as Version of record

Queen's University Belfast - Research Portal:
Link to publication record in Queen's University Belfast Research Portal

Publisher rights
© 2014 Childhood Development Initiative & The Authors
You are free to share, copy, distribute and transmit the content of this work under the following conditions:
· Attribution: you must attribute to the work by citing the author and publisher, but not in a manner that suggests that they endorse
you or your use of the work;
· Non-commercial: you may not use this work for commercial purposes; and
· No derivative works: you may not alter, transform or build upon this work.
Any of the above conditions can be waived if you get permission from the copyright holder
General rights
Copyright for the publications made accessible via the Queen's University Belfast Research Portal is retained by the author(s) and / or other
copyright owners and it is a condition of accessing these publications that users recognise and abide by the legal requirements associated
with these rights.

Take down policy
The Research Portal is Queen's institutional repository that provides access to Queen's research output. Every effort has been made to
ensure that content in the Research Portal does not infringe any person's rights, or applicable UK laws. If you discover content in the
Research Portal that you believe breaches copyright or violates any law, please contact openaccess@qub.ac.uk.

Download date:07. Jun. 2022
A Longitudinal Follow-up Study
of the Doodle Den After-school
         Programme
A Longitudinal Follow-up Study
of the Doodle Den After-school Programme
Childhood Development Initiative
2014The authors of this report are: Andy Biggart, Seaneen Sloan and Liam O’Hare of the Centre for Effective Education, Queen’s University Belfast Additional contributors The following members of the Research Team also made significant contributions to the research upon which this report is based: Kelly Gaw, Pamela Jardine, Karen Kerr and Joanne O’Keeffe. How to cite this report Any citation of this report should use the following reference: Biggart, A., Sloan S. and O’Hare, L. (2014) A Longitudinal Follow-up Study of the Doodle Den After-school Programme. Dublin: Childhood Development Initiative (CDI). Copyright © Childhood Development Initiative, 2014 Tallaght West Childhood Development Initiative Ltd. St. Mark’s Family and Youth Centre Cookstown Lane Fettercairn Tallaght Dublin 24 Tel: +353 (0)1 494 0030 Fax: +353 (0)1 462 7329 E-mail: info@twcdi.ie Web: www.twcdi.ie Published by Childhood Development Initiative, Dublin ISBN: 978-0-9928763-3-3 Disclaimer While every care is taken to ensure that this Guide is as up-to-date and accurate as possible, no responsibility can be taken by the Childhood Development Initiative for any errors or omissions contained herein. Furthermore, responsibility for any loss, damage or distress resulting from adherence to any advice, suggestions or recommendations made available through this Guide, howsoever caused, is equally disclaimed by the Childhood Development Initiative m. All text, images, graphics, and other materials in this Guide are subject to copyright and other intellectual property rights of the Childhood Development Initiative, unless otherwise stated. You are free to share, copy, distribute and transmit the content of this work under the following conditions: · Attribution: you must attribute to the work by citing the author and publisher, but not in a manner that suggests that they endorse you or your use of the work; · Non-commercial: you may not use this work for commercial purposes; and · No derivative works: you may not alter, transform or build upon this work. Any of the above conditions can be waived if you get permission from the copyright holder.
Contents

Introduction                                                  1

Background                                                    2
      The Doodle Den After-School Programme                   2
      The randomised controlled trial of Doodle Den           2
      The long-term effectiveness of literacy interventions   3

Aims of the Doodle Den follow-up study                        3

Methods                                                       4
      Design                                                  4
      Sample                                                  4
      Outcomes and measures                                   4
      Procedure                                               5
      Analysis                                                5
      Ethics                                                  6

Results                                                       7
      Response rate                                           7
      Sample characteristics                                  8
      Balance of groups at follow-up                          8
      Main analysis                                           10
      Exploratory analysis                                    12

Discussion                                                    13

References                                                    16

Appendix: Regression models for analyses                      18
Introduction
More than a quarter of children in Ireland are living in, or are at risk of, poverty. Children who grow up in poverty are more
likely to leave school early and without having attained the fundamental literacy skills. Literacy is widely acknowledged as
the foundation for academic attainment across the curriculum. Children who fall behind in literacy at an early stage are
likely to remain behind (Brooks, 2007; Francis et al, 1996; Juel, 1988), with consequences for later academic achievement
and access to employment.
The importance placed on the development of children’s literacy has resulted in the design of numerous interventions for
children in the form of programmes, products, practices and policies. Whilst many of these initiatives take place within
normal school hours, after-school programmes are increasingly being adapted from their traditional role, which focused
on childcare and recreational activities, to one focused on academic achievement. Some interventions have been shown to
improve literacy outcomes in the short term; however, questions remain about whether these improvements are sustained
over the longer term. With this in mind, the current report outlines the results of a follow-up to a randomised controlled
trial evaluation of an after-school literacy programme (Doodle Den).
1Background
The Doodle Den After-school Programme
Doodle Den is a newly developed, manualised, after-school literacy programme designed for the Childhood Development
Initiative (CDI) as part of a wider strategy to improve the health, safety and learning of children, and increasing their
sense of belonging to the community. Doodle Den aims to promote young children’s literacy using a balanced literacy
framework, with a focus on writing, text comprehension, phonics, sight vocabulary, independent reading and fluency
(O’Rourke et al, 2008). It operates throughout the normal school year, over a 36-week period, and is aimed at 5 and 6
year-olds (Senior Infants class) identified as ‘struggling beginning’ readers. It involves the children attending 3 after-school
sessions per week, each lasting 1½ hours. Sessions are structured to begin with a snack and sign-in routine, followed by
various aspects of literacy teaching and activities, concluding with a ‘fun’ element (e.g. art, physical education, drama or
music) based on a literacy theme. In addition, there are 3 family and 6 parental sessions, in which parents are encouraged
to participate in a range of activities, to include sitting in on child sessions and shared reading activities designed to
promote wider family literacy. The programme is delivered by 2 different service providers operating across 7 different
settings, and involves children from a total of 8 schools within the Tallaght West area of Dublin, with a target group of 15
children in each after-school setting.
The randomised controlled trial of Doodle Den
As part of the implementation process, a rigorous evaluation of the effects of the programme was completed by the
Centre for Effective Education at Queen’s University Belfast, which included a randomised controlled trial (RCT) looking at
the effects of the programme on child outcomes over 3 successive year cohorts, combined with a process evaluation that
investigated implementation.
The RCT was designed as an individually randomised trial within multiple schools utilising a 3-year rolling cohort design. In
other words, it followed 3 different cohorts of children over 3 successive school years. The evaluation began in September
of the 2008/09 school year and the final cohort was post-tested in June 2011. Children completed a pre-test before the
start of the programme in September and the post-test assessment at the end of the programme in the following June. In
total, 464 children completed both pre- and post-test measures and were included in analysis (intervention group, n=237;
control group, n=227).
The results (Biggart et al, 2013) show that after controlling for pre-test scores, children who took part in the Doodle Den
Programme scored significantly more positively than control group children on measures of ability (effect sizes ranging
from d=+0.17 to 0.30), as well as teachers’ assessment of the children’s literacy ability (d=+0.28). There was evidence to
suggest that the programme also had a positive impact on improving concentration and reducing problem behaviours
in school (d=-0.18), increasing family library activity (d=+0.39) and the child’s reading at home (d=+0.25). All the other
measures, such as school attendance, were moving in a positive direction, although failed to reach the required level of
statistical significance.
Exploratory analyses suggest that the programme appears to benefit boys as much as girls and that there are only minor
differences in terms of year cohort, family affluence/poverty and ethnicity. The boys in particular who attended Doodle
Den appeared to derive some additional benefits in relation to their concentration and behaviour in school lessons, as
evidenced through the teachers’ reports.
The process evaluation shows that Doodle Den received a positive response from a wide variety of stakeholders, including
facilitators, school principals, parents and the children themselves through a Client Satisfaction survey. When asked about
the benefits of Doodle Den for the children involved, the majority of respondents were very positive and responses focused
on improvements in children’s literacy skills, knowledge and abilities, as well as the children’s enjoyment, improved social
skills, enhanced confidence and noticeable differences between those who went to Doodle Den compared to those who
did not.
2A Longitudinal Follow-up Study of the Doodle Den After-school Programme
The long-term effectiveness of literacy interventions
Few rigorous evaluations of literacy interventions with a comparable control group have included a follow-up to determine
whether benefits are sustained over the longer term. Existing follow-up studies of literacy interventions have had mixed
results. For example, randomised controlled trials of Reading Recovery, an early intervention programme for struggling
beginning readers, have shown positive effects on reading outcomes measured directly after the intervention (Pinnell,
1998; Pinnell et al, 1994; Schwartz, 2005), but not at 2 years post-intervention (Baenen et al, 1997, Sylva and Hurry
2007). Other evaluations, which have not used an RCT methodology, have noted enduring benefits of Reading Recovery
(e.g. Schmitt and Gregory, 2007;) while others have noted enduring benefits of a range of programmes over many years
(Borman et al, 2007; Ross et al, 1995; Slavin et al, 1993; Schmitt and Gregory, 2007). Little is known about the durability
of gains resulting from after-school literacy programmes.
Aim of the Doodle Den follow-up study
The aim of the Doodle Den follow-up study was to determine whether the positive effects of Doodle Den on child literacy
and behaviour noted in the original randomised controlled trial would be sustained at 2 and 3-years after the end of the
programme.
3Methods
Design
The original evaluation was designed as an individually randomised controlled trial, utilising a 3-year rolling cohort design.
The follow-up study presented in this report was designed to assess child literacy outcomes at 2 and 3 years following the
end of the programme. Due to the nature of the rolling cohort design of the original evaluation, the 2-year and 3-year
follow-up data collection occurred at different time points for the 3 cohorts (see Table 1). The 2-year follow-up consisted
of Cohorts 2 and 3 (tested in Autumn 2012 and Autumn 2013, respectively). The 3-year follow-up consisted of Cohorts 1
and 2 (again, tested in Autumn 2012 and Autumn 2013, respectively).
Table 1: Cohorts and year of testing
Cohort 2012 2013
Cohort 1 3-year follow-up
Cohort 2 2-year follow-up 3-year follow-up
Cohort 3 2-year follow-up
Sample
The sample consisted of children who took part in the original evaluation of Doodle Den and had consent to take part in
the follow-up at each time point. The maximum possible sample for the
2-year follow-up was 417 (207 intervention and 210 control) and 409 (205 intervention and 204 control) at the 3-year
follow-up.
Outcomes and measures
Follow-up measures
Outcomes collected directly from the children were reading vocabulary and reading comprehension. Teacher-rated
outcomes were general child literacy ability and ADHD-related behaviours in class (see Table 2).
Pre-test measures
Pre-test measures (collected during the original study period, 2008-2011) included in analyses were child overall literacy
ability, as measured by the Drumcondra Primary Reading Test (Sheil, 2008), teacher-rated child literacy ability and teacher-
rated child concentration and behaviour in class (measured using the same tools as described in Table 2).
Other variables
Dichotomous variables were created for child gender (boy=1, girl=0) and intervention category (Doodle Den=1, Control=0).
The number of Doodle Den sessions attended by children was included as an indicator of dosage (mean=70.19±15.58 for
the 2-year follow up sample, and mean=61.67±22.60 for the 3-year follow-up sample).
4Methods
Table 2: Description of outcome variable, measurement and reliability
Reliability
Outcomes Description of measure and administration
(Cronbach’s alpha)
Child-report
Reading vocabulary Drumcondra Reading Test (adapted); timed assessment; children 0.84 at 2-year follow-
given 12 minutes to correctly answer 20 items. up and 0.86 at 3-year
follow-up
Reading Drumcondra Reading Test (adapted); timed assessment; children 0.81 at 2-year follow-
comprehension given 23 minutes to read 2 passages and correctly answer 20 up and 0.83 at 3-year
comprehension questions. follow-up
Reading attitude Adapted version of a nationally developed test in Ireland (Eivers 0.77 at both 2-year and
et al, 2005); assesses level of agreement with 15 multiple choice 3-year follow-ups
items reflecting attitudes to reading and writing; response on a
5-point scale.
Teacher-report
General literacy ability Adapted from the National Assessment of English ERC 2004; 8 0.97 at 2-year follow-
items rating child literacy ability on a 5-point scale (1=very poor; up and 0.96 at 3-year
5=excellent). follow-up
Concentration and Attention Deficit Hyperactivity Disorder rating scale (DuPaul, 1991); 0.94 at 2-year follow-
behaviour in class 14 items describing child behaviour rated on 4-point scale (0=not up and 0.93 at 3-year
at all; 3=very much). follow-up
Procedure
Children from intervention and control groups within the same school class were tested together during a regular school
day. The child testing was conducted in a group setting and was overseen by members of the research team and/or trained
fieldworkers. All fieldworkers were Garda-vetted and given training in the assessment procedures prior to undertaking
testing. Teachers’ child assessments were undertaken by the child’s regular class teacher and involved completing a
questionnaire for each child in their class who had parental consent to take part in the follow-up study. Fieldworkers were
blinded as to group allocation and given that the children had moved from Junior Infant to Senior Infant school and were
being taught by different teachers, it was highly unlikely that the teachers were aware of group allocation.
Analysis
Data were entered into the Statistical Package for the Social Sciences (SPSS) for preparation and preliminary exploration,
prior to analysis using Stata v 13. Data preparation involved checking the proportion of missing data and ensuring that
minimum and maximum values were within the appropriate range. Descriptive statistics were generated for each variable
and the distribution checked. The validity of measures was assessed using factor analysis and internal consistency was
estimated using Cronbach’s alpha.
The main statistical analysis was conducted using linear regression, controlling for pre-test score. Further analysis was
conducted using additional demographic data (gender and ethnicity) as additional covariates to improve the precision of
the models. Adjusted post-test means were calculated for each of the groups, controlling for pre-test scores. Effect sizes
were then calculated as standardised mean differences (Hedge’s g). In the original report, effect sizes are reported as
Cohen’s d; Hedge’s g is a similar measure, but makes adjustments for small samples. There was no clustering adjustment
made to coefficients since participants had been randomised at the individual level. Interactions between the intervention
group, child gender and pre-test ability scores were investigated by inserting an interaction term into the regression
models.
5A Longitudinal Follow-up Study of the Doodle Den After-school Programme
Ethics
Ethical approval for the follow-up study was granted by the School of Education Ethics Committee at Queen’s University
Belfast. Initially it was planned to target all children who had been involved in any of the previous cohorts of the original
Doodle Den evaluation; however, as explicit consent had not been sought for a follow-up study, fresh consent was
required from parents. Consent was obtained at three levels: (1) the schools consented to take part in the follow-up,
facilitate recruitment by sending information and consent forms home to parents, and allow testing of the children during
school hours; (2) parents consented for their child to take part by returning a signed consent form, and (3) children were
asked for their verbal assent to take part on the day of testing. Consent was gained at each time point.
As children had moved schools since the original evaluation, potential data protection concerns were raised by CDI about
providing the new schools with consent letters for only those children who had been involved in the original study. It was
therefore agreed that parental consent would have to be sought from the parents of all the children in the same year
group in which the children in the original study were likely to be located. Once parental consents were received from
all the children in a year group, those who had been in the original study were identified and tested in the schools. This,
however, prohibited further follow-up from those in the original study who failed to return a consent form.
6Results
Response rate
At the 2-year follow-up, 170 children received parental consent and were tested, out of a possible 417 (36% response
rate). At the 3-year follow-up, 114 children received parental consent and were tested, out of a possible 409 (28%
response rate). Teacher questionnaires were requested for all children who had consent to participate and a total of 112
questionnaires were returned at the 2-year follow-up and 69 questionnaires at the 3-year follow-up.
There were some differences between children tested and not tested (see Table 3). Boys were less likely to be tested at the
2-year follow-up and children from an ethnic minority background were less likely to be tested at both time points. At both
time points, children tested had significantly higher rates of attendance at school during the intervention year, compared
to those not tested. In addition, those tested at follow-up had significantly greater scores for overall literacy at pre- and
post-test, as well as higher teacher ratings of literacy ability at post-test, compared to those not tested.
Table 3: Comparison between those tested and not tested at the 2-year and 3-year follow-up
2-year follow-up 3-year follow-up
Tested Not tested Tested Not tested
p p
n (%) n (%) n (%) n (%)
Group
Control 74 (52) 235 (44) 0.048 53 (46) 256 (51) 0.41
Intervention 95 (48) 213 (56) 61 (54) 248 (49)
Gender
Boys 76 (45) 42 (56) 0.02 56 (49) 267 (53) 0.41
Girls 94 (55) 54 (44) 58 (51) 233 (47)
Ethnic minority
Yes 24 (15) 110 (28) 0.001 17 (15) 117 (26) 0.01
No 137 (85) 288 (72) 97 (85) 328 (74)
Tested Not tested Tested Not tested
p p
mean (sd) mean (sd) mean (sd) mean (sd)
Child age (in months) at pre-test 66.86 (4.38) 67.89 (4.36) 0.01 67.91 (4.19) 67.49 (4.44) 0.38
Attendance at school 93.71 (5.13) 90.81 (7.38)A Longitudinal Follow-up Study of the Doodle Den After-school Programme
2-year follow-up 3-year follow-up
Tested Not tested Tested Not tested
p p
n (%) n (%) n (%) n (%)
Post-test measures
Overall literacy ability 0.75 (0.22) 0.67 (0.24) 0.001 0.73 (0.23) 0.68 (0.24) 0.06
Reading attitude 4.36 (0.72) 4.34 (0.70) 0.84 4.39 (0.61) 4.34 (0.73) 0.60
Literacy ability (teacher-rated) 3.43 (0.97) 3.10 (0.05)Results
Table 4: Comparison of the control and intervention groups at 2-year and 3-year follow-ups
2-year follow-up 3-year follow-up
Control Intervention Control Intervention
p p
n (%) n (%) n (%) n (%)
Cohort 0.90 0.57
Cohort 1 n/a n/a 19 (17) 25 (22)
Cohort 2 40 (24) 51 (30) 34 (30) 36 (32)
Cohort 3 34 (20) 45 (27) n/a n/a
Total 74 (43) 96 (57) 53 (47) 61 (54)
Gender 0.78 0.46
Boys 34 (20) 42 (25) 28 (25) 28 (25)
Girls 40 (23) 54 (32) 25 (22) 33 (57)
Total 74 (43) 96 (57) 53 (47) 61 (53)
Ethnic minority 0.34 0.63
Yes 8 (5) 16 (10) 7 (6) 10 (9)
No 60 (37) 77 (48) 46 (40) 51 (45)
Total 68 (42) 93 (58) 53 (46) 61 (54)
Control Intervention Control Intervention
p p
mean (sd) mean (sd) mean (sd) mean (sd)
Attendance at school 94.11 (4.60) 93.42 (5.50) 0.39 92.86 (7.32) 92.92 (4.78) 0.96
Child age (in months) at pre-test 66.96 (4.31) 66.78 (4.46) 0.80 69.04 (4.38) 67.80 (4.06) 0.77
Pre-test measures
Overall literacy ability 0.39 (0.18) 0.39 (0.17) 0.98 0.39 (0.20) 0.42 (0.17) 0.46
Reading attitude 4.43 (0.80) 4.45 (0.71) 0.89 4.35 (0.90) 4.36 (0.82) 0.97
Literacy ability (teacher-rated) 2.88 (0.79) 2.87 (0.74) 0.93 2.90 (0.92) 2.84 (0.60) 0.74
Concentration and behaviour in
0.70 (0.77) 0.70 (0.71) 0.99 0.82 (0.77) 0.65 (0.61) 0.22
class (teacher-rated)
9A Longitudinal Follow-up Study of the Doodle Den After-school Programme
Main analysis
Table 5 shows a summary of the results of regression analyses for child- and teacher-reported outcomes from the original
post-test conducted at the end of the Doodle Den Programme. Based on the regression model, the results of the predicted
means and standard deviations are reported, alongside the effect sizes, their confidence intervals and statistical significance
(p). The full regression models for all of the analyses are reported in the Appendix.
This highlights that children who participated in Doodle Den scored significantly higher than the control group children
in their overall measured literacy ability (g=+0.17), as well as the separate teacher rating of the children’s literacy ability
(g=+0.28). The overall measure of the children’s literacy contained a number of sub-scales (word recognition, sentence
structure and word choice), all of which were statistically significant. The results highlighted a further significant effect for
the children who attended Doodle Den, with a reduction in teacher-reported concentration and behaviour problems in
regular class (g=-0.18).
Table 5: Adjusted post-test means, effect size (Hedge’s g) and significance at immediate post-test
Outcomes Adjusted post-test mean (SD)
Effect size (g)
Control Intervention p
[95% CI]
0.17
Overall literacy ability 0.67 (0.25) 0.71 (0.23) 0.049
[0.00, 0.35]
0.17
Word recognition 0.75 (0.24) 0.79 (0.23) 0.043
[0.00, 0.36]
0.30
Sentence structure 0.54 (0.34) 0.61 (0.32) 0.020
[0.13, 0.48]
0.26
Word choice 0.57 (0.31) 0.65 (0.31) 0.012
[0.08, 0.43]
General literacy ability 0.28
3.03 (1.04) 3.32 (1.02)Results
Table 6: Adjusted post-test means, effect size (Hedge’s g) and significance at 2-year follow-up
Outcomes Adjusted post-test mean (SD)
Effect size (g)
Control Intervention p
[95% CI]
0.13
Overall literacy ability 0.64 (0.18) 0.66 (0.17) 0.50
[-0.25, 0.52]
0.14
Reading vocabulary 0.66 (0.18) 0.69 (0.17) 0.51
[-0.28, 0.57]
0.14
Reading comprehension 0.61 (0.18) 0.63 (0.17) 0.50
[-0.28, 0.56]
General literacy ability -0.09
3.64 (0.88) 3.56 (0.81) 0.74
(teacher-rated) [-0.64, 0.46]
Concentration and behaviour in -0.003
0.35 (0.79) 0.35 (0.75) 0.98
class (teacher-rated)* [-0.24, 0.23]
* For all measures, a positive score equals a more positive outcome with the exception of ‘Concentration and behaviour in class’,
where a negative score indicates an improvement in reported problem behaviours.
At the 3-year follow-up, the previous positive effect sizes noted above on the child’s overall literacy have completely
disappeared on the child measures. Positive, but non-significant effect sizes were now found in relation to teacher-
reported literacy ability and concentration and behaviour in class. With further attrition among the sample in general, and
in particularly the low rate of return of teacher questionnaires, we can be even less confident in these results from Year
3, especially due to the wide variations and fluctuations in effect sizes across measures compared to the Year 2 results.
Table 7: Adjusted post-test means, effect size (Hedge’s g) and significance at 2-year follow-up
Outcomes Adjusted post-test mean (SD)
Effect size (g)
Control Intervention p
[95% CI]
-0.18
Overall literacy ability 0.77 (0.18) 0.73 (0.17) 0.40
[-0.59, 0.23]
-0.25
Reading vocabulary 0.81 (0.18) 0.77 (0.17) 0.27
[-0.70, 0.19]
-0.11
Reading comprehension 0.72 (0.18) 0.70 (0.17) 0.64
[-0.55, 0.33]
General literacy ability 0.52
3.17 (0.17) 3.61 (0.81) 0.11
(teacher-rated) [-0.10, 1.15]
Concentration and behaviour in -0.16
0.51 (0.79) 0.38 (0.75) 0.27
class (teacher-rated)* [-0.45, 0.13]
* For all measures, a positive score equals a more positive outcome with the exception of ‘Concentration and behaviour in class’,
where a negative score indicates an improvement in reported problem behaviours.
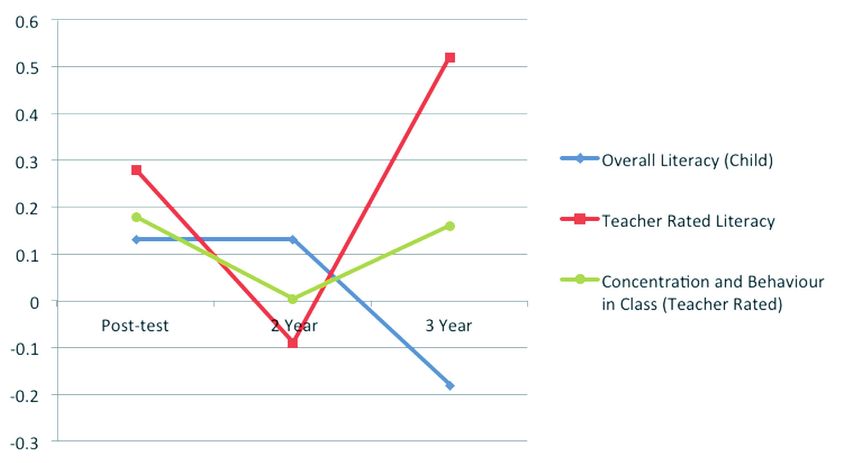
The main differences in effect size at immediate post-test, 2-year and 3-year follow-up are summarised in Figure 1.
11A Longitudinal Follow-up Study of the Doodle Den After-school Programme
Figure 1: Effect size differences between control and intervention group at each time point
Note: All effect sizes, including concentration and behaviour in regular school class are reported in a positive direction.
Exploratory analysis
Exploratory analysis sought to determine whether the outcomes were different according to child gender and number
of Doodle Den sessions attended. Analyses also explored whether differing abilities at pre-test were associated with
outcomes at the 2-year and 3-year follow-ups.
Gender
While there was a significant difference between boys and girls for one outcome measure (concentration and behaviour in
class – reflecting better behaviour and concentration among girls), there was no evidence to suggest that this interacted
with the intervention group (see Appendix, Tables A3 and A4).
Number of sessions attended
Weekly attendance registers were kept by programme facilitators to record the number of Doodle Den sessions attended.
The average number of sessions attended was 63 (ranging from 0-88). Whilst the number of Doodle Den sessions attended
was a predictor of a number of positive outcomes at immediate post-test, the number of Doodle Den sessions attended
did not predict any of the outcome measures at the 2-year and 3-year follow-ups (see Appendix, Tables A5 and A6).
Pre-test literacy ability
While the original pre-test scores remained a significant predictor of outcomes at Year 2 and Year 3, there were no
significant interactions between intervention group and pre-test literacy ability for any of the outcomes (see Appendix,
Tables A7 and A8).
12Discussion
This piece of research has explored the long-term effectiveness of the Doodle Den Programme and provided a longitudinal
assessment of differences between intervention and control groups. The original design of the Doodle Den trial was based
on a large sample and evaluated through a rigorous research design involving a randomised trial. This demonstrated the
positive benefits of attending the Doodle Den Programme, with improvements in the children’s overall reading ability
and concentration and behaviour in class at the end of the programme. While the effect sizes were small to moderate,
these findings were based on standardised assessments rather than on specific measures closely aligned to programme
content (which tend to produce larger effects). While many after-school programmes have not been shown to be effective
in raising academic achievement, the Doodle Den evaluation contributed to a number of prior tentative findings from
previous reviews of successful after-school programme characteristics. These included the young age of the children; their
family background; a high-level programme attendance; well-qualified staff with a strong focus on staff development and
a well-structured programme aligned to the normal school day (Beckett et al, 2009; Fashola, 2002; Lauer et al, 2006;
Scott-Little et al, 2002). The current study aimed to assess whether these initial improvements were sustained at 2- and
3-year follow-ups.
The rigour of the original design, however, is somewhat diminished in the longitudinal study by two key factors – the high
level of attrition and the overall reduction in sample size. With the level of attrition experienced in the follow-up study,
there is a need to be cautious about drawing strong conclusions from the findings. While the samples at follow-up were
well matched in characteristics between the control and intervention group, there were differences between those who
were tested and those lost to the follow-up. Attrition is always a problem with longitudinal designs, although it was a
particular challenge in the current study due to the data protection requirements that had to be followed that prevented
directly targeting children in the original trial. Children had also moved from Junior to Senior Infant school, meaning a
change in teaching personnel with whom to liaise, and consent had to be sought from whole year groups in each of the
school years prior to testing those students with consent and identified as belonging to the original trial.
The sizes of the finally achieved samples obtained were under-powered to detect statistically significant effects of the
magnitude found in the original study. In other words, statistically, where differences were found, we cannot rule out that
any of the observed effects are simply down to chance or some form of attrition bias. The strength of evidence declines
between the immediate post-test and the Year 2 and Year 3 follow-up. The child assessments are also considered more
reliable than the teacher assessments since the latter are proxy measures and were collected separately from the child
testing. As a result, they may also not correspond exactly with the children who were tested in the follow-up.
With these caveats in mind, and considering the overall picture presented from the standardised measures of children’s
literacy, we can tentatively conclude that some of the effects appear to have been maintained up to 2 years after the
programme, but these have completely faded by Year 3. The overall pattern points to one of a gradual decline after
the initial Doodle Den intervention, which would lend support to CDI’s intention to explore the impact of a booster
programme. It would also indicate that the booster programme should operate shortly after the original programme, not
more than 2 years after its completion.
While these results are disappointing, dissipating effects are not surprising given that they have been frequently found
among the limited number of studies that have examined the long-term effects of early reading interventions and which
highlight the need for ongoing intervention to maintain the positive effects of beginning reading programmes (Shanahan
and Barr, 1995). One of the most widely tested reading interventions is Reading Recovery and while some studies have
reported enduring, but reduced benefits over time (e.g. Schmitt and Gregory, 2007), others have concluded that the
positive effects at immediate post-test have declined over time and have completely faded by around about 3 years after
the programme (Hurry and Sylva, 2007; Baenen et al, 1997). The same factors that caused children to become struggling
readers in the first place (whether these were related to the individual’s cognitive abilities or other factors related to the
home or school environment) may continue to exert an influence on further literacy development. The only constant
predictor of the outcomes at the two follow-up points in the current study was the child’s original pre-test score when
they were 5 years old.
13A Longitudinal Follow-up Study of the Doodle Den After-school Programme
A further difficulty associated with the small sample size of the current study is an inability to get a clear indication of what
literacy skills decline quickest and which are most perseverant. The existing evidenced-based literature suggests that meta-
cognitive programmes offer some of the greatest gains per unit cost across a wide range of domains, including vocabulary
and comprehension (Higgins et al, 2004; EEF, 2014, see http://educationendowmentfoundation.org.uk/toolkit/meta-
cognitive-and-self-regulation-strategies/). Therefore, it is recommended that any booster programme consider potential
opportunities for the development of thinking skills alongside that of reading and vocabulary development. In addition,
there is now a substantial literature supporting the use of cooperative learning in the development of both peer-to-peer
relationships and achievement, particularly among pupils in the middle elementary grades (Slavin et al, 2009). One such
approach is paired reading, which involves different ability pairs (same age or cross-age) working together in the role of
tutor and tutee; this has been shown to be particularly effective through use of cross-age tutors (Tymms, et al, 2011).
Lastly, in terms of implementation of after-school programmes, the evidence suggests that they should follow SAFE
practice guidelines (Durlak et al, 2010) in that they should be sequenced (building skills gradually), active (through group
work and assignment-based work), focused (on particular skill development demonstrated by a well-trained providers/
teachers) and explicit (in that the learning objectives of the booster programme are highlighted in a clear programme logic
model).
If a booster programme is planned, a range of other factors seem pertinent. Firstly, the context of programme delivery
needs consideration – in other words, whether it is delivered within the normal school day or delivered as another after-
school programme or as a summer scheme. A second issue is whether to develop a bespoke booster programme based on
the current evidence base of effective approaches or to source an ‘off the peg’ programme with evidence of effectiveness.
The Doodle Den Programme was based on a newly developed balanced literacy framework as recommended for general
literacy teaching, yet other more narrowly focused approaches also have evidence of effectiveness. Furthermore, it cannot
be assumed that all children who previously attended Doodle Den require a booster to maintain effects and therefore
one approach would be to screen and identify those most in need. There is some existing evidence to suggest that those
in greatest need may make the greatest gains through after-school programmes (Scott-Little et al, 2002). Screening
can also assist in matching those most suitable to an intended intervention or alternatively approaches can be utilised
which capitalise on different capabilities through, for example, the use of different ability matched pairs in peer-tutoring
interventions. The duration of any booster intervention is another factor to consider. Doodle Den ran three times a week
across a whole school year. However, the evidence suggests that longer programmes do not necessarily have the greatest
impact and programmes of shorter duration have also been shown to be effective (Brooks, 2007). It may therefore be
desirable to deliver short, intensive boosters at several different time points following the original intervention in order to
try and maintain, or enhance, short-term programme effects.
As already highlighted, there are a number of limitations to the current research. Attrition was higher than predicted, with
only 36% and 28% of children in the original trial tested post-intervention at 2 years and 3 years, respectively. Stringent
data protection procedures precluded the research team from directly targeting and recruiting the original trial participants
for the follow-up study and this had a detrimental impact on follow-up. While there were no significant differences
between either samples at follow-up, the level of attrition has reduced the power of the study to detect significant effects
and also reduces confidence that the follow-up samples are comparable to the initial sample. There is an indication that
those tested in the follow-up samples were among the higher performing children in the original study compared to those
lost to follow-up. It is therefore unclear whether those with the greatest needs see a declining (or indeed a maintaining)
effect from the intervention.
In conclusion, the findings presented from the current longitudinal study should not undermine the demonstrable
effectiveness of the Doodle Den Programme, which was evaluated on a large sample and showed positive effects on
standardised literacy tests at the end of the programme. CDI also has to be commended on its strong commitment to
adopting an evidence-based approach. There is a general lack of evidence from randomised trials in relation to whether
early intervention literacy strategies lead to sustained long-term gains, particularly in the case of after-school programmes,
without further intervention and this study contributes to addressing this gap. While rigorous evaluations of reading
programmes that use a matched control group are rare, especially in the Ireland and the UK, follow-up studies of this kind
are even rarer. Overall, while indicative positive effects were apparent on the child measures at the Year 2 follow-up, with
the level of sample size attrition we cannot conclude with great confidence that these represent the true enduring effects
14Discussion
of the programme. We have less confidence in the Year 3 results, with further attrition and wide fluctuations in effect sizes.
Taking a wider view of the evidence in this study, and the limited literature, it can be concluded overall that the impact
of the intervention appears to fade with time and has had a limited long-term effect. This suggests a need to boost or
‘recharge’ gains in literacy at regular intervals throughout the child’s early stages of education through additional support.
15References
Baenen, N., Bernholc, A., Dulaney, C. and Banks, K. (1997) ‘Reading Recovery: Long-term progress after three cohorts’, Journal
of Education for Students Placed at Risk, Vol. 2, pp. 161-81.
Beckett, M., Borman, G., Capizzano, J., Parsley, D., Ross, S., Schirm, A. and Taylor, J. (2009) Structuring out-of-school time
to improve academic achievement: A practice guide (NCEE #2009-012). Washington, DC: National Center for Education
Evaluation and Regional Assistance, Institute of Education Sciences, US Department of Education. Available at: http://ies.
ed.gov/ncee/wwc/publications/practiceguides
Biggart, A., Kerr, K., O’Hare, L. and Connolly, P. (2013) ‘A randomised control trial evaluation of a literacy after-school
programme for struggling beginning readers’, International Journal of Educational Research, Vol. 62, pp. 129-40.
Borman, G.D., Slavin, R.E., Cheung, A., Chamberlin, A., Madden, N.A. and Chambers, B. (2007) ‘Final reading outcomes of the
national randomized field trial of Success for All’, American Educational Research Journal, Vol. 2, No. 3, pp. 701-31.
Brooks, G. (2007) What works with children with literacy difficulties? The effectiveness of interventions. Slough: National
Foundation for Educational Research.
DuPaul, G.J. (1991) ‘Parent and Teacher Ratings of ADHD Symptoms: Psychometric properties in a community-based sample’,
Journal of Clinical Child & Adolescent Psychology, Vol. 20, No. 3, pp. 245-53.
Durlak, J.A., Weissberg, R.P. and Pachan, M. (2010) A’ meta-analysis of after-school programs that seek to promote personal
and social skills in children and adolescents’, American Journal of Community Psychology, Vol. 45, pp. 294-309.
EEF. See Education Endowment Foundation website: http://educationendowmentfoundation.org.uk/toolkit/meta-cognitive-
and-self-regulation-strategies/
Eivers, E., Shiel, G., Perkins, R. and Cosgrove, J. (2005) The 2004 National Assessment of English Reading. Dublin: Educational
Research Centre.
Fashola, O.S. (2002) Building Effective Afterschool Programs. Thousand Oaks, CA: Corwin Press Inc.
Francis, D.J., Shaywitz, S.E., Stuebing, K.K., Shaywitz, B.A. and Fletcher, J.M. (1996) ‘Developmental lag versus deficit models of
reading disability: A longitudinal, individual growth curves analysis’, Journal of Educational Psychology, Vol. 88, pp. 3-17.
Higgins, S., Baumfield, V., Lin, M., Moseley, D., Butterworth, M., Downey, G., Gregson, M., Oberski, I., Rockett, M. and
Thacker, D. (2004) ‘Thinking skills approaches to effective teaching and learning: what is the evidence for impact on learners’.
In: Research Evidence in Education Library. London: EPPI-Centre, Social Science Research Unit, Institute of Education, University
of London.
Hurry, J. and Sylva, K. (2007) ‘Long-term outcomes of early reading intervention’, Journal of Research in Reading, Vol. 30, No.
3, pp. 227-48.
Juel, C. (1988) ‘Learning to read and write: A longitudinal study of 54 children from first through fourth grades’, Journal of
Educational Psychology, Vol. 80, No. 4, pp. 437-47.
Lauer, P., Akiba, M., Wilkerson, S., Apthorp, H., Snow, D. and Martin-Glenn, M. (2006) ‘Out-of-school time programmes: A
meta-analysis of effects for at-risk students’, Review of Educational Research, Vol. 76, No. 2, pp. 275-313.
O’Rourke, M., Kennedy, E. and Axford, N. (2008) Doodle Den Programme Manual. Dublin: Childhood Development Initiative.
Pinnell, G.S. (1998) Success of at-risk children in a program that combines writing and reading, Technical Report No. 417.
Urban-Champaign: Centre for the Study of Reading, University of Illinois.
Pinnell, G.S., Lyons, C.A., DeFord, D.E., Bryk, A.S. and Seltzer, M. (1994) ‘Comparing instructional models for the literacy
education of high-risk first graders’, Reading Research Quarterly, Vol. 29, No. 1, pp. 8-39.
Ross, S.M., Smith, L.J. and Casey, J. (1995) Final Report: 1994-95 Success for All program in Fort Wayne, Indiana. Memphis:
Center for Research in Educational Policy, University of Memphis.
Sheil, G. (2008) Drumcondra Reading Tests. Personal communication.
Schmitt, M.C. and Gregory, A.E. (2007) ‘The impact of an early literacy intervention: Where are the children now?’, Literacy
Teaching and Learning, Vol. 10, No. 1, pp. 1-20.
Schwartz, R.M. (2005) ‘Literacy learning of at-risk first-grade students in the Reading Recovery early intervention’, Journal of
Educational Psychology, Vol. 97, No. 2, pp. 257-67.
Scott-Little, C., Hamann, M.S. and Jurs, S.G. (2002) ‘Evaluations of After-School Programs: A Meta-Evaluation of
Methodologies and Narrative Synthesis of Findings’, American Journal of Evaluation, Vol. 23, No. 4, pp. 387-419.
16References
Slavin, R.E., Madden, N.A., Dolan, L.J. and Wasik, B.A. (1993) Success for all in the Baltimore City Public Schools: Year 6
Report. Baltimore, MD: Center for Research on Effective Schooling for Disadvantaged Students, Johns Hopkins University.
Slavin, R.E., Lake, C., Davis, S. and Madden, N. (2009) Effective Programs for Struggling Readers: A Best Evidence Synthesis.
Baltimore, MD: Center for Research and Reform in Education (CRRE), Johns Hopkins University.
Shanahan, T. and Barr, R. (1995) ‘A Synthesis of Research on Reading Recovery’, Reading Research Quarterly, Vol. 30, pp. 958-
96.
Tymms, P., Merrell, C., Thurston, A., Andor, J., Topping, K. and Miller, D. (2011) ‘Improving attainment across a whole district:
School reform through peer tutoring in a randomized controlled trial’, School Effectiveness and School Improvement, Vol. 22,
No. 3, pp. 265-89.
17Appendix: Regression models for analyses
Table A1: Regression coefficients (standard errors in parentheses) estimating the effects of Doodle Den at the
2-year follow-up
Reading Reading General literacy Concentration
vocabulary comprehension ability and behaviour
Model 1
Intervention 0.04 (0.04) 0.04 (0.04) -0.03 (0.23) -0.03 (0.09)
Pre-test score 0.47 (0.11)* 0.40 (0.11)* 0.38 (0.16)* 0.28 (0.07)*
Constant 0.65 (0.03) 0.60 (0.03) 3.61 (0.17) 0.36 (0.07)
Adjusted R2 0.13 0.09 0.05 0.12
N 134 134 73 104
Model 2
Intervention 0.02 (0.04) 0.02 (0.04) -0.08 (0.23) -0.002 (0.09)
Pre-test score 0.44 (0.11)* 0.41 (0.11)* 0.40 (0.17)* 0.26 (0.07)*
Gender -0.004 (0.04) -0.03 (0.04) 0.18 (0.24) 0.19 (0.09)*
Ethnicity 0.001 (0.05) -0.09 (0.05) 0.04 (0.34) -0.04 (0.16)
Constant 0.66 (0.03) 0.61 (0.03) 3.64 (0.18) 0.35 (0.07)
Adjusted R2 0.09 0.10 0.05 0.14
N 129 130 71 102
* pAppendix
Table A2: Regression coefficients (standard errors in parentheses) estimating the effects of Doodle Den at the
2-year follow-up
Reading Reading General literacy Concentration
vocabulary comprehension ability and behaviour
Model 1
Intervention -0.04 (0.04) -0.02 (0.04) 0.36 (0.25) -0.12 (0.11)
Pre-test score 0.26 (0.11)* 0.34 (0.11)* 0.55 (0.15)* 0.37 (0.08)*
Constant 0.79 (0.03) 0.73 (0.03) 3.22 (0.19) 0.49 (0.08)
Adjusted R2 0.05 0.08 0.24 0.27
N 94 94 43 61
Model 2
Intervention -0.04 (0.04) -0.02 (0.04) 0.44 (0.27) -0.13 (0.11)
Pre-test score 0.27 (0.11)* 0.32 (0.11)* 0.57 (0.15)* 0.37 (0.08)*
Gender -0.04 (0.04) -0.05 (0.04) 0.19 (0.27) 0.07 (0.12)*
Ethnicity 0.04 (0.06) -0.09 (0.06) -0.14 (0.32) 0.18 (0.15)
Constant 0.81 (0.03) 0.72 (0.03) 3.17 (0.19) 0.51 (0.08)
Adjusted R2 0.04 0.09 0.22 0.27
N 94 94 43 61
* pA Longitudinal Follow-up Study of the Doodle Den After-school Programme
Table A4: Regression coefficients (standard errors in parentheses) estimating the effects of Gender on
outcomes at the 3-year follow-up
Reading Reading General literacy Concentration
vocabulary comprehension ability and behaviour
Intervention -0.07(0.05) -0.94(0.05) 0.26(0.39) -0.14(0.15)
Pre-test score 0.25(0.11)* 0.33(0.10)* 0.54(0.15)* 0.37(0.08)*
Gender -0.08(0.06) -0.06(0.06) 0.03(0.40) 0.00(0.17)
Group* Gender 0.06(0.08) 0.05(0.08) 0.33(0.54) 0.07(0.23)
Constant 0.76(0.06) 0.64(0.06) 1.68(0.60) 0.20(0.13)
Adjusted R2 0.05 0.07 0.22 0.25
N 94 94 43 61
* pAppendix
Table A7: Regression coefficients (standard errors in parentheses) estimating the effects of pre-test literacy
ability on outcomes at the 2-year follow-up
Reading Reading General literacy Concentration
vocabulary comprehension ability and behaviour
Intervention 0.04 (0.04) 0.04 (0.04) -0.06 (0.17) -0.09 (0.09)
Pre-test score 0.56 (0.16)* 0.40 (0.16)* 2.97 (0.71)* 0.03 (0.37)
Group* Literacy ability at pre-test -0.18 (0.21) 0.01 (0.22) 0.75 (1.07) -0.56 (0.56)
Constant 0.44 (0.07) 0.46 (0.07) 2.31 (0.31) 0.32 (0.16)
Adjusted R2 0.12 0.08 0.28 -0.003
N 134 134 94 94
* pThe Childhood Development Initiative St. Mark’s Youth and Family Centre Cookstown Lane Fettercairn Tallaght, Dublin 24 Tel: (01) 494 0030 Fax: (01) 462 7329 E-mail: info@twcdi.ie Web: www.twcdi.ie / www.doodleden.ie Twitter: @twcdi
You can also read