A dereliction of fuel duty: Europeʼs €9 billion gi to Putin and the rich
←
→
Page content transcription
If your browser does not render page correctly, please read the page content below
A dereliction of fuel duty: Europe’s
 €9 billion gift to Putin and the rich
 Why cutting fuel duty increases oil dependence and funnels
 benefits to the very richest. We need a tax on Russian oil.

 22 March 2022
Summary
 Russia’s invasion of Ukraine has pushed fuel prices to recent highs. To appease drivers at the pump,
 half of EU Member States (14 of 27) have reacted by cutting fuel taxes.

 While this policy approach has a simplistic appeal, it also generates perverse environmental
 incentives and inequitable social outcomes as the rich use eight times more fuel than the poor and
 oil companies will adjust their prices to take a share of the tax cut.

 It is also an extremely expensive approach, already totalling nearly €9 billion in Member State
 commitments – an amount that may continue to rise if more Member States announce similar
 measures or if the temporary reductions are prolonged.

 We call on EU Member States to:
 ● Reverse the excise duty cuts, and at the very least declare that the cuts will not be renewed.
 ● Introduce a tariff on Russian oil imports. This could generate up to €27 billion in revenues.
 ● Design income support measures (e.g. consumption cheques, reduced labour taxes) focused
 on low and middle class families that do not incentivise oil use and car driving.
 ● Support citizens' efforts to reduce fuel use by cutting public transport fares, making
 homeworking a right, and reviewing speed limits (e.g. limiting truck speed to 80km/h).
 ● Coordinate decisions on national fuel taxes to prevent a race to the bottom.

 These recommendations provide a more equitable distribution of financial benefits by helping the
 poor as much as the rich and a more just means of public financing by taxing Russian oil imports.
 These recommendations would also avoid the perverse environmental and health impacts that
 arise from subsidising fuel and would move us closer towards a Europe free of Russian oil and free
 from fossil fuels altogether.

 A briefing by 1

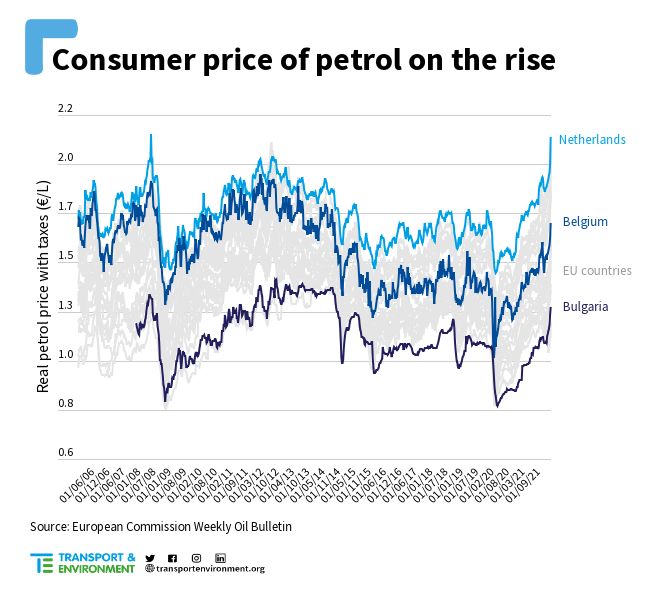
1. Russian oil dependence has created a fuel crisis
Since late 2021, strong oil demand, as economic activity has returned to pre-Covid levels, and weak
supply, as OPEC held back production, have combined to push oil prices steadily higher. With Russia’s
invasion of Ukraine further disrupting the oil market, prices have surged to recent highs. This disruption is
particularly acute in the EU where one out of every four barrels of imported crude oil is sourced from
Russia and some EU regions directly connected to Russian crude oil by pipeline.1

In real terms, prices at the pump in most EU countries are at their highest level since 2012 when oil
reached $130 a barrel (in real terms) (Figure 1). Drivers in Bulgaria are now paying €1.45 per litre of petrol,
while in the Netherlands drivers are paying in excess of €2.34 per litre. Combined with record high gas and
electricity prices, Europeans are feeling the pinch of high energy prices and European Member States are
seeking means to reduce the financial burden on their citizens.

 Figure 1: Real price of petrol in EU Member States

At the same time, European Member States are responding to the war in Ukraine by looking for ways to
reduce oil consumption, particularly from Russia. Decreasing oil use is no longer just an environmental
and climate objective, it is also an urgent moral imperative. On 11 March, the European Council issued the
Versailles declaration, calling on the European Commission to develop a plan to phase out EU

1
 Transport & Environment (2022) How Russian oil flows to Europe. Available:
https://www.transportenvironment.org/discover/how-russian-oil-flows-to-europe/

 A briefing by 2

dependency on Russian oil.2 T&E will be releasing a study on the most effective ways to end oil
dependence from a transport perspective, in the short, medium and long term.

2. Governments have opted for cuts to fuel excise duty
Despite these dual challenges of high prices at the pump and an urgent need to reduce oil dependence,
many EU Member States have focused on the former to the detriment of the latter. According to
Transport & Environment’s fuel duty tracker, 14 of the 27 Member States have temporarily reduced fuel
taxes to ease financial hardship on drivers and road transport companies (illustrated in Figure 2 and
detailed in Appendix A).

In most cases, Member States have focused their policy reforms on fuel excise duty, but there are also
variations on this model such as reimbursing fuel to a maximum amount (Portugal) and cuts to VAT on
fuel (Poland). There are also differences in the magnitude (-0.054 €/L in Hungary to -0.2 €/L in Ireland) and
duration (1 month in Italy and Slovenia to 12 months in Malta) of the policy change.

 Figure 2: Changes to fuel excise duty since November 2021

While discussions continue in several Member States about whether or not to cut fuel excise duties, some
Member States have stated that they have no intention to follow this approach. The reasons for this
opposition include environmental concerns, budget pressures, market uncertainty, and market

2
 European Council (2022). The Versailles declaration, 10 and 11 March 2022. Retrieved from:
https://www.consilium.europa.eu/en/press/press-releases/2022/03/11/the-versailles-declaration-10-11-03-202
2/

 A briefing by 3
behaviour. For example, Prime Minister Ingrida Simonyte explained that Lithuania will not introduce such
measures because of dynamics in the oil market:
 “it is not clear whether Russian oil will be sanctioned, whether oil from other suppliers will
 come to the market, and how much of that oil will come. Therefore, as long as there is
 uncertainty, all discretionary measures of the government, such as excise duty cuts, will, I
 am very sorry to say, end up in the pockets of the supply chains. The government will
 certainly not make such proposals for the time being.”3

For Member States still discussing potential cuts to fuel excise duty, as well as those who have already
implemented measures and will need to decide on their future, the serious environmental, social equity,
and fiscal ramifications should be considered and evaluated against alternative measures.

3. Why reducing fuel excise duty is bad policy
The rapid decision by some Member States to cut fuel excise duties is not without consequence. Seven
separate consequences that concern the environment, social equity, and public finances are considered
here.

3.1 Reducing fuel excise duty increases fuel use to the detriment of people,
planet, and oil dependence
The price of road transport fuel does not cover the amount of damage caused. This is made clear in
countless economic studies. In a recent assessment the IMF concluded that unpriced damages amount to
an effective subsidy of $5.9 trillion (€5.33 trillion) in annual subsidies for fossil fuels - approximately 7% of
world GDP.4 Reducing fuel excise duties is a step in the wrong direction.

3.2 Reducing fuel excise duty is badly targeted and expensive
Reducing fuel excise duty is an extremely broad policy, with the impact felt across a large section of the
population (to varying degrees).5 As such, while the financial cost at the level of one household or one
vehicle may seem reasonable, the total cost quickly adds up. Already the measures announced by
Member States total nearly €9 billion (see Appendix A and B) – an amount that may rise in the coming
weeks and months if more Member States make cuts or if the temporary reductions are prolonged. The
cuts in fuel taxation deny government budgets of an important source of revenue. This has to be paid
either through new taxes, spending cuts, or increased borrowing. Either way, taxpayers will end up paying
for the measure.

3
 Delfi EN (2022). Simonyte: no plans to cut excise duty on fuel yet. Retrieved from:
https://www.delfi.lt/en/business/simonyte-no-plans-to-cut-excise-duty-on-fuel-yet.d?id=89663195
4
 IMF. (2022). Size of fossil fuel subsidies. Retrieved from:
https://www.imf.org/en/Topics/climate-change/energy-subsidies
5
 This feature of fuel use is one of the key reasons why economists support broad-based taxes like fuel excise
duties to raise government revenues (e.g. optimal taxation theory).

 A briefing by 4
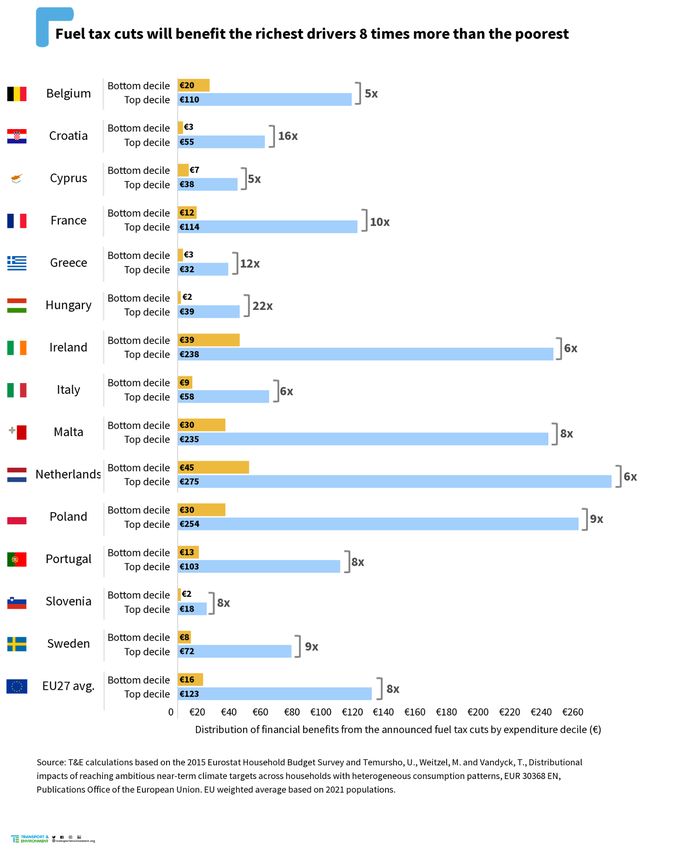
3.3 Reducing fuel excise duty provides the greatest benefits to the richest
Who uses transport fuels, and therefore who benefits from cuts to fuel excise duty, is heavily skewed by
income, with the richest 10 percent of the population spending eight times more on fuel than the poorest
10 percent (see Appendix C for the ratio for each Member State).6,7 The reasons for this are straightforward
as the richest people drive the furthest distances, often alone, and with the largest vehicles.

 Figure 3: Fuel expenditure is eight times higher in the top decile compared to the bottom

Another reason for this much higher fuel use among higher expenditure households is that many rich
drivers have their fuel expenses completely covered. Indeed, the millions of company cars currently on
Europe’s roads are overwhelmingly driven by better off segments of society. This further highlights the
bizarre social argument of reductions in fuel excise duty. Not only does this measure provide the largest

6
 T&E calculations based on the 2015 Eurostat Household Budget Survey and Temursho, U., Weitzel, M. and
Vandyck, T., Distributional impacts of reaching ambitious near-term climate targets across households with
heterogeneous consumption patterns, EUR 30368 EN, Publications Office of the European Union. EU weighted
average based on 2021 populations.
7
 A difference of 8 times between the top and bottom deciles aligns with other studies on the topic: 13.8 times
in the Netherlands (CE Delft. (2017). Rechtvaardigheid en inkomenseffecten van het klimaatbeleid), 7.3 times
in Hungary (Clean Air Action Group. (2022). Price cap on petrol prices mainly benefit the rich), 4.3 times in
Germany (Held, B. (2019). Einkomensspezifische energie-verbrauche privater haushalte), and 8 times in the UK
(ONS (2019). Detailed household expenditure by disposable income decile group.

 A briefing by 5
tax break to the very richest, in many of cases (around 10% of households in Belgium8), it provides a tax
break straight to companies with the most generous salary perks.

Given the size of the cuts to fuel taxes (Appendix A and B) and the distribution of fuel expenditure
(Appendix C), our calculations on Member State policies reveal a heavily skewed distribution of financial
benefits towards the top expenditure decile (Figure 4). The difference in financial benefits between top
and bottom expenditure deciles ranges from 5 times in Belgium and Cyprus to 22 times in Hungary.

 Figure 4: Distribution of financial benefits between the top and bottom expenditure deciles

8
 Radio 1. (2022). De "winnaars" van de energiecrisis: mensen met bedrijfswagen en onbeperkte tankkaart
"winnen tot 100 euro per maand". Retrieved from: https://tinyurl.com/2p8mzxnw

 A briefing by 6
3.4 Reducing fuel excise duty does nothing to benefit non-drivers
At the other end of the distribution, the lowest expenditure decile uses very little transport fuel (an EU
average of €162 in annual expenditure per adult) and therefore benefits very little from cuts to fuel excise
duty. Many households in this expenditure decile use public transport and active transportation such as
walking and cycling. These transport modes are generally encouraged by governments as they reduce
pollution and congestion and in the case of active transport have direct health benefits. Cuts to fuel
excise duty work in the exact opposite direction by incentivising fuel use and private driving. The fact that
non-drivers receive no financial benefit – despite the fact that any tax cut ultimately comes from the
shared collective budget – is yet another example of the perverse social outcomes generated by a cut to
fuel excise duty.

3.5 Reducing fuel excise duty will be compensated for by oil companies
raising their prices
It should not be assumed that the financial benefits of a lower price at the pump accrue to consumers
(whether rich or poor) as oil companies will likely respond by adjusting their prices. Research suggests
that the pass-through rate of a cost reduction from producers to consumers is always partial and depends
on the competitiveness of the particular market. Analysing the decision of the German government to
reduce the VAT on fuel in 2020 as an economic stimulus measure, economic researchers at
Ludwig-Maximilians-University Munich found a pass-through rate of 83 per cent for diesel, 61 percent for
E10, and 40 percent for E5.9 This diffusion of financial benefits to oil companies reveals that a cut to fuel
excise duty is an extremely inefficient means of social support to vulnerable people.

3.6 Reducing fuel excise duty creates a race to the bottom and fuel tourism
When one Member State makes a cut to fuel excise duty it creates pressure on other Member States to
follow suit and participate in a race to the bottom. In the EU, the bottom is currently being redefined as
Hungary has lowered its fuel excise duties even further below the EU minimum as specified in the
European Tax Directive (see Figure 2) - this is illegal. This pressure on other Member States happens
indirectly as heavy fuel users in one Member State are likely to ask for the same benefits seen in another
Member State, and directly through cross-border fuel tourism where drivers in one Member State
purchase their fuel in another country and thus distort tax flows towards the country with the lowest
taxation.

In Hungary, where fuel excise duties are the lowest in the EU, fuel tourism has even led the government to
implement differential tariffs depending on whether trucks have a Hungarian licence plate.10 This policy

9
 Montag, F., et al. (2020). Are temporary value-added tax reductions passed on to consumers? Evidence from
Germany’s stimulus. Retrieved from: https://arxiv.org/pdf/2008.08511.pdf
10
 Reuters. (2022). Hungary tightens eligibility for subsidised fuel amid surge in demand. Retrieved from:
https://www.reuters.com/business/energy/hungary-tightens-eligibility-subsidised-fuel-amid-surge-demand-2
022-03-10/

 A briefing by 7
approach, which discriminates against other EU Member States, risks eroding basic principles in how EU
taxation should be applied.

3.7 Reducing fuel excise duty creates an expectation of continuation,
worsening all other consequences
All 14 cases of Member States cutting fuel taxes were announced with a limited policy duration (varying
between 1 and 12 months). There is no guarantee, however, that fuel taxes will return to their old rates at
the end of the period. Drivers receiving this financial benefit may develop an expectation that the reduced
rate will continue and it may become extremely difficult at a political level to return to the old rate even if
the government planned to do so.

This is not merely a theoretical concern but is exactly what has happened in the UK over the past decade.
Under the UK’s fuel duty escalator, the rate of fuel duty is scheduled to rise over time to raise revenue,
combat the harms of motoring, and keep track with inflation. However since 2010, the fuel duty escalator
has been cancelled or delayed thirteen times (Figure 5) to override previous commitments and keep fuel
duty at the current level (and falling over time when accounting for inflation).

Source: IFS. (2020). Budget 2020.
 Figure 5: Forecasted and actual rates of UK fuel duty

4. Alternative support measures
Not only are cuts in fuel excise duty harmful for the plethora of reasons previously outlined, these
expensive cuts also crowd out other potential measures from government budgets. The money has to
come from somewhere; there is always an opportunity cost.

 A briefing by 8
The group of low-income households that rely on a car to get to work is relatively small (estimated as 5%
of drivers in Germany11 and 9% of drivers in France12) but difficult to specifically identify and target
through support measures. The middle income group is much larger and equally hard to target as it
combines salaried staff, independents ,and small and medium-sized enterprises.

A cut to fuel excise duty solves the targeting problem by distributing benefits to all fuel users regardless of
their income. This approach ensures that the target group is covered but with the drawback that much of
the benefit is allocated to high-income households. As section 3.3 covers, this drawback is made even
more extreme by the fact that high-income households spend eight times as much on fuel as low-income
households. Alternatively, support measures targeted at low-income households solve the targeting
problem by distributing benefits to all low-income households regardless of their fuel use. This approach
ensures that the target group is covered but with the drawback that some of the benefit is allocated to
low-fuel use households.

There is a clear asymmetric risk when contrasting these two approaches (Figure 6). A mistargeting that
unintentionally distributes financial benefits to low-income households who do not own a car or use
much fuel is a much less significant problem than a mistargetting where a greater share of the benefits
falls outside the low-income target group and generates perverse environmental incentives. It is a
debatable point whether distributing financial benefits to low-income households who do not use much
fuel should even be considered a drawback.

Figure 6: Illustration of mistargeting as a result of low-income transfers or fuel tax cuts

11
 Mattioli, G. (2017). ‘Forced Car Ownership’ in the UK and Germany: Socio-Spatial Patterns and Potential
Economic Stress Impacts. Social Inclusion 5 (4), pp. 147-160.
12
 Mattioli, G. (2018). Possession "forcée" de l'automobile et stress économique en France. Retrieved from:
https://www.slideshare.net/teresproject/possession-force-de-lautomobile-et-stress-conomique-en-france

 A briefing by 9
How exactly income support measures are designed will vary depending on the social assistance
programmes present in each Member State. As demonstrated by the response to the Covid-19 pandemic,
these measures are generally straightforward to administer and can be quickly implemented. Economists
often advocate direct payments (e.g. a cost-of-living bonus13) as the most efficient form of support, but
alternatives could include incorporating a cash bonus into the balance of individual tax payments,
reductions to income taxes, uprating benefits with inflation, boosting social welfare payments, or any
combination of these measures.

The comment element of these support measures is that an individual has more money to spend. This
contrasts with measures that reduce the cost of a specific item (like fuel), but absent distributional issues
the net effect is the same. However, given the highly skewed distribution of fuel expenditure across the
population (Section 3.3), a greater share of the population would be better off under an income support
measure (whether targeted at low incomes or evenly distributed) than under a cut to fuel taxes.

5. Short-term measures to reduce fuel expenditure
In contrast to the numerous policies to cut fuel taxes, Member States have shied away from introducing
policies that shield drivers from oil price spikes in a more structural manner. There is an important social
dimension to this policy focus because while cuts to fuel excise duty offer some relief at the pump, the
impact is extremely limited. In France, for example, the reduction in fuel excise duty of 0.15 €/L is
equivalent to a -8.5% price reduction at the pump. In this case, and all others, the vast majority of the cost
to consumers still remains. A more effective form of relief to consumers’ pocketbooks is to reduce the
entire cost of fuel by reducing the use of fuel altogether.

Cut public transport fares
Public transport has much lower fuel use per passenger than cars and is predominantly used by lower
income households. Already some EU Member States (e.g. Belgium) have acted to freeze rail fares, but
countries outside of the EU have been even more ambitious with this measure, such as New Zealand
which has cut public transport fees in half.14 As this reduction in fees is funded by the government, there
should be no change in overall revenue (and therefore quality of service). At a time when public transport
use is still below pre-Covid levels, support from the government in the form of reduced fares would act as
a stimulus to a sector that is in need and deserving of our support for environmental and social reasons.

Make homeworking a right
As governments remove the last remaining Covid-19 restrictions, many employers are calling their staff
back to the office. Commuter roads are filling up once more and many employees are back to devoting a

13
 Bhattacharya, A. (2022). A ‘cost-of-living bonus’? The case for direct cash payments to help squeezed households.
Social Market Foundation. Retrieved from: www.smf.co.uk/commentary_podcasts/a-cost-of-living-bonus/
14
 McClure, T. (2022). New Zealand halves public transport fares as petrol prices soar amid Russia-Ukraine war.
The Guardian. Retrieved from:
https://www.theguardian.com/world/2022/mar/14/new-zealand-halves-public-transport-fares-as-petrol-prices
-soar-amid-russia-ukraine-war

 A briefing by 10
portion of their income to transport fuel. Yet two years of working remotely has proven that it does not
have to be this way. Governments could mandate the right to home working where possible (e.g. set by
sector) for 2-3 days a week. Reducing fuel use could go hand in hand with empowering employees with a
new right.

Other measures
Many other measures have been put forward. In its 16 March publication, “A 10-point plan to cut oil use”,
the International Energy Agency proposed ten measures that could cut world fuel use by 2.7 million
barrels of oil a day (a reduction of 6%).15 They called on governments to:
 1. Reduce speed limits on highways by at least 10 km/h
 2. Make public transport cheaper, incentivise micro-mobility, walking and cycling
 3. Car-free Sundays in large cities
 4. Work from home up to three days a week where possible
 5. Alternate private car use in large cities
 6. Urge car sharing and practices that decrease fuel use
 7. Promote efficient use of freight trucks and goods delivery
 8. Prefer high-speed and night trains to planes where possible
 9. Avoid business travel when alternatives exist
 10. Hasten adoption of electric and more efficient vehicles.

Some of these measures come with a very low price tag and can be implemented immediately. Other
measures represent a net loss to public finances and should be compensated for through new revenues -
a similar issue for fuel tax cuts.

6. Who should pay?
Oil prices started rising because of the tight oil market and OPEC+ output restrictions, but the recent
spike was caused by markets anticipating an embargo on Russian oil exports. Despite the US, Canada,
and the UK banning Russian oil, and signs of traders shunning Russian oil entirely, it is now clear that
major importers such as the EU, China, and India are not planning to impose an embargo on imports.

EU decision makers fear the cost of an oil embargo to its economy and social fabric would far outweigh
the pain it would cause the Putin regime, especially since a harsh oil embargo would push oil prices up
even higher. As an alternative to an oil embargo, a tariff on Russian oil imports to the EU would inflict
huge pain on the Russian oil industry whilst actually generating revenues for the EU to fund alternative
support measures (section 4) and measures to reduce fuel expenditure (section 5).

How would the tariff work?
Russia has a strong position in the EU oil market - 25% of total imports - because of its proximity as well
as the existence of the so-called Friendship or Druzhba pipeline, making it easier and cheaper for Russia
15
 IEA (2022). A 10-point plan to cut oil use. Retrieved from:
https://www.iea.org/reports/a-10-point-plan-to-cut-oil-use

 A briefing by 11
to supply oil to the large EU market compared to other oil exporting countries which mainly supply oil by
tanker.

A tariff on Russian oil would make its product more expensive compared to other producers. Absent price
reductions equivalent to the tariff, Russian oil would rapidly lose market share. Given the importance of
the EU market and the orientation of Russia’s oil export logistics towards the EU, it would be difficult for
Russia to shift a significant portion of its sales to other importing countries - at least in the short run.
Russian oil companies would therefore have no choice but to bear most, if not all, of the tariff incidence
and lower their prices. In summary, the EU would continue to be fully supplied with oil, it would raise
substantial revenues on the tariff and Russia would see its oil revenues reduced by the same amount. In
the long run, especially if oil demand in the EU is effectively reduced (section 5) Russia would be forced to
redirect its oil exports towards other large oil importers such as China and India. This would force Russian
oil companies to compete for market share in an established market whilst paying higher transport costs,
reducing the profits it can make from its oil.

If 2022 imports of Russian crude oil, petrol and diesel were equivalent to those in 2019, a $25/bbl tariff -
the amount Urals oil is being undercut right now because traders are avoiding it16 - would redirect the
profits to the tune of €27 billion from Russia, and instead be available to European governments. Tariffs
could be introduced gradually and increase to much higher levels with some economists proposing a 90%
tariff.17 This revenue could be used to help fund the alternative support measures (section 4) and
measures to reduce fuel expenditure (section 5). While EU Member States collect the tariff on imports,
75% is passed on to the EU and is a part of its own resources budget.18

In Table 1, we show how the revenues could be allocated by Member State. As the law states, 25% of the
revenues would go directly to the country of import. We assume that the remaining revenues are
allocated based on total road fuel consumption in 2019.

Table 1: Annual revenues by EU Member State from a tariff on Russian oil products
 Member Tariff revenues Member Tariff revenue Member Tariff revenue
 State [25%; total]19 State [25%; total] State [25%; total]
 (M€) (M€) (M€)

Austria 9; 640 France 447; 3669 Malta 3; 22
Belgium 505; 1158 Germany 1384; 5491 Netherlands 753; 1572

16
 Urals-Brent price difference, accessed 18 March 2022. Neste. Retrieved from:
https://www.neste.com/investors/market-data/urals-brent-price-difference#00478330
17
 Hausmann, R. (2022). The case for a punitive tax on Russian oil. Project Syndicate. Retrieved from:
www.project-syndicate.org/commentary/case-for-punitive-tax-on-russian-oil-by-ricardo-hausmann-2022-02
18
 Customs duties. European Commission. Accessed March 2022. Retrieved from:
https://ec.europa.eu/info/strategy/eu-budget/long-term-eu-budget/2021-2027/revenue/own-resources/custo
ms-duties_en
19
 25% refers to the amount that member states would keep directly from a tariff, at 25% of oil product value;
Total is the remaining 75% of the total EU tariff collection, redistributed by road fuel consumption.

 A briefing by 12
Bulgaria 210; 421 Greece 118; 525 Poland 883; 2404
Croatia 11; 173 Hungary 225; 599 Portugal 52; 481
Cyprus 0; 55 Ireland 19; 329 Romania 172; 653
Czechia 165; 654 Italy 404; 2744 Slovakia 223; 415
Denmark 44; 363 Latvia 6; 85 Slovenia 31; 175
Estonia 12; 75 Lithuania 335; 487 Spain 89; 2313
Finland 483; 792 Luxembourg 0; 162 Sweden 205; 701

7. Conclusion
Russia’s invasion of Ukraine has pushed fuel prices to recent highs. To appease drivers at the pump, half
of EU Member States (14 of 27) have reacted by cutting fuel taxes.

While this policy approach has a simplistic appeal, it also generates perverse environmental incentives
and inequitable social outcomes as the rich use eight times more fuel than the poor and oil companies
will adjust their prices to take a share of the tax cut. It is also an extremely expensive approach, already
totalling nearly €9 billion in Member State commitments – an amount that may continue to rise if more
Member States announce similar measures or if the temporary reductions are prolonged.

At the most fundamental level, while the rise in fuel prices sends a strong signal on Russian oil
dependence, cuts to fuel excise duty offset this signal and therefore completely undermine the objective
to reduce oil dependence as agreed by EU Member States in the Versailles declaration earlier this month.
It is also important to bear in mind the longer-term structural changes that are needed to bring about a
zero-carbon and oil-independent economy. At the very least, policy measures that provide short-term
relief should not undermine this longer-term need.

We call on EU Member States to:
 ● Reverse the excise duty cuts, and at the very least declare that the cuts will not be renewed.
 ● Introduce a tariff on Russian oil imports. This could generate up to €27 billion in revenues.
 ● Design income support measures (e.g. consumption cheques, reduced labour taxes) focused on
 low and middle class families that do not incentivise oil use and car driving.
 ● Support citizens' efforts to reduce fuel use by cutting public transport fares, making
 homeworking a right, and reviewing speed limits (e.g. limiting truck speed to 80km/h).
 ● Coordinate decisions on national fuel taxes to prevent a race to the bottom.

These recommendations provide a more equitable distribution of financial benefits by helping the poor
as much as the rich and a more just means of public financing by taxing Russian oil imports. These
recommendations would also avoid the perverse environmental and health impacts that arise from
subsidising fuel and would move us closer towards a Europe free of Russian oil and free from fossil fuels
altogether.

 A briefing by 13
Further information
Griffin Carpenter
Cars Analyst
Transport & Environment
griffin.carpenter@transportenvironment.org
+32 48 856 72 83

 A briefing by 14
Appendix A: Summary of Member State tax reductions
 Country Change in petrol Change in diesel Change in Duration Estimated
 duty (ct/L) duty (ct/L) VAT (%) (months) cost (€ mn)

Austria 0 0 0
Belgium -17.5 -17.5 0 3 520
Bulgaria 0 0 0
Croatia -12 -3 0 3 42
Cyprus -7 -7 0 2.5 12
Czechia 0 0 0
Denmark 0 0 0
Estonia 0 0 0
Finland 0 0 0
France -15 -15 0 4 3,018
Germany 0 0 0
Greece -5.3 -7.7 0 3 90
Hungary -5.4 -5.4 0 3 86
Ireland -20 -15 0 5.5 436
Italy -25 -25 0 1 978
Latvia 0 0 0
Lithuania 0 0 0
Luxembourg 0 0 0
Malta -19.1 -14 0 12 52
Netherlands -17.3 -11.1 0 6 1,358
Poland 0 0 15 6 1,416
Portugal -13.7 -13.4 0 3.5 334
Romania 0 0 0
Slovakia 0 0 0
Slovenia -1.8 -6 0 1 12
Spain 0 0 0
Sweden -10 -10 0 4 267
 Total cost 8,622

Source: Compilation of government announcements and news coverage since November 2021.

 A briefing by 15
Appendix B: Methodological note on T&E’s fuel duty tracker
We assume that current road transport fuel consumption is as it was in 2019; data from the EU transport
in figures Statistical pocketbook 2021.20 We adjust for inflation using Eurostat HICP figures.21 We assume
that all car fuel consumption is for private use, and thus liable to pay VAT on the price of fuel and fuel
duty. Fuel consumption from vans and heavy duty vehicles (trucks and buses) is assumed to be for
commercial use, and thus not liable to VAT payments. Details of national government plans were
generously provided by T&E’s network of members.

For the calculation of the total revenues foregone, we do not consider rebound effects from a change in
demand from price elasticities; all is ceteris paribus. We calculate the total tax paid with the VAT and fuel
excise as it was in November 202122 to the situation where a government implements a measure to reduce
fuel prices. The VAT for private use is applied to the cost of fuel without taxes and the fuel duty. For the
example of petrol consumption (assumed to be private use only), we calculate the pre- and post-policy
change earnings as follows:

 = {⎡⎢⎣(
 ⎦ ⎣ ⎦ }
 + ) · (1 + ) − ⎤⎥ − ⎡⎢( + ) · (1 + ) − ⎤⎥ · petrol

Where D = fuel excise duty (in this case for petrol), €/L; P = fuel price (in this case for petrol) without taxes
€/L; V = VAT in percentage; Cpetrol = petrol consumption in litres; subscript pre is the pre-policy rate and
subscript post is the post-policy rate. For private diesel consumption, for each member state we subtract
the total petrol use for road transport from the car equivalent consumption (approximated from UNFCCC
greenhouse gas emission splits) with the assumption that the remaining fuel consumption in cars is
diesel (ignoring LPG and CNG). We can then use the petrol tax revenue formula above, substituting
appropriate diesel duties and prices, and multiplying by Cdiesel,private. For commercial diesel, this formula
simplifies to:

 = ( )
 − · ,

20
 EU transport in figures Statistical pocketbook 2021. DG Energy. Retrieved from:
https://op.europa.eu/en/publication-detail/-/publication/14d7e768-1b50-11ec-b4fe-01aa75ed71a1
21
 Eurostat. HICP - monthly data (index). Table: prc_hicp_midx, adjusted to 2021.
22
 Weekly Oil Bulletin. European Commission. Accessed 17 March 2022. Retrieved from:
https://energy.ec.europa.eu/data-and-analysis/weekly-oil-bulletin_en

 A briefing by 16
Appendix C: Fuel use expenditure by top and bottom deciles Bottom expenditure Top expenditure decile Difference (ratio) Country decile (€) (€) Belgium 214 1,159 5 Bulgaria 18 407 23 Cyprus 310 1,697 5 Czechia 90 557 6 Denmark 140 1,473 11 Estonia 8 848 106 Finland 98 1,332 14 France 129 1,231 10 Germany 196 1,431 7 Greece 120 1,424 12 Hungary 33 731 22 Ireland 247 1,522 6 Italy 280 1,771 6 Latvia 13 898 69 Lithuania 39 820 21 Luxembourg 245 1,348 6 Netherlands 267 1,646 6 Poland 68 581 9 Romania 5 293 59 Slovakia 64 545 9 Spain 175 1,342 8 Sweden 251 2,137 9 EU27 average 164 1,268 8 Source: T&E calculations based on the 2015 Eurostat Household Budget Survey and Temursho, U., Weitzel, M. and Vandyck, T., Distributional impacts of reaching ambitious near-term climate targets across households with heterogeneous consumption patterns, EUR 30368 EN, Publications Office of the European Union. EU weighted average based on 2021 populations. Note: Austria, Croatia, Malta, Portugal, and Slovenia are not included in the Eurostat data. A briefing by 17
You can also read