2023 Budget - Port of Vancouver USA
←
→
Page content transcription
If your browser does not render page correctly, please read the page content below
2023 Budget
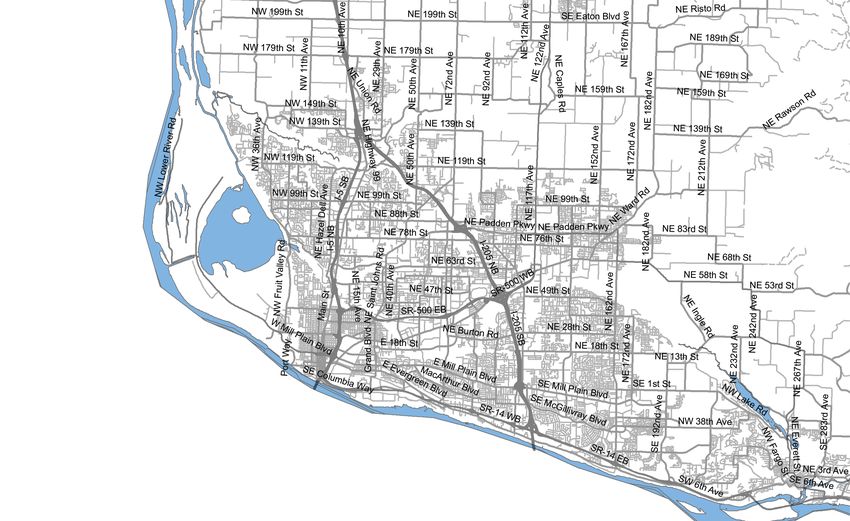
TABLE OF CONTENTS

OVERVIEW                                           Page
   Budget in Brief ………..………………………………………………..…………………………………………
                                                      1
   Commissioner Districts…………………………………………………………………….. 3

STRATEGIC PLAN
   Status of Strategic Plan Initiatives ……………………………………………………………….......
                                                              4

FINAL BUDGET
   Sources and Uses……………………………...……………………………………………………………………….
                                                   10

CAPITAL BUDGET
   Overview………………………………………………………...…………………………………………………
                                                  11
   Capital Program…………………………………………………….………………………………………………….
                                                  12

TAX LEVY ……………………………………………………………….………………………….. 13

DEBT SERVICE ……………………………………………………………..……………………..16

OTHER INFORMATION
   Glossary of Terms……………………………………………………………………………….19
BUDGET IN BRIEF
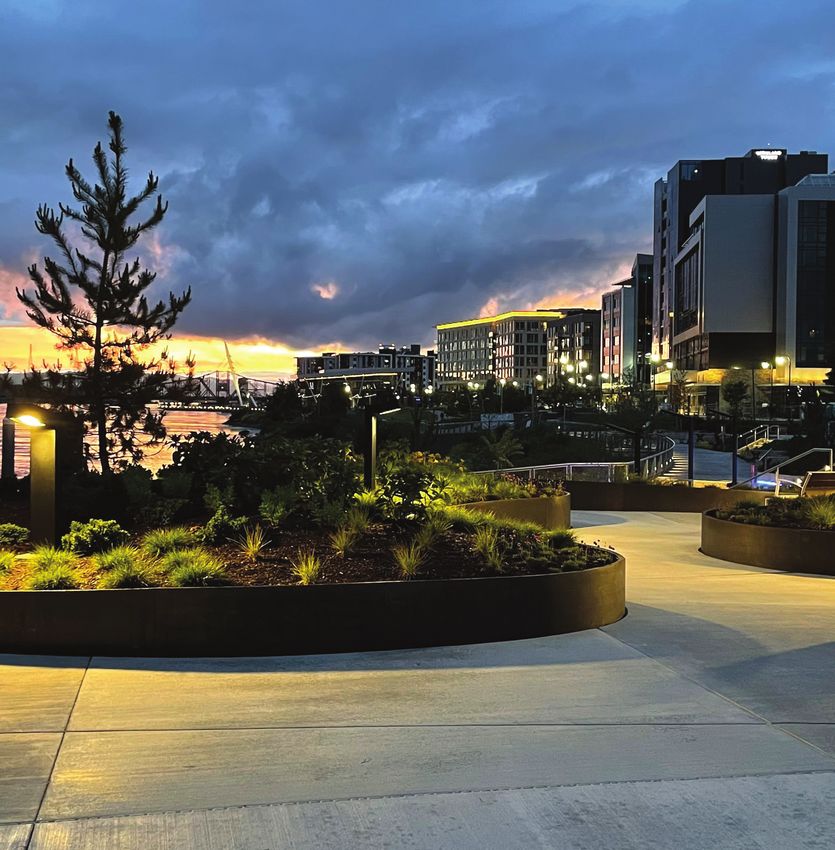
The Port of Vancouver USA is an economic engine for Southwest Washington. The port provides quality
jobs, international trade connections, a strong industrial land base and economic stability by producing
revenue for state and local services. Through the Columbia River and along efficient national rail and
road systems, the port connects our community to the global marketplace – a key factor in bringing
community prosperity to Clark County. Our budget reflects financial sustainability strategies that also
consider the need for a healthy environment and community to ensure the port remains a unique and
vibrant center of trade.
The port budgets and operates under the laws applicable to a public port district as a municipal
corporation under the provisions of Chapter 53 of the Revised Code of Washington. The port’s focus on
long-term strategies provides context for its budget and results. While the port’s current financial outlook
remains positive, the potential financial impacts of economic uncertainty and volatility in national and
global economics, growth and shifts in markets and trade patterns, considerable capital requirements for
rail infrastructure, terminal developments and continued regulatory requirements and environmental risks
remain challenging. The port also operates sustainably, using an all-inclusive approach that enhances
profitability while allowing it to operate responsibly within the larger community.
The port operates principally in two industries: terminal operations and industrial/commercial property
leases. Terminal operations involve marine-oriented operations, including dockage, cargo handling,
storage and related activities. Industrial/commercial property leases include facilities leases, industrial
activities, and storage. The annual operating and capital budgets are a forecast of expected resources
and the purposeful distribution of those resources. This forecast is developed based on historical trends
in revenue and expenses, information from customers and tenants, market projections, and key economic
and regulatory assumptions. It is also recognized that budget adjustments may be made as the port
maintains agility to take advantage of unforeseen opportunities or the need to react to unanticipated
market and economic conditions. Given the need to manage overall costs and continue investing in the
port’s key initiatives, the following issues were considered in preparing the 2023 budget:
Continued strong marketing efforts in marine and industrial markets through customer contact, with
an emphasis on the use of technology for virtual contacts and client meetings. Diversification of
business lines has been important in stabilizing operating revenues.
2023 budget volumes are estimated to be 6.68 million metric tons a 12.27% increase over 2022
budget. The increase is due to an increase in grains, autos, bulk liquids and wind, offset by a
decrease in steels.
In 2023, the Terminal 1 Waterfront project will complete the design for the new dock and begin
demolition of the existing dock structure.
Continued marketing of available properties in Centennial Industrial Park and Terminal 5.
Continue to develop Terminal 5 berth facilities to support maritime opportunities and future bulk
facilities.
Continued focus on maintaining existing public assets, including marine terminals, rail, facilities, and
equipment as a result of significant development of new infrastructure.
Debt service on Limited Tax General Obligation Bonds is $5.04 million. Revenue Bond debt service is
$5.30 million.
Assessed property values in the port district increased 17.58 percent from 2022 to 2023. The port’s
2023 certified levy is $13.05 million. The budget is based on the port taking a 1 percent increase,
utilization of 100 percent of banked capacity and new construction. The levy limit is based on the
lower of the implicit price deflator (IPD) of 6.457 percent or 1 percent per Initiative I-747.
Continue advancement of many strategies from the port’s 2018 Strategic Plan. The plan guides the
port’s activities and budget for the next decade.
The Port of Vancouver prepares budgets on the cash basis of accounting. In cash basis accounting,
revenues are recognized when they become both measurable and available to finance expenditures of
the current period, and expenditures are recorded when paid. Cash basis budgets are often used to
1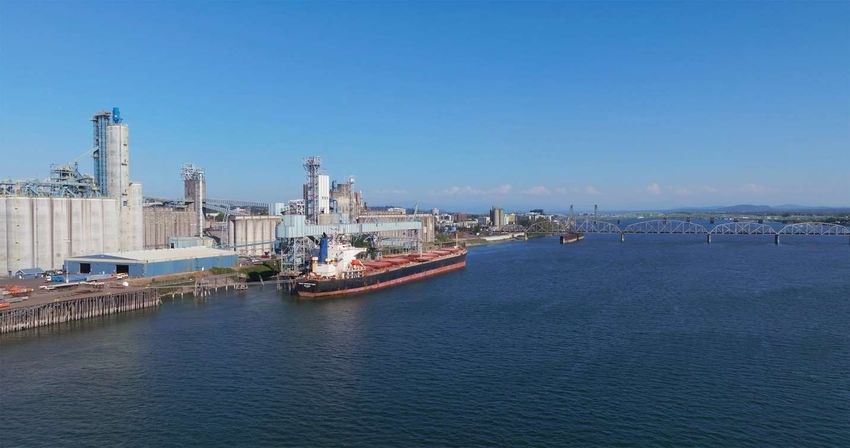
assess whether the entity has sufficient cash to fulfill regular operations and/or whether too much cash is
being left in unproductive capacities. This is different from the full accrual basis of accounting, also
referred to as the Generally Accepted Accounting Principles (GAAP) basis of accounting used for
financial statement purposes.

Revenues: The 2023 budget projects operating revenues of $49.60 million. 68 percent of projected 2023
operating revenue is from marine, terminal and security, and 32 percent from is commercial, industrial
property leases, rail, and facilities.

Non-operating revenues include property tax in the amount of $13.05 million. Property tax receipts will be
used for debt service payments on general obligation bonds, capital projects and environmental
remediation. The non-operating budget also includes $2.22 million of other contributions and grants
awarded for waterfront related projects.

Expenses: The 2023 budget projects operating expenses of $42.63 million, a slight increase over the
estimated 2022 operating expense forecast. This increase is mainly due to the increase in terminal
operating revenue and related expense. The 2023 non-operating expenses include debt service of $10.34
million and continuing costs for environmental remediation of $1.06 million.

Capital Improvement Program (CIP):              The 2023 capital budget reflects the port’s continuing
commitment to promoting regional economic activity through the investment of over $22.65 million in the
economic development, expansion, and renewal of port facilities. 34 percent of the capital budget is
allocated for Terminal Rehabilitation and Improvement Projects (TRIP). 24 percent of the capital budget is
allocated for maintaining port infrastructure and IT systems. 23 percent is allocated for waterfront projects.
The remainder of the capital budget is allocated to various environmental, facility and terminal
improvements.

Conclusion: Despite the challenging realities of today's global economy, the Port of Vancouver remains
committed to its vision and mission. The port’s leadership is confident that the plans outlined in the 2023
budget will help the port and region remain financially strong, competitive, and successful.

                                                      2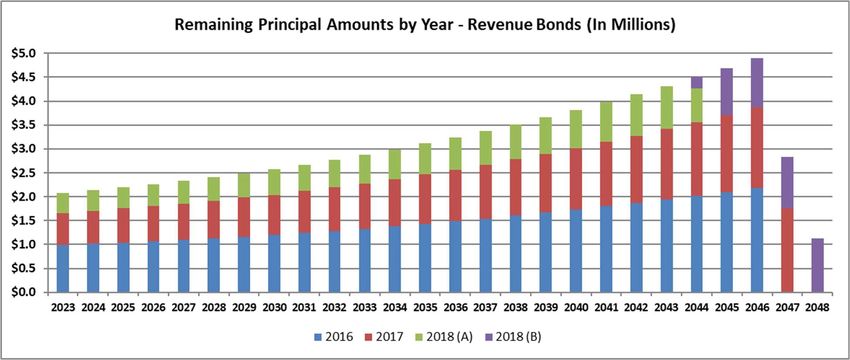
Port of Vancouver
COMMISSIONER DISTRICTS

                    District 2
                     ERIC LaBRANT

                           I–5                    I–205
                                                                 District 1
                                                                  DON ORANGE
                                                         D
                                                     BLV
                                             PLAIN
                                         RTH
                                      FOU

                                      SR–14
                                                             District 3
                                                             JACK BURKMAN

  Legend
  COMMISSIONER DISTRICTS

       District 1
       District 2
       District 3

FOR MORE INFO:
info@portvanusa.com or 360-693-3611
or visit us at portvanusa.com
                                                     3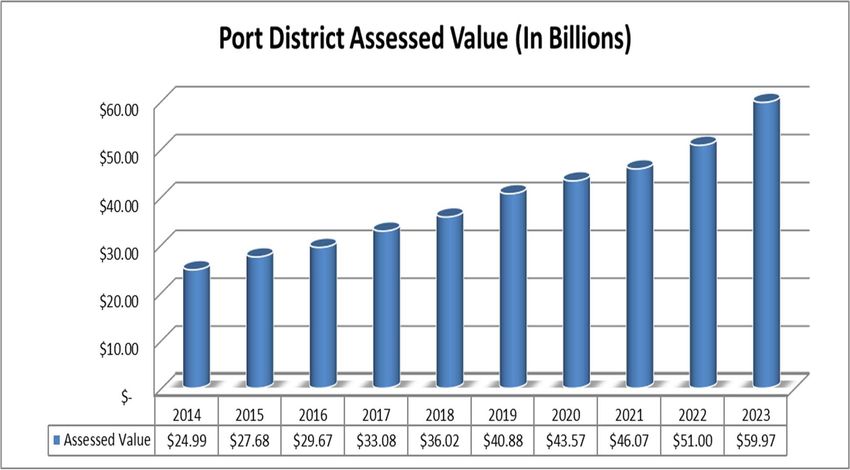
Port of Vancouver
Status of Strategic Plan Initiatives
Revision Date: September 27, 2022
Indicates the year significant work on the initiative began, and continues going forward
Strategic Goal Strategies 2019 2020 2021 2022 2023 2024 2025 2026 2027 2028
Community
1. Increase opportunities to engage the community in mutual discussions and provide education about port
activities, including port tours and the lecture series.
STRENGTHEN COMMUNITY OUTREACH AND COMMUNICATION
2. Use a variety of mediums, including social media, to reach a wide and diverse audience about port
programs and activities.
3. More clearly communicate the review process for new commodities and tenants to evaluate economic,
financial, environmental, community, and other impacts.
1. Create a program by which port commissioners, leaders and staff discuss opportunities, port goals, and
progress with partners, including port tenants, labor organizations, municipalities, tribes, non-profit
organizations, neighboring ports, educators, and the business community.
2. Develop a program in which port employees proactively participate in environmental stewardship
BUILD PARTNERSHIPS TO ADVANCE AND COMMUNICATE SHARED
programs, business development activities, education and workforce development, and other volunteer
GOALS
activities.
3. Pursue opportunities to share port knowledge and resources with community partners to advance
shared goals.
1. Build a public marketplace on the Columbia River.
2. Create a financially independent business model at Terminal 1 by securing long-term partnerships to
support the operating and capital costs.
IMPLEMENT THE VISION OF A DESTINATION WATERFRONT AT
TERMINAL 1
3. Support public enjoyment and tourism through activities such as river cruises and events at Terminal 1.
4. Explore partnerships in arts, culture, and history interpretation.
1. Create a Trails and Access Plan.
PROVIDE TRAILS AND PUBLIC ACCESS OPPORTUNITIES ON PORT
PROPERTIES
2. Identify opportunities and events to increase public access on port property.
3. Seek funding opportunities to expand the Renaissance Trail as well as the portside trail system.
4 Last updated: 09.07.2021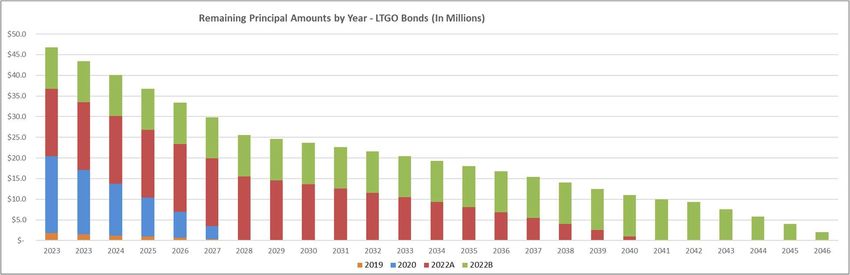
Status of Strategic Plan Initiatives
Strategic Goal Strategies 2019 2020 2021 2022 2023 2024 2025 2026 2027 2028
Economic Development
1. Work with the Columbia River Economic Development Council and other partners to identify and seek
consensus on a minimum available land supply to support a reasonable expansion of the job sector, and
further define the port's longer-term role in maintaining that inventory.
2. Develop an actionable plan for the development and expansion of existing industrial and commercial port
property, including the permitting process for undeveloped properties.
SUPPORT LOCAL EFFORTS TO MAINTAIN AN ADEQUATE SUPPLY OF 3. Recommend a 20-year land use strategy that includes key properties that would help to achieve long-
COMMERCIAL AND INDUSTRIAL REAL ESTATE term port and community economic goals.
4. Support development of shovel-ready sites within the port district with the necessary and appropriate
infrastructure, including broadband and utilities.
5. Take an active role in participating in regional economic development efforts and be a vested stake
holder with partner organizations.
1. Convene key stakeholders to address specific issues of concern regarding freight mobility that directly
impact the port and its tenants, including river, road, and rail.
2. Support and track regional discussions on issues such as the I-5 Bridge, commercial surface
transportation and impacts on local roads, and regional access.
TAKE A LEADERSHIP ROLE IN SUPPORTING REGIONAL, MULTI-
MODAL TRANSPORTATION AND IMPROVING FREIGHT MOBILITY
3. Work with sister ports, advocacy groups, and associations to ensure continued operations and
maintenance of the Columbia River channel.
4. Work with local, state, and federal elected officials and agencies to support and promote the importance
of freight mobility.
1. Partner with local businesses, associations, and the legislature to support workforce development
programs.
2. Meet with port tenants to discuss workforce challenges, apprenticeship, and training opportunities.
SUPPORT THE DEVELOPMENT OF A SKILLED WORKFORCE TO ALIGN
WITH REGIONAL NEEDS AND INCREASE JOB OPPORTUNITIES
ACROSS THE PORT DISTRICT
3. Partner with local colleges, high schools, skill centers, and vocational training programs to support
education and workforce development, particularly for manufacturing and trade-related jobs.
4. Support apprenticeship and vocational training opportunities for port public works projects.
5. Establish an apprenticeship program for port trade employees.
5 Last updated: 09.07.2021
Status of Strategic Plan Initiatives
Strategic Goal Strategies 2019 2020 2021 2022 2023 2024 2025 2026 2027 2028
Environmental
PROTECT AIR QUALITY, WATER RESOURCES, AND LAND MANAGED
1. Develop a Climate Action Plan through analysis of internal programs and policies, regulatory and
voluntary emission programs, and best practices, consistent with the port's commitment to sustainability.
BY THE PORT TROUGH DELIBERATE AND PROACTIVE EFFORTS IN
ALL ASPECTS OF THE PORT'S OPERATIONS
2. Implement storm water management practices that include innovative strategies to protect water
quality, such as targeted treatment media, enhanced Grattix boxes, and floating treatment wetlands.
MAINTAIN THE PORT'S SUSTAINABILITY PROGRAM TO ENSURE
1. Maintain Sustainability Program and ensure all departments are represented on Sustainability
Committee.
THAT PORT OPERATIONS ARE BASED ON ECONOMIC,
ENVIRONMENTAL, AND SOCIAL VALUES
2. Integrate the goals of the port's Sustainability Program into other planning documents, such as the
Annual Budget and Comprehensive Scheme of Harbor Improvements.
1. Develop an outreach program to discuss environmental stewardship at the port.
2. Work with partners to create ecological benefit and improved operating and permitting efficiencies.
STRENGTHEN COMMUNITY CONNECTIONS BY ACTIVELY
ENGAGING WITH OUR ENVIRONMENTAL STAKEHOLDERS
3. Establish regular communications with tribal entities.
4. Seek ways to improve the stewardship of our industry and region by sharing knowledge and technology.
6 Last updated: 09.07.2021
Status of Strategic Plan Initiatives
Strategic Goal Strategies 2019 2020 2021 2022 2023 2024 2025 2026 2027 2028
Financial
1. Pursue business opportunities that increase cargo volumes, maximize utilization of port assets, and
achieve revenue goals.
2. Develop tools to analyze and report the financial viability of the movement of individual commodities.
STRENGTHEN THE PORT'S FINANCIAL SUSTAINABILITY
3. Support a diverse revenue base through tax, industrial, marine, commercial, and grants, when
strategically appropriate.
4. Continually improve the precision of the port's ten-year operating and capital forecast with key
informative metrics.
DEVELOP AND COMMUNICATE A LONG-TERM STRATEGY FOR THE
1. Identify a tax strategy that addresses long term use of taxes.
USE OF PROPERTY TAXES AND DEBT FINANCING POLICIES AND
TOOLS
2. Develop a strategy to address debt financing options, including general obligation bonds, revenue bonds,
and other financing tools.
1. Continue to expand uses of technology to develop tools to support maintenance and management of
port assets.
DEVELOP A ROLLING 20-YEAR COMPREHENSIVE, SCHEDULED
MAINTENANCE PLAN TO MAXIMIZE OPERATIONAL CAPACITY,
EFFICIENCY AND LIFE EXPECTANCY OF PORT ASSETS
2. Develop and implement a proactive ten- to twenty-year repair and replacement plan for building, fleet,
rail, and infrastructure assets.
3. Assess future space planning needs and develop long-term plan.
7 Last updated: 09.07.2021Status of Strategic Plan Initiatives
Strategic Goal Strategies 2019 2020 2021 2022 2023 2024 2025 2026 2027 2028
Marine & Industrial Business
1. Emphasize and increase marketing efforts to pursue innovative business opportunities and renewable,
clean energy projects.
PURSUE OPPORTUNITIES THAT UTILIZE THE PORT'S PROPERTY
AND INFRASTRUCTURE INVESTMENTS TO CREATE JOBS AND
SUPPORT THE ECONOMY
2. Increase marketing efforts to pursue business opportunities that increase cargo volumes, maximize
utilization of port assets, and achieve revenue goals.
3. Maximize utilization of rail infrastructure to support the efficient movement of commodities.
1. Extend contracts with existing customers and tenants.
2. Develop an understanding of global markets and reinforce strong relationships with customers to ensure
the port can adapt to market conditions and competitively attract new cargo opportunities.
ENSURE THE PORT'S CARGO PORTFOLIO IS DIVERSIFIED BY
LEVERAGING RESOURCES TO RESPOND TO CUSTOMER NEEDS AND
MARKET DEMANDS
3. Market business resources and incentive programs, including Foreign Trade Zone, to existing and
potential businesses.
4. Conduct study of port operational capacity to handle high and heavy cargo and roll- on/roll-off cargo.
5. Evaluate future investment in marine and industrial development at Columbia Gateway.
CONTINUE TO PLAY A KEY ROLE IN MAINTAINING NAVIGABILITY
OF THE COLUMBIA RIVER SYSTEM, INCLUDING BERTHING
SYSTEMS, ANCHORAGE, TURNING BASINS, AND THE SHIPPING
CHANNEL
1. Work with industry associations, policy makers, and elected officials at the local, state and federal levels
to continue supporting the critical role of navigation for international trade and the regional economy.
1. Act as a resource and regularly reach out to existing tenants to assess business, workforce, and facility
needs, and to provide support for opportunities.
SUPPORT GROWTH AND ECONOMIC OPPORTUNITIES FOR
EXISTING TENANTS AND STRENGTHEN OUTREACH
2. Establish quarterly tenant events with information, speakers and a platform for networking.
3. Provide regular communications with current tenants and points of contact with port staff.
8 Last updated: 09.07.2021Status of Strategic Plan Initiatives
Strategic Goal Strategies 2019 2020 2021 2022 2023 2024 2025 2026 2027 2028
Organizational
1. Incorporate goals of the strategic plan into the port's operations and develop ongoing communications
about staff's role in measuring progress.
2. Analyze staffing levels and develop staff resource and succession plan.
RECRUIT AND RETAIN TALENTED AND DIVERSE STAFF WHO
SUPPORT EFFECTIVE INTERNAL AND EXTERNAL
COMMUNICATIONS, CONTINUOUS IMPROVEMENT AND
INNOVATION OF PORT BUSINESS AND SERVICE TO THE
3. Develop staff recognition program.
COMMUNITY
4. Develop a training and leadership program that aligns port goals and employee growth.
5. Actively promote employee diversity.
1. Align key documents to reflect new Strategic Plan.
ENSURE ALIGNMENT OF KEY PORT PLANNING DOCUMENTS
2. Annually review and update core planning documents to reflect best management practices and
statutory requirements.
1. Create risk assessment documents that include buildings, fleet, rail and infrastructure; staffing;
information technology; financial; commodities; and operational components.
ANALYZE RISKS AND DEVELOP A PLAN FOR BUSINESS CONTINUITY,
RESILIENCY, AND DISASTER RECOVERY
2. Develop a plan to address risk and ensure community safety and business continuity.
3. Finalize emergency preparedness plan and develop comprehensive training program for staff.
9 Last updated: 09.07.20212023 Final Budget
SOURCES
Operating Revenues
15-Rail 1,420,058
16-Finance & Accounting 250,000
18-Commercial 269,629
19-Industrial 13,947,726
20-Facilities 100,000
21-Marine Operations 21,920,651
22-Security 545,634
40-Marine Terminal 11,146,417
Total Operating Revenues $ 49,600,115
Non-operating Revenues
Ad Valorem Taxes 13,048,204
Interest Income 1,290,000
Grants & Other Contributions 2,222,120
Proceeds from Sale of Property 10,000
Other 88,600
Total Non-operating Revenues $ 16,658,924
Total Revenues $ 66,259,039
Transfer from General Fund/Financing $ 11,609,916
TOTAL SOURCES $ 77,868,955
USES
Operating Expenses
05-Executive 1,004,390
06-Economic Development 745,199
10-Administration 1,661,386
11-External Affairs 1,967,139
12-Information Technology 1,600,746
13-Procurement & Contracts 583,915
14-Human Resources 463,935
15-Rail 1,411,920
16-Finance & Accounting 2,759,903
17-Sales 2,319,693
18-Commercial 311,000
19-Industrial 1,890,900
20-Facilities 7,802,297
21-Marine Operations 2,122,248
22-Security 2,797,613
32-Environmental 1,626,388
40-Marine Terminal 11,560,956
Total Operating Expenses $ 42,629,628
Non-operating Expenses
Debt Service 10,339,132
Environmental Remediation 1,060,175
Other Non-Operating Expenses 1,195,000
Total Non-operating Expenses $ 12,594,307
Total Expenses $ 55,223,935
Capital Projects $ 22,645,020
TOTAL USES $ 77,868,955
10CAPITAL BUDGET OVERVIEW
The port invests in the acquisition, development, and maintenance of long-term assets to meet its mission
of providing economic benefit to the community and serving its tenants and customers. This investment is
evident in the renovation of facilities and terminals, construction of infrastructure, environmental
remediation projects, and the acquisition and development of property. The port’s continuing commitment
to its investment in long-term assets requires a comprehensive long-term capital planning approach.
The port’s capital planning process begins by reviewing the existing and anticipated business environment,
estimates of tenant and customer demand for facilities, and available resources. Several additional factors
are considered when evaluating and prioritizing specific projects. Among these are number of jobs created,
financial performance and rate of return, and safety and environmental impacts. Other aspects may be
appropriate to consider based on the port’s overall mission, strategic plan and regional opportunities and
constraints.
The port’s Capital Improvement Program (CIP) is the primary tool used to plan for major capital projects
and acquisition needs over a multi-year forecast period. The CIP forecasts expenditures to be incurred for
projects and acquisitions, identifies capital funding sources, and shows the impact on future operating
budgets. The planning horizon for the port’s capital budgets is 7-10 years. This period enables the port to
determine emerging capital needs, estimate project costs and allow time to plan projects and arrange
funding.
The 2023 capital budget reflects the port’s continuing commitment to promoting regional economic activity
through the investment of over $22.65 million in the economic development and expansion and renewal of
port facilities. In 2023 the port will perform tenant improvements, continue advancing a multi-year
investment in the port’s waterfront development and perform significant maintenance related improvements
to existing port facilities. Financing for the 2023 capital program will come from current revenues, tax levy
revenue, grants, and other contributions.
11Port of Vancouver
2023 Capital Budget
1
Description 2023
Maintenance
Maintenance: Buildings - BLDG 1501 Roof/Gutters and Paint 50,000
Maintenance: Buildings - BLDG 3209 Office Demo 150,000
Maintenance: Capital Dredging - Berth 17 450,000
Maintenance: Equipment - EV Charging Stations and Electrical Infrastructure 250,000
Maintenance: IT - Fiber and Cameras on Gateway overpass 75,000
Maintenance: IT - Vaults and Conduit for Connection to Main Duct Bank 150,000
Maintenance: Mechanical and HVAC - HVAC Building Replacements/Upgrades 200,000
Maintenance: Paving and Striping - T2 Pavement Replacement 315,000
Maintenance: Paving and Striping - T3 Pavement Mill and Fill 350,000
Maintenance: Rail - Hill Track Switch Replacement 75,000
Maintenance: Rail - Mill Plain Crossing 50,000
Maintenance: Stormwater - Kotobuki Way Storm Connection Upgrades 105,000
Maintenance: Stormwater - NW Packing Storm System Upgrades 99,750
Maintenance: Stormwater - Terminal 4 Pond and Outfall Improvements 231,000
Maintenance: Stormwater - Terminal 4 Pond Liner 750,000
Maintenance: Stormwater - Terminal 4 Pond Stormwater Pilot Project 441,000
Maintenance: Tenant Improvements 262,500
Maintenance: Vehicle and Equipment - EV Pickup-Maintenance 55,000
Maintenance: Vehicle and Equipment - EV Pickup-Operations 55,000
Maintenance: Vehicle and Equipment - EV Pickup-Security 55,000
Maintenance: Vehicle and Equipment - EV SUV - Admin 59,850
Maintenance: Vehicle and Equipment - Excavator 262,500
Maintenance: Vehicle and Equipment - Tandem Axle Vac Truck with Jetter and Camera 550,000
Maintenance: Vehicle and Equipment - Zero Turn Mower 21,000
Maintenance: Wastewater Treatment Improvements 157,500
Maintenance: Water System Improvements - Well 3 with Electric Pump 115,500
Sub-total: Maintenance 5,335,601
Environmental
Environmental: Purchase of In-water Mitigation Credits 162,500
Sub-total: Industrial 162,500
Industrial
Industrial: Parcel 10 Phase 1 - Stockpile 466,200
Industrial: Parcel 10 Phase 2 - Drainage Improvements and 20K sf Building 1,837,500
Sub-total: Industrial 2,303,700
Recreation
Recreation: Trail Segment 4 280,000
Recreation: Trail Segment 5 315,000
Sub-total: Recreation 595,000
Terminal Rehabilitation and Improvement Program (TRIP)
TRIP: T4 Bank Stabilization 1,029,000
TRIP: Temporary Electrical Equipment at Berth 17 383,250
TRIP: Power Infrastructure Improvements at Berth 17 600,000
TRIP: Berth 17 Phase 2-3: Demolition of Crane and Dock Rehabilitation 5,751,038
Sub-total: TRIP 7,763,288
Waterfront
Waterfront: T1 Marketplace and Brewlab - Preliminary Design 85,000
Waterfront: T1 Dock Ground Improvements and Wall - Design 133,333
Waterfront: T1 Dock Removal - Demolition 3,885,000
Waterfront: T1 Dock Replacement - Design 1,071,000
Sub-total: Waterfront 5,174,333
Labor Capitalization 1,310,598
Total: Capital Projects 22,645,020
Grants and Other Contributions
Grants: Waterfront: DOC - T1 Dock Design (1,548,120)
Grants: Recreation: RTC - Trail System Segment #4 (280,000)
Grants: Recreation: RTC - Trail System Segment #5 (315,000)
Grants: Operations: FEMA - Cyber Security (79,000)
Sub-total: Grants and Other Contributions (2,222,120)
Total: Capital Projects - Net 20,422,900
12TAX LEVY
TAX BUDGET SUMMARY
The port’s 2023 certified levy is $13,048,204. The budget is based on the port taking a 1 percent
increase, utilization of 100 percent of banked capacity and new construction. The levy limit is based on
the lower of the implicit price deflator (IPD) of 6.457 percent or 1 percent per Initiative I-747. The 2022
certified levy was $12,645,198.
In 1998, the Port of Vancouver Board of Commissioners adopted a resolution establishing a separate
account for the deposit of tax receipts. The Board of Commissioners also approved Resolution No. 4-
02 which authorizes tax levy proceeds to be used only for payment of debt service, capital
improvements, and environmental remediation. The 2023 levy will be used for:
Debt Service (GO Bonds) $5,039,397 38.6%
Environmental Remediation 1,060,175 8.1%
Capital Projects 6,948,632 53.3%
Total $13,048,204 100.0%
TAX LEVY SOURCES
Regular Tax Levy (RCW 53.36.020)
In the State of Washington, the county assessors (“Assessor”) determine the value of all real and personal
property throughout their respective counties that is subject to ad volorem taxation. The assessor’s duties
and methods of determining value are prescribed and controlled by statute and by detailed regulations
promulgated by the Department of Revenue. For tax purposes, the assessed value of property is set at
100% of its actual value. All property is subject to revaluation every four years. The property is listed by the
assessor on a tax roll at its current value and the tax roll is filed in the assessor’s office.
The assessor’s determinations are subject to revision by the county Board of Equalization and, for certain
property, subject to further revision by the State Board of Equalization. After all administrative procedures
are completed; the port commission receives the assessor’s final certificate of assessed value of property
within the port. The 2022/2023 Taxable Assessed Value increased approximately 17.58 percent for this tax
cycle.
Levy rates determine the amount of tax that a property owner pays per thousand dollars of assessed value.
RCW 53.36.020 provides that a district may raise revenue by levy of an annual tax not to exceed 45 cents
per thousand dollars of assessed value. However, the passage of Initiative 747 in 2001 limited the maximum
growth in property taxes from existing property to the lesser of the percentage increase in the implicit price
deflator (IPD) or 1%.
The county treasurer acts as an agent to collect property taxes levied in the county for all taxing authorities.
Taxes are levied annually on January 1 on property values listed as of the prior May 31. The lien date is
January 1. Taxes are due in two equal installments on April 30 and October 31. Collections are distributed
monthly to the port by the county treasurer.
Special Tax Levies (RCW 53.36.070).60
The port can levy property taxes for dredging, canal construction, land leveling or filling purposes. These
levies must be approved by the majority of voters within the port district and may not exceed $0.45 per
$1,000 of the assessed value of taxable property within the port district. The port has not requested this
levy.
Levy for Industrial Development District (RCW 53.36.100)
A port district having adopted a comprehensive scheme of harbor improvements may levy property taxes
for Industrial Development Districts for 12 years only. The levy cannot exceed $0.45 per $1,000 of assessed
value of taxable property within the port district. If a port district intends to levy this tax for one or more years
after the first six years, the port must publish notice of intent to impose such a levy. If signatures of at least
eight percent (8%) of the voters protest the levy, a special election must be held with majority approval
required. The port levied the tax for a 6-year period between 1958 and 1963 for property acquisition. The
13TAX LEVY
port has not levied the seventh through twelfth year period. The port’s advancement of an Industrial
Development District levy in August of 2007 was not successful.
FIGURES
Millage Rate (Per Thousand)
$0.40
$0.35
$0.30
$0.25
$0.20
$0.15
$0.10
$0.05
$-
2014 2015 2016 2017 2018 2019 2020 2021 2022 2023
Millage Rate $0.40 $0.36 $0.34 $0.30 $0.28 $0.24 $0.27 $0.27 $0.24 $0.22
14TAX LEVY
Certified Tax Levy (In Millions)
$14.00
$12.00
$10.00
$8.00
$6.00
$4.00
$2.00
$-
2014 2015 2016 2017 2018 2019 2020 2021 2022 2023
Certified Tax Levy $9.99 $9.99 $9.99 $9.99 $9.99 $9.99 $11.96 $12.23 $12.65 $13.05
Certified Tax Levy
2014 2015 2016 2017 2018 2019 2020 2021 2022 2023
Certified Tax Levy $ 9.99 $ 9.99 $ 9.99 $ 9.99 $ 9.99 $ 9.99 $ 11.96 $ 12.23 $ 12.65 $ 13.05
Valuations 2014 2015 2016 2017 2018 2019 2020 2021 2022 2023
$ in Billions $ 24.99 $ 27.68 $ 29.67 $ 33.08 $ 36.02 $ 40.88 $ 43.59 $ 46.07 $ 51.00 $ 59.97
% Change 8.98% 10.76% 7.19% 11.49% 8.89% 13.49% 6.63% 5.37% 10.70% 17.58%
Tax Levy 2014 2015 2016 2017 2018 2019 2020 2021 2022 2023
$ in Millions $ 9.99 $ 9.99 $ 9.99 $ 9.99 $ 9.99 $ 9.99 $ 11.96 $ 12.23 $ 12.65 $ 13.05
% Change 0.00% 0.00% 0.00% 0.00% 0.00% 0.00% 19.72% 2.26% 3.43% 3.16%
15LONG-TERM DEBT
Financing Team: The port employs outside financial specialists to assist in developing a bond issuance
strategy, preparing bond documents and marketing bonds to investors. The key players in the port’s
financing transactions include its financial advisor, bond counsel, the underwriter and the port’s finance and
accounting team.
Credit Ratings: The Director of Finance & Accounting is responsible for maintaining relationships with the
rating agencies that assign ratings to the port’s various debt obligations. This effort includes providing
periodic updates on the port’s general financial condition along with coordinating meetings and
presentations in conjunction with a new debt issuance. For the port’s LTGO bonds, Moody’s Rating
Committee has assigned an Aa2 rating and Standard & Poor’s has assigned an A+ stable rating. For the
port’s Revenue bonds, Standard & Poor’s has assigned an A+ stable rating.
In addition, Standard & Poor's Ratings Services has also affirmed the port’s 'A' issuer credit rating (ICR)
with a stable outlook. This is a separate rating from the port’s LTGO bond rating and Revenue bond rating
and focuses on the port's overall financial capacity (its creditworthiness) to pay its financial obligations.
LIMITED TAX GENERAL OBLIGATION BONDS
Overview: Limited Tax General Obligation (LTGO) bonds are general obligations of the port payable from
general (ad valorem) taxes, subject to certain constitutional and statutory limitations. The port plans long-
term debt issuance to finance its capital program based on its cash flow needs, sources of revenue, capital
construction periods and market conditions. Borrowings by the port mature over a term that does not exceed
the economic life of the improvements that they finance.
Outstanding Limited Tax General Obligation Bonds: $46,740,000 LTGO bonds remain outstanding as
of December 31, 2022.
Obligation Purpose Interest Rate Final Maturity Original Issue Balance 12/31/22
2019 Refunding Bonds 2.49% 2028 5,625,000 1,765,000
2020 Refunding Bonds 0.615-1.720% 2028 18,665,000 18,615,000
2022 Series A Property Improvements 5% 2042 16,365,000 16,365,000
2022 Series B Property Improvements 4.125-4.375% 2047 9,995,000 9,995,000
Total GO Bonds $ 50,650,000 $ 46,740,000
INDEBTEDNESS LIMITATION (RCW 53.36.030)
Under Washington State law the port may incur indebtedness payable from ad valorem taxes in an amount
not exceeding one-fourth of one percent of the value of the taxable property in the district without a vote of
the people. With the assent of three-fifths of the voters voting thereon, the district may incur additional
general obligation indebtedness provided the total indebtedness of the port at any time shall not exceed
three-fourths of one percent of the value of the taxable property in the district. The following estimates the
2023 debt limit. The port does have debt capacity to issue additional general obligation bonds.
16LONG-TERM DEBT
Value of Taxable Property (2023 Collection Year) 59,971,397,452
Limited Tax General Obligation Debt Capacity (Non-voted)
0.25% of Assessed Value 149,928,494
Less: Outstanding Limited Tax GO Debt @12/31/22 (46,740,000)
Remaining Capacity (Non-voted)* $ 103,188,494
* Decrease of 0.75% from prior year
SPECIAL FACILITY REVENUE BONDS
Special facility revenue bonds were issued on behalf of United Grain Corporation. A lease agreement
provides for unconditional payment of rent equal to the debt service of the special revenue bonds. The
bonds are not general obligations of the port, are payable solely from the pledged revenues of the lease
and do not constitute a lien on the unpledged revenues of the port. The outstanding special revenue bonds
in the principal amount of $25,000,000 are adjustable tender bonds subject to purchase on demand of the
holder at a price equal to the principal plus accrued interest under certain notification requirements. The
special revenue bonds are supported by direct payment of irrevocable bank letters of credit.
REVENUE BONDS
Overview: Revenue bonds are obligations of the port payable solely from the port’s net operating revenues.
The port plans long-term debt issuance to finance its capital program based on its cash flow needs, sources
of revenue, capital construction periods and market conditions. Borrowings by the port mature over a term
that does not exceed the economic life of the improvements that they finance.
Outstanding Revenue Bonds: $80,965,000 Revenue bonds remain outstanding as of December 31,
2022.
17LONG-TERM DEBT
Obligation Purpose Interest Rate Final Maturity Original Issue Balance 12/31/22
2016 Rev Bonds Property Acquisitions 1.325% - 4.010% 2046 40,000,000 35,320,000
2017 Rev Bonds Property Acquisitions 2.001% - 4.693% 2047 30,000,000 27,475,000
2018 Rev Bonds (A) Property Acquisitions 2.850% - 4.250% 2044 14,885,000 13,710,000
2018 Rev Bonds (B) Property Acquisitions 5.000% 2048 4,460,000 4,460,000
Total Revenue Bonds $ 89,345,000 $ 80,965,000
LINE OF CREDIT
On August 24, 2021, the Port of Vancouver’s Board of Commissioners approved Resolution No. 2-2021.
This resolution authorizes the Board of Commissioners to amend resolution 7-2013, as amended by
resolution 11-2015, as amended by resolution 3-2017, as amended by resolution 4-2019 to reflect the
agreed-upon changes. The extended agreement continues to retain the services of Key Bank. The
modification maintains the maximum amount of Line of Credit, extends the maturity date, maintains the
interest rate on advances, the unused commitment fee, and addresses process related to the anticipated
termination of LIBOR as a pricing index for computing interest. The revenue bond restricts a portion of the
port’s net operating revenue to secure a $35,000,000 Line of Credit. Currently there is no outstanding
balance on the Line of Credit.
The Line of Credit bears an interest rate equal to the sum of the One-month LIBOR Rate for that LIBOR
Interest Calculation Period applicable for said advances plus 57 basis points (0.57%). One-month LIBOR
Rate on September 30, 2022 was 3.14%. The port has agreed to pay the Series 2013 Credit Facility
Provider an unused commitment fee in the amount of 20 basis points per annum (0.20%).
The port uses this Line of Credit as complementary financing to operating cash flows. This agreement
matures on September 25, 2023. The maturity date can be extended annually by one year at the request
of the port and the sole consent of Key Bank.
DEBT POLICY AND POST ISSUANCE COMPLIANCE POLICY AND PROCEDURES
The port has developed a debt policy and post issuance compliance policy and procedures. The objective
of the debt policy is to establish criteria that will protect the port’s financial integrity while providing a funding
mechanism to meet the port’s capital needs. The post issuance compliance policy is designed to support
successful debt management and compliance with related laws, rules and regulations and contractual
requirements. These policies establish practices that will protect the port’s ability to access the bond
markets and support future debt financing of the port’s capital projects.
18GLOSSARY OF TERMS
Compound Average Growth Rate – The year-over-year growth rate of an investment over a
specified period of time.
Cost of Capital – The cost of funds used for financing a business.
Covenants – Binding terms between a lender and a borrower in which the borrower agrees to
certain financial performance measures by which they must operate their business to.
Debt Capacity - Assessment of the amount of debt an entity can repay in a timely manner
without jeopardizing its financial viability. This is typically restricted by loan covenants or board
mandated.
Debt Service – Principal and interest payments on debt.
Debt Service Coverage Ratio – Operating income/debt service payments.
Discounted Cash Flow (DCF) – A valuation method used to estimate the attractiveness of an
investment opportunity. Discounted cash flow (DCF) analysis uses future free cash flow
projections and discounts them to arrive at a present value, which is used to evaluate the
potential for investment.
Cash Flow – A revenue or expense stream that changes an entities cash position over a given
period. Cash inflows usually arise from one of three activities: financing, operations (revenue) or
investing. Cash outflows result from expenses or investments.
Present Value – The current worth of a future sum of money or stream of cash flows given a
specified rate of return. Future cash flows are discounted at the discount rate, and the higher the
discount rate, the lower the present value of the future cash flows.
Discount Rate – The discount rate in DCF analysis that takes into account not just the time value
of money, but also the risk or uncertainty of future cash flows - the greater the uncertainty of
future cash flows, the higher the discount rate.
Internal Rate of Return (IRR) – The discount rate where the net present value of all cash flows
from a particular project are equal to zero. When comparing various projects, the project with the
highest IRR is generally considered the best and is undertaken first.
Millage Rate – The amount per $1,000 that is used to calculate taxes on property.
Net Present Value (NPV) – The difference between the present value of cash inflows and the
present value of cash outflows over the life of an investment.
Non-operating Expenses – Expenses from interest expense on debt, environmental remediation,
and other non-operating expenditures.
Non-operating Revenue – Revenues from tax levies, interest income, sale of property, and other
non-operating revenues.
Operating Expenses – Expenses incurred from operations of the port, excludes depreciation
expense.
Operating Income – Operating revenue less operating expenses.
Operating Revenue – Revenue generated from operations of the port includes: dockage,
wharfage, storage, rail, and lease income.
Parity Debt – Debt issued with equal rights to one another.
Payback Period – The number of years to payback the initial cost of the investment from the
investments cumulative cash flow streams (revenue less expenses).
Return on Investment – A performance measure used to evaluate the efficiency of an
investment calculated as: (Gain on investment-cost of investment) divided by cost of investment.
19www.portvanusa.com
You can also read


