2022 Mid-South Land Values and Lease Trends Report - The ...
←
→
Page content transcription
If your browser does not render page correctly, please read the page content below

2022                              Mid-South Land Values
                                  and Lease Trends Report

         Arkansas

         Louisiana

      Mississippi

       Tennessee

2022 Mid-South Land Values & Lease Trends Report            1
2 American Society of Farm Managers and Rural Appraisers®
2022                                 Mid-South Land Values
                                         and Lease Trends Report

                                                   This report includes
                                                   12 Regions across
                                                   Arkansas, Louisiana,
                                                   Mississippi and Tennessee.

2022 Mid-South Land Values & Lease Trends Report                            1
Table of Contents

    President’s Message.  .  .  .  .  .  .  .  .  .  .  .  .  .  .  .  .  .  .  .  .  .  .  .  .  .  .  .  .  .  .  .  .  .  .  .  .  .  .  .  .  .  .  .  .  .  .  .  .  .  .  .  .  .  .  .  .  .  .  .  .  .  .  .  .  .  .  .  .  .  .  . 3
    Mid-South Chapter Officers.  .  .  .  .  .  .  .  .  .  .  .  .  .  .  .  .  .  .  .  .  .  .  .  .  .  .  .  .  .  .  .  .  .  .  .  .  .  .  .  .  .  .  .  .  .  .  .  .  .  .  .  .  .  .  .  .  .  .  .  .  .  .  .  .  . 4
                    Project Committee. .  .  .  .  .  .  .  .  .  .  .  .  .  .  .  .  .  .  .  .  .  .  .  .  .  .  .  .  .  .  .  .  .  .  .  .  .  .  .  .  .  .  .  .  .  .  .  .  .  .  .  .  .  .  .  .  .  .  .  .  .  .  .  .  .  .  . 5
    Arkansas
                    Overview .  .  .  .  .  .  .  .  .  .  .  .  .  .  .  .  .  .  .  .  .  .  .  .  .  .  .  .  .  .  .  .  .  .  .  .  .  .  .  .  .  .  .  .  .  .  .  .  .  .  .  .  .  .  .  .  .  .  .  .  .  .  .  .  .  .  .  .  .  .  .  .  .  .  . 7
                    Regions. .  .  .  .  .  .  .  .  .  .  .  .  .  .  .  .  .  .  .  .  .  .  .  .  .  .  .  .  .  .  .  .  .  .  .  .  .  .  .  .  .  .  .  .  .  .  .  .  .  .  .  .  .  .  .  .  .  .  .  .  .  .  .  .  .  .  .  .  .  .  .  .  .  .  . 13
                    Thoughts on 2022 .  .  .  .  .  .  .  .  .  .  .  .  .  .  .  .  .  .  .  .  .  .  .  .  .  .  .  .  .  .  .  .  .  .  .  .  .  .  .  .  .  .  .  .  .  .  .  .  .  .  .  .  .  .  .  .  .  .  .  .  .  .  .  .  .  .  . 27
    Special Interest
                    Gain a Deeper Understanding with MapRight’s Powerful GIS Mapping Software. .  .  .  .  .  .  .  .  .  .  .  .  .  .  .  .  . 28
    Louisiana
                    Overview .  .  .  .  .  .  .  .  .  .  .  .  .  .  .  .  .  .  .  .  .  .  .  .  .  .  .  .  .  .  .  .  .  .  .  .  .  .  .  .  .  .  .  .  .  .  .  .  .  .  .  .  .  .  .  .  .  .  .  .  .  .  .  .  .  .  .  .  .  .  .  .  .  . 31
                    Regions. .  .  .  .  .  .  .  .  .  .  .  .  .  .  .  .  .  .  .  .  .  .  .  .  .  .  .  .  .  .  .  .  .  .  .  .  .  .  .  .  .  .  .  .  .  .  .  .  .  .  .  .  .  .  .  .  .  .  .  .  .  .  .  .  .  .  .  .  .  .  .  .  .  .  . 35
                    Statewide Timber Summary. .  .  .  .  .  .  .  .  .  .  .  .  .  .  .  .  .  .  .  .  .  .  .  .  .  .  .  .  .  .  .  .  .  .  .  .  .  .  .  .  .  .  .  .  .  .  .  .  .  .  .  .  .  .  .  .  .  .  . 40
    Mississippi
                    Overview .  .  .  .  .  .  .  .  .  .  .  .  .  .  .  .  .  .  .  .  .  .  .  .  .  .  .  .  .  .  .  .  .  .  .  .  .  .  .  .  .  .  .  .  .  .  .  .  .  .  .  .  .  .  .  .  .  .  .  .  .  .  .  .  .  .  .  .  .  .  .  .  .  . 43
                    Regions. .  .  .  .  .  .  .  .  .  .  .  .  .  .  .  .  .  .  .  .  .  .  .  .  .  .  .  .  .  .  .  .  .  .  .  .  .  .  .  .  .  .  .  .  .  .  .  .  .  .  .  .  .  .  .  .  .  .  .  .  .  .  .  .  .  .  .  .  .  .  .  .  .  .  . 45
                    Moist-Soil Management for Waterfowl .  .  .  .  .  .  .  .  .  .  .  .  .  .  .  .  .  .  .  .  .  .  .  .  .  .  .  .  .  .  .  .  .  .  .  .  .  .  .  .  .  .  .  .  .  .  .  .  .  .  . 54
                    Working on Issues Impacting the Cattle Industry.  .  .  .  .  .  .  .  .  .  .  .  .  .  .  .  .  .  .  .  .  .  .  .  .  .  .  .  .  .  .  .  .  .  .  .  .  .  .  .  .  .  . 57
                    Trapping Hogs: The Little Things Matter. .  .  .  .  .  .  .  .  .  .  .  .  .  .  .  .  .  .  .  .  .  .  .  .  .  .  .  .  .  .  .  .  .  .  .  .  .  .  .  .  .  .  .  .  .  .  .  .  . 58
                    What Determines Standing Tree Value? .  .  .  .  .  .  .  .  .  .  .  .  .  .  .  .  .  .  .  .  .  .  .  .  .  .  .  .  .  .  .  .  .  .  .  .  .  .  .  .  .  .  .  .  .  .  .  .  .  . 60
                    Mississippi’s Changing Broiler Industry Has Large Impact Through In-State Purchases .  .  .  .  .  .  .  .  .  .  .  .  . 62
                    Poultry Cost Estimation.  .  .  .  .  .  .  .  .  .  .  .  .  .  .  .  .  .  .  .  .  .  .  .  .  .  .  .  .  .  .  .  .  .  .  .  .  .  .  .  .  .  .  .  .  .  .  .  .  .  .  .  .  .  .  .  .  .  .  .  .  .  . 64
                    Lumber Market Roller Coaster.  .  .  .  .  .  .  .  .  .  .  .  .  .  .  .  .  .  .  .  .  .  .  .  .  .  .  .  .  .  .  .  .  .  .  .  .  .  .  .  .  .  .  .  .  .  .  .  .  .  .  .  .  .  .  .  .  . 65
    Tennessee
                    Overview .  .  .  .  .  .  .  .  .  .  .  .  .  .  .  .  .  .  .  .  .  .  .  .  .  .  .  .  .  .  .  .  .  .  .  .  .  .  .  .  .  .  .  .  .  .  .  .  .  .  .  .  .  .  .  .  .  .  .  .  .  .  .  .  .  .  .  .  .  .  .  .  .  . 67
                    Cash Rental Rates and Land Values, 2020.  .  .  .  .  .  .  .  .  .  .  .  .  .  .  .  .  .  .  .  .  .  .  .  .  .  .  .  .  .  .  .  .  .  .  .  .  .  .  .  .  .  .  .  .  .  .  .  . 72
    Mid-South Region Membership Directory . .  .  .  .  .  .  .  .  .  .  .  .  .  .  .  .  .  .  .  .  .  .  .  .  .  .  .  .  .  .  .  .  .  .  .  .  .  .  .  .  .  .  .  .  .  .  .  .  .  .  .  . 78
    About ASFMRA & Benefits of Membership. .  .  .  .  .  .  .  .  .  .  .  .  .  .  .  .  .  .  .  .  .  .  .  .  .  .  .  .  .  .  .  .  .  .  .  .  .  .  .  .  .  .  .  .  .  .  .  .  .  .  . 82
    Index of Advertisers.  .  .  .  .  .  .  .  .  .  .  .  .  .  .  .  .  .  .  .  .  .  .  .  .  .  .  .  .  .  .  .  .  .  .  .  .  .  .  .  .  .  .  .  .  .  .  .  .  .  .  .  .  .  .  .  .  .  .  .  .  .  .  .  .  .  .  .  .  .  . 85

2                                                                                                                                            American Society of Farm Managers and Rural Appraisers®
President’s Message

Welcome to our fifth edition of the ASFMRA Mid-South Land Values and Lease
Trends Journal. We are very proud that this is our fifth publication and have
worked very hard over the past years to continually improve upon our previous
editions. Past publications have been very successful, and we hope to continue
with our success in this edition. The Mid-South Chapter members have been
a great help with these publications. The publication committee has done a
wonderful job and worked tirelessly to get current and accurate information to
members, clients, customers and other professional associates.

During the past year’s farming season the crops in our area started strong.
Many were saying that the crops were some of the best-looking they have seen
in a long time. Commodity prices were exceptionally high. In June, however,
record high rainfall in our area resulted in major flooding and thousands of acres
were under water during the main growing period. This, ultimately, resulted in
poor yields for many crops in the affected area. Many farmers that had grain
booked at an elevator could not meet their bookings and had to opt out of
                                                                                     Allen Swain
their contracts due to zero production acres. What started out to be a great         President
year turned disastrous.                                                              First South Farm Credit
                                                                                     PO Box 9249
It is important to note that this book is meant to be a guide and not a basis        103 Professional Plaza
for making a significant farmland investment, sale, or lease negotiation. This       Greenwood, MS 38930
journal will help guide in formulating realistic farmland values and farm lease
                                                                                     (662) 588-0107
options within our Mid-South market areas. These values are in no way intended
to estimate an opinion of value for a respective agricultural property and only
serves as a resource for information about the market area for the reader. We
encourage you to contact the appropriate professionals when making such an
important and lasting decision. Seeking good advice is never a bad decision.
Whether it’s professional farm managers (brokers), appraisers or consultants,
you can find a qualified professional at www.ASFMRA.org.

Thanks again for being a loyal supporter and reader. The members of the
ASFMRA are some of the most dependable and knowledgeable agricultural
professionals with whom I’ve ever been associated. It is my sincere hope that you
find the contents of this publication both informative and useful. Good reading
and we thank you for your continued support.

2022 Mid-South Land Values & Lease Trends Report                                                               3
Officers: Mid-South Chapter - ASFMRA

    Allen Swain                             Shane Bray                           Rebecca L. Phillips
    President                               President Elect                      2nd President Elect
    First South Farm Credit                 Goldcrest Farm Trust                 Certified General Appraiser
    PO Box 9249                             1052 County Road 476                   – TN, AR, MS, MO, LA
    103 Professional Plaza                  Jonesboro, AR 72404-8204             Rutledge Investment Co.
    Greenwood, MS 38930                     (870) 351-0862                       Memphis, TN
    (662) 588-0107                                                               (901) 766-9041

                              Jeffrey Hignight, AFM                      Doug Hartz
                              Secretary-Treasurer                        Immediate Past-President
                              Glaub Farm Management, LLC                 Hartz Farm Management
                              1702 Stone St., Ste C                      1605 S Main St.
                              Jonesboro, AR 72401-5374                   Stuttgart, AR 72160-6008
                              (870) 972-6996                             (870) 673-6521

4                                                           American Society of Farm Managers and Rural Appraisers®
Project Committee

                              Tyler Mullins, ARA                 Jake Minton, ARA
                                   Chairman                         Vice-Chairman
                             Mississippi Land Bank          AgHeritage Farm Credit Services
                                Senatobia, MS                         Lonoke, AR

       Bill Arbuckle                     Brett Cates           Clay Caver, ARA and RPRA       Ted L. Glaub, AFM
    Louisiana Land Bank           First South Farm Credit       AXA Equitable AgriFinance Glaub Farm Management, LLC
      Opelousas, LA                 Mississippi Division              Memphis, TN                Jonesboro, AR
                                      Hattiesburg, MS

   Jeffrey Hignight, AFM          Scott McKennon, ARA          Robert ‘Wes’ Lowe, Jr., ARA    Houston M. Matthews
Glaub Farm Management, LLC          First Financial Bank          Louisiana Land Bank      Glaub Farm Management, LLC
       Jonesboro, AR                Morrilton, AR 72110              Winnsboro, LA                Jonesboro, AR

   Tim W. Pepper, ARA              Rebecca L. Phillips             Bill Shannon, AFM        Andrew T. Vance, ARA
 Pepper Appraisal Services       Rutledge Investment Co.        Farmers National Company AgHeritage Farm Credit Services
      Louisville, MS                  Memphis, TN                    Jonesboro, AR                Lonoke, AR

2022 Mid-South Land Values & Lease Trends Report                                                                     5
ARKANSAS

           6   American Society of Farm Managers and Rural Appraisers®
Arkansas Land Market
                                                                     –An Overivew
                                                   Introduction to Arkansas Section
                                                   Prior to our 2021 publication, the row crop areas of eastern Arkansas

                                                                                                                               ARKANSAS
                                                   were divided into seven separate regions. While these divisions
                                                   allowed for increased specificity about small, clearly-defined market
                                                   areas, it also created the impression that the individual market areas
                                                   in eastern Arkansas are static and clearly-definable; this, of course, is
                                                   not always the case.
                                                   As has been stated elsewhere, the purpose of this publication is to
                                                   provide a general guide to land values, not to drill-down into the
                                                   nuance of each individual market area (for an accurate valuation of
                                                   a specific piece of property the reader is encouraged to contact an
                                                   Accredited Appraiser). Starting in the 2021 edition (and continued

                                                                                                                               LOUISIANA
                                                   in this current edition), the seven eastern Arkansas regions were
                                                   consolidated into two regions: Region 1 will be the eastern Arkansas
                                                   cropland area situated north of Interstate 40; Region 2 will be the
                                                   eastern Arkansas cropland area situated south of Interstate 40.
                                                   The notable disadvantage of consolidating the eastern Arkansas
                                                   regions is that the range of values from each region (which will
                                                   be discussed later) will be extremely wide. The advantage of
                                                   consolidation deals with the amount of available data points: smaller
                                                   regions typically offer very few data points over the previous 12-month
                                                   period (generally speaking, transfers of agricultural property in the
                                                   Delta occur less frequently than in many of the cropland areas of the

                                                                                                                               MISSISSIPPI
                                                   Mid-West). The smaller the region, the fewer the data points; in some
                                                   cases, this can mean only a handful of sales over a 12-month period.
                                                   Having so few sales in a small region creates issues for a publication
                                                   which is attempting to track value trends from year to year. In a small
                                                   region with very few sales, even one or two transfers can have a
                                                   significant impact on the range of value for that region; this makes it
                                                   very difficult to spot realistic value trends when comparing one year
                                                   to another.
                                                   Before beginning our discussion, it is important for the reader to
                                                   realize that while the entirety of eastern Arkansas’ cropland has been

                                                                                                                               TENNESSEE
                                                   divided into only two regions, the reality is that there are many smaller
                                                   submarkets within each region. This publication is meant to serve as
                                                   a general guide and not a tool to apply values to a specific property.

                                                                                                    Continued on next page

2022 Mid-South Land Values & Lease Trends Report                                                                          7
ARKANSAS
LOUISIANA
MISSISSIPPI
TENNESSEE

              8   American Society of Farm Managers and Rural Appraisers®
Eastern Arkansas (Regions 1 and 2) would continue to be lowered) encouraged borrowing
and contributed to the rapid appreciations in Delta ag
2021 Overview land values between 2008 and 2014.
Before addressing each of the two eastern Arkansas So how significant was the appreciation between 2008 and
regions, we will begin our discussion with a brief overview 2014? A quick overview of AgHeritage Farm Credit and
of the eastern Arkansas agricultural market over the last Farm Credit Midsouth Benchmark data can help answer
twelve months. This section will highlight a few of the key this question. In the Farm Credit system, benchmark
points we have noticed and that we believe are important properties are appraised annually in an attempt to track
enough to discuss briefly in this publication. value trends; AgHeritage Farm Credit monitors six row
ARKANSAS
crop benchmark properties, Farm Credit Midsouth has
Appreciation five row crop benchmark properties – between these two
As many of our readers will remember, the last significant Farm Credit associations, all of Arkansas Regions 1 and 2
period of rapid value appreciation in the eastern Arkansas are represented.
market began around 2008. In the years leading up to
2008, the ag land market in eastern Arkansas had typically Across all 11 row crop benchmark properties, the following
been dominated primarily by buyers who were local owner/ average appreciations were indicated between 2008 and
operators and local investors. In 2008, market characteristics 2014 (these appreciations are calculated based on the
changed significantly and ushered in a period of strong twelve months prior; in other words, the appreciation
(and unprecedented) appreciation that would continue for percentage for 2008 represents the 12 months from
the next six to seven years. Some of the market changes mid-2007 to mid-2008):
that led to this appreciation are as follows: 2008: 13.09% 2012: 18.09%
LOUISIANA
2009: 10.28% 2013: 16.77%
Commodity Prices – Government incentives were
2010: 8.55% 2014: 11.07%
introduced that encouraged the development of ethanol
2011: 9.58%
as a renewable fuel additive. This created increased
demand for corn and led to a period of strong commodity After these seven years of strong appreciation in the eastern
prices, particularly for corn. Arkansas rowcrop market, the average appreciation in the
New Buyers – 2008 also brought new land buyers to the years that followed were markedly different:
eastern Arkansas market. Argentine investors, initially 2015: 3.91% 2018: -0.62%
motivated by political pressures and the possibility of 2016: 2.03% 2019: 1.57%
undesirable economic policies back home, began acquiring 2017: -0.40% 2020: 2.32%
properties and – in many cases – offering prices that were, In our opinion, it is appropriate to have included this
MISSISSIPPI
at least at that time, considered above-market by many discussion on eastern Arkansas land values over the past
landowners. Over the next several years, the number of several years. Understanding the market of yesterday not
Argentine investors grew and, no doubt, contributed to only provides context for our observations of the market
the overall increase in demand for properties in certain today, but it also allows us to make educated predictions
areas. At about this same time, institutional investment about the markets of tomorrow.
groups began exhibiting new (or increased) demand for
larger agricultural tracts. Over a relatively short period of Beginning in 2021, sales activity – compared to 2020 –
time, some local buyers in certain areas found themselves increased over much of Arkansas’ eastern row crop market
competing against these new (both foreign and domestic (there are exceptions to this, of course; in certain areas –
investors) market participants; increased demand always – most notably in extreme northeastern Arkansas from where
at least in the short term – leads to higher prices. Arkansas’ highest per acre values are typically reported
– sales activity actually decreased). The exceptions
TENNESSEE
Recession – The “great recession” (caused, in large part, notwithstanding, sales activity (particularly in southeastern
by irresponsible lending practices in the US housing Arkansas) has been robust since the beginning of 2021.
market) began in December 2007 and, by the time it was
over, was the longest economic downturn in US history Between 2019 and 2020, AgHeritage’s six row crop
since World War II. This national period of economic benchmark properties indicated an average increase of
uncertainty and negative GDP growth had implications in 0.52%; between 2020 and 2021, those same six properties
the Delta agricultural land market as well. For one, the indicated an average increase of 7.52%. It should be noted
recession motivated more individual buyers to consider that this 7.52% indication was likely muted by the late 2020
agricultural property as a relatively safe investment sales that were utilized in the valuation; it could be (and
possibility (further increasing demand). Another (and the 2022 benchmarks will confirm or deny) that the actual
more significant) implication of the great recession was the average increase over the AgHeritage row crop territory,
response from the Federal Reserve. Hoping to stimulate since the beginning of 2021, is higher than the benchmark
growth (spending) and discourage saving, interest analysis indicated.
rates were lowered (the average 2020 rate on a 30 year It is important to note that only two of the 11 eastern
mortgage is about half what the rate was in 2008). Lower Arkansas row crop benchmarks properties did not indicate
rates (and, just as importantly, the expectation that rates an appreciation between 2020 and 2021; interestingly,
Continued on next page
2022 Mid-South Land Values & Lease Trends Report 9ARKANSAS
LOUISIANA
MISSISSIPPI
TENNESSEE
10 American Society of Farm Managers and Rural Appraisers®Eastern Arkansas 2021 Overview quality. In fact, there have already been several examples
continued of this (primarily in the second half of 2021) in the eastern
Arkansas market. Not all agricultural properties are of equal
quality, and we expect that – once again – below-average
these are – by far - the two highest per-acre benchmark quality tracts will likely increase in price at a rate that
properties in eastern Arkansas. Both of these properties are outpaces the appreciation of many higher quality, more
in areas with extremely strong demand from very capable desirable properties. And, as before, these below-average
buyers, and also in areas where very few properties were properties will be setup to decrease in value once supply
available for purchase between 2020 and 2021. One of and demand begins to gravitate toward equilibrium.
these two benchmarks, in fact, indicated a depreciation of
ARKANSAS
2.78% between 2020 and 2021; this was partially because Seller’s Market
there were very few sales in that particular area coupled We all know someone who has sold their home or purchased
with the fact that the properties which did sell were average one in 2021; we’ve all heard stories of homes selling for 10
to slightly-below average quality farms, which leads us into or 15 or even 20% above the asking the price. There are
our next market observation: many examples of homes being advertised for less than
24 hours prior to being placed under contract. Several
Scarcity and Discernment market factors contributed to this housing environment:
One observation made during period of strong appreciation for one, (and unless you owned a business, particularly in
between 2008 to 2014 deals with the discernment of the the service industry) many people are in stronger financial
buyer. As demand continued to increase over the first positions than they were pre-pandemic; another reason
few years of that period, the supply of available cropland is that interest rates remain low and financing is relatively
quickly began to tighten. When demand for a certain good easy. These and other factors led to an imbalance of supply
LOUISIANA
increases quickly and outpaces the market’s willingness/ and demand; in many markets, there simply have not been
ability to either supply or produce more units of the thing enough available units to satisfy the demand.
demanded, buyers will look for substitutes (an example: if
there is a shortage of orange juice which causes its price This imbalance is an inflationary pressure, and the exact
to increase substantially, the demand for alternatives – say, same thing has been happening in the agricultural land
apple juice – will likewise increase, eventually causing an market. Real estate brokers have often commented that
increase in the price of the substitute itself). “there simply isn’t enough inventory available.” Marketing
times (the time needed to advertise an agricultural property
In an effort to satisfy growing demand throughout the before placing it under contract) shortened throughout the
2008 to 2014 appreciation period, some buyers appeared year, and many cropland and recreational tracts would sell
to become less discriminating about what constitutes as “pocket listings” (meaning that the broker never actually
a good farm versus an average (or even below-average) had to advertise the property publicly, but simply reached
MISSISSIPPI
farm. Consequently (and this trend became more out to parties they knew would be potential buyers).
noticeable as the appreciation period lengthened) many
average to below-average properties in eastern Arkansas There have even been several instances of agricultural and
experienced appreciation rates greater than those of recreational properties selling that were not for sale. To
higher quality farms (simply due to the fact that the lower clarify, what we mean is that the owner was not looking
quality farms began the period with a lower price per acre to sell the property, no broker had been contacted about
relative to the higher quality farms). advertising the property, no rumors were circulating
that the property might be available, etc. Regardless,
However, as the market began to cool (around 2015) values the owner is approached by a potential buyer who
reacted as some might have expected: while the good quality makes an unsolicited offer on the property (as you might
farms, for the most part, held onto the value appreciations imagine, the unsolicited offer is oftentimes well-above the
realized through the 2008 to 2014 period, many below-
TENNESSEE
defendable market value for the property at the time of
average properties found themselves overpriced and, in offer) and the owner, sometimes, decides to become a
many cases, lost value gained through the appreciation seller. Transactions generated in this way are often price
period. The takeaway is this: in a “normal” market (where outliers when compared to the rest of the data, and are
supply and demand are closer to equilibrium) and where indicative of a true seller’s market.
participants are behaving somewhat predictably, most
buyers recognize the difference between a good farm Now that we have discussed some current, general market
and a below-average property. Over time, appreciations observations and have provided some context based
gained by higher quality farms are generally more resilient on previous appreciation periods, we will now turn our
than rapid appreciations gained by lower quality farms. attention to the actual land values in eastern Arkansas.
Before we discuss Regions and 1 and 2 individually,
After almost seven years of flat to nominal increases, the we must first define the land categories utilized for this
eastern Arkansas agricultural land market appears to have section (the reader should note that the contributors from
entered another appreciation period at the beginning of each state represented in this publication handle their
2021 (only time will tell as to the length and intensity of sales data differently; therefore, the reader is encouraged
this particular appreciation period). If demand continues to read through and understand how the land types are
to hold at current levels (or even increase), some buyers divided and defined in each section of this publication).
will, once again, become less discriminating about price vs
2022 Mid-South Land Values & Lease Trends Report 11ARKANSAS
LOUISIANA
MISSISSIPPI
TENNESSEE
12 American Society of Farm Managers and Rural Appraisers®Arkansas Regions 1 & 2
Land Classifications
From heavy clay-based soils to sandy silt loams and
everything in between, the quality of agricultural acreage
in eastern Arkansas is as diverse as the commodities
grown there. Availability of good ground and surface
ARKANSAS
water, soil types, adequacy of drainage, topographical
differences, ease of management, and local tenant pool
are all important considerations when attempting to
determine the relative quality of a particular agricultural
tract. The differences found between one tract and
another can, and oftentimes do, influence value. Although
the purpose of this publication is to provide a range of
values for the various qualities of agricultural acreage
commonly found in the Delta, it should be understood that
Cropland A acreage). When referring to the “overall ease of
the combinations of value-influencing qualities are nearly
management,” we are including additional characteristics
infinite: for example, a tract with good soils (positive) could
LOUISIANA
such as ease of access to and throughout the property as
be in a weak groundwater area (negative), a precision
well as individual field shape and size.
leveled tract could be in an area that does not drain well,
or a heavily undulating tract with very productive soils Cropland B: This represents the broadest land category
could be located in a weak tenant area. The challenge, in the eastern Arkansas discussion. Whereas acreage that
then, is in understanding how to broadly, and yet properly, qualifies as Cropland A must be “better than average”
define general land categories which represent most of in each of its primary land characteristics, Cropland B
the agricultural acreage found in eastern Arkansas. represents acreage which can be average to below average
in certain characteristics, while remaining above average
Understanding, then, that the only way to provide a
in others. For example, a heavy clay-based soil (with a soil
concise, meaningful range for widely varied properties is by
classification of Class III or IV which is not a characteristic
employing the use of broadly defined land categories; for
of Cropland A) but that is irrigated and has been precision
MISSISSIPPI
eastern Arkansas, we have chosen to use three: Cropland
leveled (both characteristics of Cropland A) would be
A, Cropland B, and Cropland C.
considered, overall, as Cropland B acreage due to crop
Cropland A: In general terms, this category can most production limitations. Another example would be a tract
simply be defined as “the highest quality of cropland comprised of good, light, versatile soils (a characteristic
found in a given area.” Although “quality” is a somewhat of Cropland A with a soil classification of Class I or II) but
subjective measure, we are referring primarily to soil types, which has topography that makes irrigation difficult or
irrigation, topography, and overall ease of management. cumbersome (which is not a characteristic of Cropland A)
In regard to soil types, Cropland acreage will most often would be considered, overall, as Cropland B acreage. In
be comprised of good, versatile, silt loam soils that contain general terms, Cropland B acreage, whether clay-based
Class I and II soil classification. Corn, cotton, soybeans, or silt loam, is typically irrigated. Row crops on Cropland B
peanuts, and – in the Grand Prairie Region – rice, are grown can be row-watered, but not with the ease of Cropland A
TENNESSEE
successfully on this type soil. (In the Grand Prairie some tracts. Precision leveled clay-based soils (straight-leveed)
silt loam soils have a Class III soil classification but due to are considered high Cropland B quality tracts whereas
topography, irrigation, and drainage are still considered to undulating clay-based soils (contour-leveed) are typically
have a Cropland A land classification.) To put another way, considered average Cropland B quality acreage.
heavy clay-based soils (which are generally less-versatile
Cropland C: Acreage categorized as Cropland C will be,
and more difficult to manage) have not been included in
generally speaking, below average agricultural acreage for
the Cropland A category. Cropland A acreage will also be
a given area. In most cases, the Cropland C category is
irrigated by a dependable source, either by groundwater
used to identify non-irrigated tillable acreage. Issues with
or surface water improvements (river or bayou, reservoirs,
topography are a common detriment found in this category,
or tailwater ditches). Cropland A, as for topography, will
and are oftentimes the reason the acreage is non-irrigated.
oftentimes be acreage that has been precision leveled to
Issues relating to poor drainage can be emblematic of
grade or, in some cases (and at a minimum), acreage that
Cropland C as well, and it is not unusual to lose crops due
can easily row-water. Drainage is an important concern
to standing water or to be heavily delayed from planting
as well; Cropland A properties have topography and
or harvest. Put in general terms, Cropland C is typically
improvements which allow for drainage after heavy rains
comprised of problematic, non-irrigated, marginal tillable
or overflow (crops are seldom lost due to flooding on
acreage with a soil classification of Class II, II
2022 Mid-South Land Values & Lease Trends Report 13ARKANSAS
LOUISIANA
MISSISSIPPI
TENNESSEE
14 American Society of Farm Managers and Rural Appraisers®Arkansas Region 1
Cropland Values
In the following discussion, Arkansas’ Region 1 constitutes
all the Delta area (the row crop producing area of Arkansas
located on either side of Crowley’s Ridge) within the state
situated north of Interstate 40. This is a very broad region,
ARKANSAS
ranging anywhere from highly productive sandy loam soils
that have historically produced cotton to the heavy clay
soils of rice and soybean farms.
The highest agricultural land values in Arkansas are
located in the northeastern portions of Region 1. This area
can be more closely defined as being east of Crowley’s
Ridge in Clay, Greene, Poinsett, and Cross Counties, all of
Mississippi County, and most of Crittenden County. The Counties specifically). However, over the past twelve
highest agricultural values within this market are typically months, sales activity in this area has slowed considerably
found in the northeastern-most corner of the state in compared to recent years.
LOUISIANA
eastern Clay County. This area is mostly flat and has a wide
Peanut production has also gained acreage in some of
range of alluvial soil types ranging from coarse sand to
the northern areas of this market; there are large peanut
sandy loams to heavy clays. These alluvial soils are high in
buying points in Portia (Lawrence County), in Pocahontas
natural fertility and have historically produced some of the
(Randolph County), and another buying point/processing
highest yields in the state.
facility (Delta Peanut) located in Jonesboro (Craighead
In the earlier years the area east of the ridge grew mostly County). Portions of this market are heavily influenced by
cotton, but during the 1960s and 1970s many of the the White, Cache, and Black Rivers; recreational demand
areas with clay soils transitioned to soybeans and rice has increased significantly in last several years with many
while cotton remained the primary crop on the sandier farmers supplementing their income with recreational
soils. During the 1990s and 2000s, corn (which had leases. The area west of the ridge is a major flyway for
MISSISSIPPI
very little commercial presence here prior to this time) winter duck migration and is the prime duck hunting area
displaced cotton as the crop of choice for rotation with for northern Arkansas. Duck hunting has an impact on land
soybeans in many areas with sandier soils and began to prices in much of the area, particularly along the rivers.
be grown as a rotational crop for cotton. In recent years The area economy receives a boost from duck hunters’
acreage devoted to peanut production has increased, recreational expenditures each year. Many of the values
also usually in rotation with cotton and corn. Cotton that comprise the lower end of the range are derived from
acreage has also increased significantly in the area over this area; particularly southern Jackson County, eastern
the past few years. White County, and Woodruff Counties.
This area east of the ridge generally has abundant, The following constitute the range of allocated values for
shallow, and quality groundwater which contributes to Region 1:
generally higher land values than some other parts of the
TENNESSEE
state. Although this area has a high percentage of irrigated Region 1 Cropland Values (Current)
lands, state geologists say groundwater recharge from the
Low Average High
Mississippi River and other area rivers replaces most or all
of the withdrawal caused by heavy pumping during the Cropland A $5000/acre $6000/acre $7100/acre
growing season (the only exception is land on or very near Cropland B $3800/acre $4600/acre $5500/acre
Crowley’s Ridge, where groundwater availability can be
sporadic). Cropland C $3300/acre $3700/acre $4100/acre
The other market to identify within Region 1 constitutes
the row crop agricultural area situated west of Crowley’s
Behind the Numbers
The population set was comprised of properties that
Ridge and runs south to Interstate 40. The cropland in this
sold from January 1, 2021 to the end of 2021, were larger
area ranges from versatile silt loam soils to heavy clay soils.
than 40 acres in size, and were primarily cropland tracts.
In the market west of the ridge, the higher values have –
210 sales which occurred in Region 1 were analyzed. The
for the last several years – come from the northern end
allocated values from each category were sorted smallest
of this territory (western Craighead and eastern Lawrence
to largest, then the top five and bottom five indications
Continued on next page
2022 Mid-South Land Values & Lease Trends Report 15ARKANSAS
LOUISIANA
MISSISSIPPI
TENNESSEE
16 American Society of Farm Managers and Rural Appraisers®Arkansas Region 1 Cropland Values
continued
were removed from consideration. The “High” value for Cropland Rents for Region 1
each category was calculated based on the average of In eastern Arkansas, farm rents are predominately crop
the remaining 20 highest indications; the “Low” value for share whereby the landowner receives a portion of the
each category was calculated based on the average of the crop. In some instances, crop input costs are shared
remaining 20 lowest indications. between the landowner and the tenant; however, the
predominant arrangement is a “net” share where the
Although Cropland A indicates a High of $7100/acre,
ARKANSAS
landowner does not contribute to input costs. As a
it should be noted that this is simply an average of the
general statement for the Mid-South, crop-share leases,
top 20 value indications; in reality, there were 13 sales
over time, have resulted in a higher landowner return
that indicated Cropland A values higher than $7100 and
than cash rents. 25% net crop share is the most common
ranged from $7179/acre to $8771/acre for the Cropland A.
leasing rate for Region 1. Some landowners, particularly
Next we’ll compare the current range with the range institutional investors, prefer fixed cash rent or “flex”
indicated from last year’s publication: rent. Flex rent usually has a base cash rent with additional
rent due at harvest depending on yield and crop price.
Region 1 Cropland Values (Last Year) Cash rents in Region 1 commonly reach $180 per acre for
prime, leveled farmland. However, in certain areas where
Low Average High competition among farmers for good farms is high, rents
LOUISIANA
Cropland A $4900/acre $5500/acre $6400/acre can top $200 per acre. Non-irrigated land with marginal
soils are often in the $100 per acre range. Since 2015 (and
Cropland B $3800/acre $4300/acre $4900/acre due to relatively low commodity prices since that time)
Cropland C $3000/acre $3500/acre $3800/acre cash rents have been basically flat/unchanged. However,
significant increases in commodity prices during late 2020
could generate cash rent increases for 2021. The reader is
Compared to last year’s Region 1 range, each of the encouraged to contact an Accredited Farm Manager for a
categories have increased in value. more specific discussion of the land rental market.
MISSISSIPPI
TENNESSEE
2022 Mid-South Land Values & Lease Trends Report 17ARKANSAS
LOUISIANA
MISSISSIPPI
TENNESSEE
18 American Society of Farm Managers and Rural Appraisers®Arkansas Region 2
Cropland Values
In the following discussion, Arkansas’ Region 2 constitutes
all the Delta area (the row crop producing area of Arkansas
located on either side of Crowley’s Ridge) within the state
situated south of Interstate 40. Like Region 1, Region 2
ARKANSAS
is a very broad region, ranging anywhere from highly-
productive sandy loam soils that have historically produced
cotton to the heavy clay soils of rice and soybean farms.
One of the sub-markets within Region 2 that merits some
additional discussion is the Grand Prairie area of eastern
Arkansas. The Grand Prairie stretches from the north-
central part of Lonoke County in the northwest to near
the confluence of the White and Arkansas Rivers in the
southeast. This market area is a rice, soybean, corn, and
wheat producing area. Soils are primarily silt loam to clay
LOUISIANA
soils with Class II or III capability classifications. In much of
the Grand Prairie area, the limited availability and depth to
groundwater has a significant impact on production and
cost of production. Groundwater limitations have brought
about reservoirs, water recovery systems, and a large water
diversion project from White River. Market participants Behind the Numbers
on the Prairie are primarily local landowner and/or The population set was comprised of properties that
operators or local investors. Stuttgart is the trade center sold from January 1, 2021 to the end of 2021, were larger
for the Grand Prairie and touts itself as the “Rice and Duck than 40 acres in size, and were primarily cropland tracts.
Capital of the World”; recreational duck hunting is a major 143 sales which occurred in Region 2 were analyzed. The
influence in many parts of the Prairie. Historically, this is an allocated values from each category were sorted smallest
MISSISSIPPI
area (when compared to other Arkansas production areas) to largest, then the top five and bottom five indications
that typically sees relatively little sales volume year to year. were removed from consideration. The “High” value for
each category was calculated based on the average of
The rest of Region 2 (located south of I-40, on either side the remaining 20 highest indications; the “Low” value for
of the Grand Prairie, and all the way into the southeastern each category was calculated based on the average of the
corner of the state) is a diverse area: from very good remaining 20 lowest indications.
versatile soils to limited heavy clay soils. Over the past
twelve months, there has been a significant increase in Although Cropland A indicates a High of $6100/acre,
sales activity in the southeastern portions of the state. This it should be noted that this is simply an average of the
increased activity is immediately following a year (2020) top 20 value indications; in reality, there were 12 sales
when sales activity across Region 1 was noticeably low. that indicated Cropland A values higher than $6050 and
TENNESSEE
Values across Region 2 have increased, but perhaps none ranged from $6170/acre to $7521/acre.
as aggressively as those in the SE portions of the Region.
Next we’ll compare the current range with the range
The following constitute the range of allocated values for indicated from last year’s publication:
Region 2:
Region 2 Cropland Values (Last Year)
Region 2 Cropland Values (Current)
Low Average High
Low Average High
Cropland A $4700/acre $5100/acre $5700/acre
Cropland A $4900/acre $5500/acre $6100/acre
Cropland B $3750/acre $4100/acre $4600/acre
Cropland B $3800/acre $4500/acre $5200/acre
Cropland C $3000/acre $3400/acre $3800/acre
Cropland C $3200/acre $3600/acre $3900/acre
Compared to last year’s Region 2 range, each of the
categories have increased in value.
Continued on next page
2022 Mid-South Land Values & Lease Trends Report 19ARKANSAS
LOUISIANA
MISSISSIPPI
TENNESSEE
20 American Society of Farm Managers and Rural Appraisers®Arkansas Region 2 Land Classifications and Sales
continued
Cropland Rents for Region 2 Region 2 generally has larger operators, larger blocks of
In eastern Arkansas, farm rents are predominately crop land, and less competition for land compared to other
share whereby the landowner receives a portion of the areas. All these factors and others may contribute to lower
crop. In some instances, crop input costs are shared crop share percentages. Some landowners, particularly
between the landowner and the tenant; however, the institutional investors, prefer fixed cash rent or “flex”
predominant arrangement is a “net” share where the rent. Flex rent usually has a base cash rent with additional
rent due at harvest depending on yield and crop price.
ARKANSAS
landowner does not contribute to input costs. As a
general statement for the Mid-South, crop-share leases, Cash rents in Region 2 commonly reach $160 per acre for
over time, have resulted in a higher landowner return than prime, leveled farmland. However, in certain areas where
cash rents. 20 to 25% net crop share is the most common competition among farmers for good farms is high, rents
leasing rate for Region 2. In general, Region 2 has an can top $200 per acre. Non-irrigated land with marginal
increased number of 20% net rents the farther west one soils are often in the $80 per acre range. Since 2015 (and
travels from the Mississippi River. Areas like the Grand due to relatively low commodity prices since that time)
Prairie have higher water costs and water issues. Grain cash rents have been basically flat/unchanged. However,
basis is normally higher at elevators located along the significant increases in commodity prices during late 2020
Mississippi River compared to elevators on the Arkansas could generate cash rent increases for 2021. The reader is
River near Little Rock, Pine Bluff, or the interior of Region encouraged to contact an Accredited Farm Manager for a
more specific discussion of the land rental market.
LOUISIANA
2. This contributes to higher profitability on farms closer
to the Mississippi River. Outside of the Grand Prairie,
MISSISSIPPI
TENNESSEE
2022 Mid-South Land Values & Lease Trends Report 21ARKANSAS
LOUISIANA
MISSISSIPPI
TENNESSEE
22 American Society of Farm Managers and Rural Appraisers®Arkansas Regions 3 & 4
Land Classifications and Sales
The following analysis addresses Regions 3 and 4.
Geographically, these regions are located in Western/
Central Arkansas. Region 3 is located south of Interstate
40 and Region 4 is located north of Interstate 40.
ARKANSAS
The predominant agriculture in these two Regions are
comprised of cattle, timber, swine, and poultry (primarily
broilers but includes pullets, breeder hens, and turkeys).
The cattle and timber farms are typically individually
owned, while the swine and poultry farms are vertically
integrated. The poultry sector is the largest income
producer of the four.
Beef Cattle
Arkansas’ cattle is 1,770,000, with 23,500+ farms The Complexes that have “tray pack” contracts have
LOUISIANA
producing cattle. Arkansas ranks 12th nationally in beef been the least affected. Tray packs supply the grocery
cows on farms. store chains.
Swine The CARES ACT provided some relief for the poultry
More than 1.2 million pigs are produced in Arkansas farmers. Growers that had Small Business Administration
annually. The total value of Arkansas pork production (SBA) guaranteed loans, as a part of the CARES ACT, had
exceeds $100 million per year. The only swine integrator 50% of their annual payments paid in 2020 and another
in the state is JBS. 95% or more of the swine in Arkansas 25% in 2021.
are grown under contract. Arkansas ranks #18 in swine
production in the U.S. SBA also implemented the Paycheck Protection Program
(PPP). Many growers benefited from this program with an
Broilers average loan size of $25,000; if the loan funds were used
MISSISSIPPI
Based on 2020 data there were 1,049,700,000 birds for approved purposes, the loans were forgiven.
produced.
The USDA implemented a program whereby if your 2020
Turkeys gross income was less than your 2019 gross, the grower
Based on 2020 data there were 31,000,000 birds produced. was paid that difference.
COVID-19 Impact on Poultry In the second Stimulus Bill there was an amendment
The protein sector has been impacted by COVID-19 in concerning UDSA-FSA guaranteed and direct loans. The
agriculture. This is due to the processing plants that each language in the bill stated that any Socially Disadvantaged
Integrator/Complex own/operate. The processing plants (SDA) farmer/grower that had either a FSA guaranteed loan
have numerous employees working in close proximity to or a FSA Direct loan would be 100% forgiven plus 20% to
TENNESSEE
each other. allow for taxes. As of this date a Federal Court has issued
an injunction. In the event the injunction is lifted hundreds
To date there have been no processing plant closures in if not thousands of farmers/growers will have their farms
Arkansas. However, the supply/demand chain has been an paid in full.
issue. The supply has outpaced the demand due to school
and restaurant closings and the general public not going Further impact to the poultry industry related to COVID-19
out to eat. is the cost of construction. Pre COVID-19 the cost to
construct a broiler house was in the $12.50 - $13.00 / sf
When the processing plant’s freezers reached capacity, range. Based on recent construction bids the cost has
it has been reported the flocks were euthanized. On increased to $17.50/sf. This equates to a 35% increase
the breeder hen farms, flocks have been pulled early to which has seriously impacted the cash flow.
decrease hatch eggs, which decreased bird placements in
the broiler houses. In addition, the out times for the broiler In summary, the poultry industry has been impacted by
houses are running 45-60 days in some Complexes. This the events of the past two years. To what extent this carries
results in fewer flocks for the grower. over into 2022 in an unknown at this time.
Continued on next page
2022 Mid-South Land Values & Lease Trends Report 23Arkansas Regions 3 & 4 Land
Classifications and Sales
continued
Timber
Arkansas has over 19 million acres of forest land
representing 56% of the total land base: 69% is owned by
private landowners, 19% is publicly owned (13% is national
forest which is largest in the south), and 12% is owned by
ARKANSAS
the forestry industry.
Arkansas is the 4th largest softwood lumber producing
state in the U.S., #4 in production of pine seedlings, and
#1 in production of hardwood seedlings.
LOUISIANA
MISSISSIPPI
TENNESSEE
Continued on next page
24 American Society of Farm Managers and Rural Appraisers®Arkansas Regions 3 & 4 Land Classifications and Sales
continued
Poultry After considering the above criteria, the pasture acreage is
It is the leading industry of Arkansas animal agriculture divided between the following categories:
providing 44.6% of the state’s total agriculture receipts. • Pasture “A” – Most desirable, well maintained, and
This industry provides over 138,000 jobs with 5,800 farms productive pasture in the market area.
raising some type of poultry. • Pasture “B” – Average desirability and productivity
in the market area with average maintained.
The state was 2nd in the nation (behind Georgia) in • Pasture “C” – Below-average desirability and
ARKANSAS
terms of broiler production in 2018 with the production productivity and typically fair to poor maintained.
of over 1 billion broilers weighing 7.3 billion pounds and • Woods – Typically very little to no marketable
a production value of over $4 billion per year. Benton timber value. In the event there is a significant
County, AR is the 7th largest poultry and egg producing amount of marketable timber, then a cruise is
county in the U.S. relied upon.
In 2018, Arkansas ranked 3rd in the US in turkey Based on the sales data reviewed during 2020, following
production and 7th in egg production. Turkey production are the average land prices for each land class;
is concentrated in the northwest and north central areas
of the state.
Region 3 & 4 Land Values
The poultry production is vertically integrated with various
LOUISIANA
Region 3 Region 4
Integrators, including but not limited to:
• Tyson Foods Pasture A $2,775/acre $4,850/acre
• OK Foods Pasture B $2,100/acre $3,700/acre
• Wayne Farms
• Pilgrim’s Pride Pasture C $1,795/acre $3,175/acre
• PECO Woods $1,775/acre $2,900/acre
• Simmons Foods
• Ozark Mountain Poultry As previously mentioned, the poultry farms in Western
– Recently purchased by George’s Arkansas are the largest segment of farm income.
• George’s Therefore, the following data is in reference to poultry
MISSISSIPPI
• Cobb (primary breeding stock) broiler houses and what the average contributory values
• Butterball (turkey) are. In estimating the contributory value of a poultry
• Cargill (turkey) house, the most critical piece(s) of information you must
Both Regions 3 and 4 encompass a large geographic have are as follows:
area and within these regions there are certain areas that • Actual age of the house and equipment
the land value is much higher than the average regional • Effective age of the house and equipment
values. For example, the very NW portion of Region 4 • The remaining economic life of the house
(Washington and Benton counties) has much higher land and equipment
values than the eastern or southern boundary of Region 4. Most farm appraisers in Arkansas use 30 years as the total
In estimating the average land values for these regions, economic life of a poultry house when applying the above
TENNESSEE
all available sales data for 2021 was analyzed. The typical related ages.
make up of a comparable sale has both pasture as well as While on most improvements on a farm such as a dwelling
wooded acreage. In determining the value that the pasture or shop/shed, the straight line depreciation method
acreage contributes, the following factors are considered is acceptable. For example, a typical dwelling has a
for adequacy, quality, and quantity in classifying the physical life of 60 years which would equate 1.7% per year
pasture quality: depreciation, most farm sheds and barns have a 40-year
1) Perimeter & cross fencing physical life or 2.5% annual depreciation. However, using
2) Cattle working pens the straight line depreciation method for poultry houses is
3) Ponds/creeks/rivers for water availability not only unacceptable, but also wrong.
4) Type/quantity of grass
5) Prevalence of noxious weeds As proven by years of sales data, the newer the poultry
6) Soil classes facility, the lesser the rate of annual depreciation.
7) Location Conversely, as the poultry houses increase in age, the
8) Topography / Flood zones annual depreciation rate increases and eventually levels
9) Access off at approximately 3.30% per year.
Continued on next page
2022 Mid-South Land Values & Lease Trends Report 25Arkansas Regions 3 & 4 Land Classifications and Sales
continued
For this reason, the contributory values of poultry houses
have been broken down into four age groups;
• 0 – 5 years old
• 6 – 10 years old
• 11 – 15 years old
ARKANSAS
• > than 15 years old
The following data reflects the average contributory
value on a square footage basis and the average annual
depreciation rate for each region.
Region 3 Region 4
Contributory Values & Depreciation Rates Contributory Values & Depreciation Rates
Contributory Depreciation Negative Contributory Depreciation Negative
Value Rate External Value Rate External
LOUISIANA
0-5 Years Old $13.44/sf 2.91%/year 0% 0-5 Years Old $13.51/sf 2.80%/year 0%
6-10 Years Old $9.27/sf 3.24%/year 0% 6-10 Years Old $10.67/sf 3.30%/year 0%
11-15 Years Old $8.38/sf 3.23%/year 0% 11-15 Years Old $8.96/sf 3.28%/year 0%
>15 Years Old $4.46/sf 2.20%/year 0% >15 Years Old $5.64/sf 3.25%/year 0%
MISSISSIPPI
TENNESSEE
26 American Society of Farm Managers and Rural Appraisers®Thoughts on 2022
Scott Stiles, University of Arkansas Economist
It seems like there’s no downtime or “off season” in While we are expecting positive margins in 2022, they
farming anymore. As soon as one crop is harvested, it’s will be greatly reduced from 2021. USDA provided its first
time to start preparing for next year’s crop. Already, glimpse at the 2022 crop season in its recent November
projections for 2022 crop acreage have begun to surface. Baseline projections. For corn, USDA projects the 2022/23
Early indications point to more soybean and cotton acres season-average price to fall to $4.80 per bushel, 65 cents
ARKANSAS
in the upcoming year. With December 2022 cotton futures below the 2021 price estimate. Likewise, USDA expects
currently trading near 90 cents, prices reflect historically average grower prices to fall in 2022/23 for soybeans,
tight U.S. stocks and concerns about La Nina’s impact on cotton and long-grain rice, with season-average prices
Texas production. projected at $10.50, $0.80 and $12.50/cwt. respectively.
While soybean prices remain somewhat attractive above
$12, the real attraction to soybeans may be in the dramatic Commodity Price Outlook
rise in input costs over the past year. In mid-December, for 2021 and 2022
retail Urea prices hovered around $900 per ton, DAP at
$840, and potash was $790 per ton. Compared to a year Commodity Unit 2021/22 2022/23
ago, Urea prices have shot up almost 150%, DAP is up 72%,
LOUISIANA
Corn bu. $5.45 $4.80
and potash is up 125%. Fertilizer prices have increased
due to tightening supplies, supply chain problems, higher
Soybeans bu. $12.35 $10.50
freight costs, international trade restrictions, and increased
demand driven by higher grain prices. Cotton lbs. $0.90 $0.80
Not only are fertilizer costs higher, but ag chemicals, and
Long-Grain Rice cwt. $13.00 $12.50
seed costs are projected to increase as well in in 2022.
Machinery and land costs are also on the rise. The higher Source:
input costs are squeezing crop margins for 2022 in what USDA Agricultural Projections to 2031, November 5, 2021.
looks to be the most expensive year on record for growers.
Planning for the 2022 season is more urgent than usual At face value, USDA’s projections indicate crop revenues in
MISSISSIPPI
due to rising costs, potential input supply constraints, the 2022 marketing year will be lower than those in 2021.
and commodity price volatility. We at the University of Higher input costs will squeeze profit margins even more
Arkansas remind everyone that our 2022 crop budgets in the coming year. The extent of that squeeze will depend
are available at www.uaex.uada.edu. With the dramatic on producers’ abilities to manage costs and capture
shifts in input costs over the past year, we encourage pricing opportunities from the markets. Current futures
growers to revisit their cost of production budgets and try prices are offering growers opportunities above USDA’s
to determine potential 2022 margins. Toward this effort, price projections for the upcoming year. In many ways
growers should secure input supplies when possible, lock this “off season” will be business as usual—dealing with
in input prices, and hedge 2022 crop production in order volatility and many variables. For 2022 to have a positive
to capture margins and take risk off the table. outcome, forward planning is crucial.
Need a Farmland Manager? TENNESSEE
Looking to Sell or Buy Farmland?
Need a Farmland Appraisal?
Find a Pro
Contact one of the professionals
listed in the Membership Directory
at the back of this report.
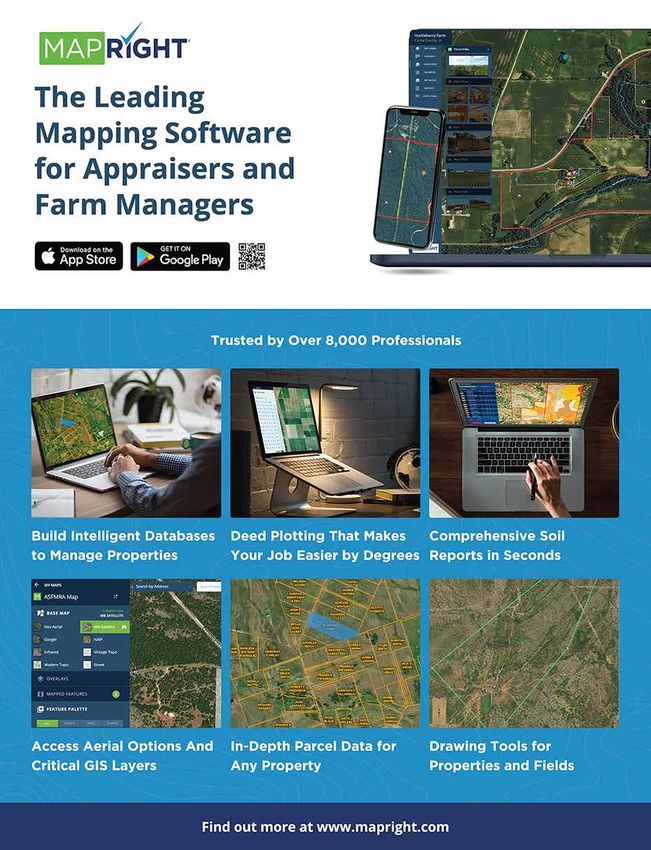
2022 Mid-South Land Values & Lease Trends Report 27Gain a Deeper Understanding with MapRight’s
Powerful GIS Mapping Software
Steve Roberson, CEO/Founder, MapRight
Professionals in virtually any industry can benefit from the Build Custom Databases
insights that GIS-based mapping software has to offer, but Maps are uniquely suited to visually analyzing spatial
there’s a catch: these tools can be far too expensive and patterns, especially when there is a real-world component
ARKANSAS
complex to actually use. That’s why MapRight was built - to the dataset. On any MapRight map, you have the ability
to take the technical aspects out of GIS so those looking to build custom proprietary geographic databases. These
to market real estate, map large properties, and visually databases give users full control over what attributes they
analyze spatial data of all kinds without having to first learn track on their maps, including which details are recorded
the intricacies of this technology. In other words, the purpose about each item (such as price, year built, acreage, etc).
of MapRight is to flatten the technical learning curve, to help Organization is extremely important. To this end, MapRight
professionals quickly and easily get to the information that users can label, style, and color-code items within a certain
serves them best. feature group, allowing them to not only control how data
Create Fully Customizable Maps is visually displayed but also making it far easier to identify
Every property is unique; therefore, every map is different. trends. For example, a user who is keeping track of price-
What is shown on your map will vary depending on what per-acre on properties could easily visualize those pricing
LOUISIANA
your objective is; those in agriculture may need data on differences on their map. Those dealing in real estate
soil and water features, real estate professionals may even have the option to search parcels by APN number,
need information on parcel size and land boundaries, and landowner name, or coordinate location to find parcels that
developers may be interested in learning about land use match a query within a selected radius of a property.
and surrounding infrastructure. Easily Share Your Insights
In order to serve such a wide range of professionals, Regardless of your profession or the intended use of your
MapRight allows users to decide exactly what is shown on map, you’ll likely want to share your insights and analysis with
their maps, so that the maps themselves become a tool for colleagues/clients at some point: With MapRight, sharing
the professional – customizable, selective, and – like the your map with others is easy. Once the map is completed
property itself – unique. Unlike many GIS mapping solutions and customized to your satisfaction, you can share it as a
on the market, MapRight maps are versatile and fully high-resolution PDF or PNG, send it as an interactive map
MISSISSIPPI
customizable, allowing for the addition of project-specific via email or text, or upload it to your website with the embed
data paired with critical datasets and spatial analysis tools. script MapRight provides. The best part is, if at any time you
MapRight empowers the user to become intensely familiar decide to update or edit your map, those changes will appear
with their project in a matter of minutes. everywhere — even if the map has already been shared.
Users can draw custom shapes, create set-backs, divide land Take Your Maps On The Go
parcels, and measure area and distance with easy-to-use Desktop applications are incredibly useful, but most people
measurement tools thereby precisely depicting property can’t bring their computers with them when they’re in the
lines, pastures, roads, and more. Labels and icons are easily field. That’s why MapRight offers a mobile application for
added and extremely customizable, enabling viewers to both Android and iOS that retains all the functionality and
spatially understand the most important elements of the versatility of the web app. Plus, the mobile app offers a few
property. To further help viewers understand the land, users additional features, as well. You can track your location on
TENNESSEE
can even attach drone photography, 360° panoramas, and the map and save tours, take photos and attach them to
videos to precise locations on their map. your location, save maps to use offline, and even get driving
Combine A Wide Range Of Data Sources directions to specific points on the map.
While customizations are a great place to start, customizations GIS-based mapping software is a valuable asset for anyone
alone do not create a strong map — you also need data. with a vested interest in the land we live and work on; now
While there are massive quantities of data currently in you can keep this powerful tool right in your back pocket. To
existence, gathering what you actually need for analysis can learn more about MapRight and how it will help make your
be challenging. The issue is that this data comes in multiple job a bit easier, we recommend signing up for a 7-day free
different formats and from multiple different sources, making trial of MapRight. It only takes a few minutes to create your
it difficult to draw conclusions. MapRight consolidates these first map.
data sources, synthesizes and styles them so they are easier
SPECIAL INTEREST
Don’t be satisfied with a one-size-fits-all mapping program.
to view, and organizes them into a single, interactive map. There are many software options that simply provide aerial
The result is a professional, easy-to-understand map for your imagery – but with MapRight, your maps can be so much
clients and colleagues. The software offers nine base layers, more: MapRight empowers you to easily create the maps you
over two dozen GIS layers, in-depth parcel data, near-instant want, rather than forcing you to settle for the maps you get.
soil reports, and—if you still don’t see what you need - you Maps tell a story – MapRight can help you tell a better one.
can upload your own data as well.
28 American Society of Farm Managers and Rural Appraisers®You can also read