2022 Global Automotive Consumer Study - Key Findings: India January 2022 - Deloitte
←
→
Page content transcription
If your browser does not render page correctly, please read the page content below
2022 Global Automotive Consumer Study
Key Findings: India
January 2022
Copyright © 2022 Deloitte Development LLC. All rights reserved.   2022 Deloitte Global Automotive Consumer Study
About the study
The 2022 study includes more than 26,000 consumer responses from 25 countries around the world.

 North America                           Sample                     EMEA                  Sample   Asia-Pacific                         Sample

 Canada (CA)                               1,005                    Austria (AT)          1,042    Australia (AU)                         1,027
 Mexico (MX)                               1,003                    Belgium (BE)          1,046    China (CN)                             1,022
 United States (US)                        1,031                    Czech Republic (CZ)   1,006    India (IN)                             1,006
                                                                    France (FR)           1,005    Indonesia (ID)                         1,001
                                                                    Germany (DE)          1,507    Japan (JP)                             1,000
                                                                    Italy (IT)            1,003    Malaysia (MY)                          1,005
                                                                    Poland (PL)           1,007    Philippines (PH)                       1,007
                                                                    Romania (RO)           846     Republic of Korea (KR)                 1,012
                                                                    South Africa (ZA)     1,011    Singapore (SG)                         1,015
                                                                    Spain (ES)            1,013    Thailand (TH)                          1,004
                                                                    United Kingdom (GB)   1,506    Vietnam (VN)                           1,017

 Study methodology
 The study is fielded using an online panel methodology where consumers of driving age are invited to complete the questionnaire
 (translated into local languages) via email.

Note: “Sample” represents the number of survey respondents in each country.
                                                                                                                                                                     2
Copyright © 2022 Deloitte Development LLC. All rights reserved.                                                     2022 Deloitte Global Automotive Consumer Study
Sample distribution - India
Age groups Gender Living area
7% Rural
55 or 48% 13% Suburban
older 18-34
17%
49%
34% 80% Urban
52%
35-54
Sum of %s in few slides may not add to 100% due to rounding
Sample size: n= 1,006
Copyright © 2022 Deloitte Development LLC. All rights reserved. 2022 Deloitte Global Automotive Consumer Study 3Agenda Topic Slide No. Advanced technologies 5 Technology in focus: vehicle electrification 8 Future vehicle intentions 16 Mobility applications 23 Mobility services 27 Copyright © 2022 Deloitte Development LLC. All rights reserved. 2022 Deloitte Global Automotive Consumer Study 4
Advanced
technologies

               5
Consumers are willing to pay more for automotive technologies, but only up
to 1,00,000 rupees – is it enough to generate a compelling ROI for OEMs?
Willingness to pay for technologies
13% 15% 18%
24% 23%
30%
37% 34%
39% 41%
47%
43% 43%
31% 30%
10% 6% 6% 6% 5%
Infotainment Autonomous technologies Connected technologies Safety technologies Alternative engine
technologies technologies
I wouldn’t pay more Less than INR 25,000 INR 25,000 to less than INR 1,00,000 INR 1 lakh or more
Q3. How much more would you be willing to pay for a vehicle that had each of the technologies listed below?
Sample size: n= 989 India
Copyright © 2022 Deloitte Development LLC. All rights reserved. 2022 Deloitte Global Automotive Consumer Study 6Consumers, by and large, are ready to share personal data generated from a
connected vehicle.
Interest (somewhat/very interested) in a connected vehicle if it provides benefits related to
Maintenance updates and vehicle health reporting 84%
Updates to improve road safety and prevent potential collisions 83%
Updates regarding traffic congestion and suggested alternate routes 83%
Suggestions regarding safer routes 82%
Customized/optimized vehicle insurance plan 82%
Customized suggestions regarding ways to minimize service expenses 82%
Maintenance cost forecasts based on your driving habits 81%
Access to nearby parking 80%
Over-the-air vehicle software updates 77%
Receiving a discount for access to a Wi-Fi connection in your vehicle 77%
Special offers regarding non-automotive products and services related to
your journey or destination
75%
Q34. How interested are you in the following benefits of a connected vehicle if it meant sharing your own personal data and vehicle/operational data with the manufacturer or a third party?
Sample size: n= 910 India
Copyright © 2022 Deloitte Development LLC. All rights reserved. 2022 Deloitte Global Automotive Consumer Study 7Vehicle
electrification
8More than a third of consumers are interested in electrified vehicles,
(particularly hybrids) – are we moving fast enough toward an EV future?
Type of engine in next vehicle
Gasoline/Diesel 58%
Hybrid Electric (HEV) 21%
Plug-in Hybrid Electric (PHEV) 11%
All-Battery Powered Electric (BEV) 5%
Other 6%
Note: “Other” includes engine types such as compressed natural gas, ethanol, and hydrogen fuel cells; did not consider “don’t know” responses
Q25. What type of engine would you prefer in your next vehicle?
Sample size: n= 895 India
Copyright © 2022 Deloitte Development LLC. All rights reserved. 2022 Deloitte Global Automotive Consumer Study 9EV intenders are not that different than their ICE peers in terms of what
they expect to pay for their next vehicle (i.e., less than INR 25 lakhs).
Price ranges in which consumers prefer to shop for next vehicle
Gasoline Electric
Overall
(Petrol + Diesel) (HEV+PHEV+BEV)
Less than INR 5,00,000 6%
6% 3%
INR 5,00,000 to less than
22%
INR 10,00,000 24% 17%
INR 10,00,000 to less 78% 77% 78%
27%
than INR 15,00,000 26% 27%
INR 15,00,000 to less
24%
than INR 25,00,000 21% 30%
INR 25,00,000 to less
15%
than INR 50,00,000 15% 16%
INR 50,00,000 or more 6%
7% 6%
Don't know/not sure 1%
1% 0%
Q21. In which of the following price ranges will you be shopping for your next vehicle? (Please indicate what you would expect to pay after any discounts and/or incentives that might be available).
Sample size: Overall= 910; Gasoline= 515; Electric= 330 India
Copyright © 2022 Deloitte Development LLC. All rights reserved. 2022 Deloitte Global Automotive Consumer Study 10The draw for EVs centers on a consumer perception that they are better for
environment while lowering fuel costs.
53% 45%
Lower fuel cost Less maintenance
59% 46% 29%
Better driving
Concern about Government
experience incentives / stimulus
climate change /
programs
reduced
emissions
46% 21%
Concern about Potential for extra
personal health taxes/levies applied
to internal
combustion vehicles
Q26. Please rank the following factors in terms of their impact on your decision to acquire an electrified vehicle (highest to lowest).
Sample size: n= 331 India
Copyright © 2022 Deloitte Development LLC. All rights reserved. 2022 Deloitte Global Automotive Consumer Study 11More than one-third of EV intenders would rethink their purchase decision if
the price of electricity was similar to fossil fuels.
Decision to purchase an electrified vehicle change if the electricity used for mobility was priced similar to current fossil fuels
Said they would still be very interested in acquiring
61% an electrified vehicle even if the electricity used for
mobility was priced like current fossil fuels
37% Said they would rethink their decision to acquire an
electrified vehicle
2% Said they are unsure (don’t know)
Q30. Would your decision to purchase an electrified vehicle change if the electricity used for mobility was priced similar to current fossil fuels?
Sample size: n= 143 India
Copyright © 2022 Deloitte Development LLC. All rights reserved. 2022 Deloitte Global Automotive Consumer Study 12Most intenders plan to treat their EVs like their smartphones (charging at
home, at night) which means incurring the cost of charging equipment.
Reasons for not charging the Expecting to charge electrified Intending to charge electric vehicles
electrified vehicle at home vehicle most often at… at home using…
Other,
On-street / public
0%
charging station,
Cost of installing a private 15% 47%
charging station at home is 31%
prohibitive 39%
No possibility to install an Work,
electric vehicle charger at 26%
home
9%
Not sure how to go about
installing an electric vehicle 23% 14%
charger at home
Not interested in installing a Home, 0%
private charging station at 17% 76%
home
Connect to Connect to Both Don’t know
regular power alternative
Other 3% grid power source
Consumers should
Don’t know 0% factor home charging
into a total cost of Questions remain around the
ownership model pressure EVs will create on
the existing power grid
Q27. Where do you expect to charge your electrified vehicle most often?; Q28. How do you intend to charge your electrified
vehicle at home?; Q29. What is the main reason you do not intend to charge your electrified vehicle at home?
Sample size: n= 143 [Q27]; 108 [Q28]; 35 [Q29] India
Copyright © 2022 Deloitte Development LLC. All rights reserved. 2022 Deloitte Global Automotive Consumer Study 13Consumers are still being turned off EVs due to lingering concerns around a
lack of public charging infrastructure, safety of battery technology, and cost.
Greatest concern regarding all battery-powered electric vehicles
Lack of public electric vehicle charging infrastructure 23%
Safety concerns with battery technology 14%
Cost/price premium 12%
Time required to charge 11%
Driving range 10%
Lack of sustainability 8%
Lack of alternate power source at home 6%
Potential for extra taxes/levies associated with all-BEVs 5%
Lack of charger at home 4%
Consumers expect driving
Uncertain resale value 4% range (in kms.)
Lack of choice 3%
445
Other 0% from a fully charged BEV
Don’t know 1%
Q31. What is your greatest concern regarding all battery-powered electric vehicles? Q32. How much driving range would a fully charged all-battery electric
vehicle need to have in order for you to consider acquiring one?
Sample size: n= 910 India
Sample size: n= 861
Copyright © 2022 Deloitte Development LLC. All rights reserved. 2022 Deloitte Global Automotive Consumer Study 14Finally, consumers appear to be divided on whether EVs are net positive vs.
ICE engines to the environment.
Comparison of all-battery electric vehicles with internal combustion vehicles from an environmental impact point of view
41%
28%
25%
17% 17%
14%
Significantly Somewhat Similar impact Somewhat Significantly
lower impact lower impact higher impact higher impact
Note: Did not consider “Don’t know” responses
Q33. In your opinion, how do all-battery electric vehicles compare to internal combustion vehicles from an environmental impact point of view?
Sample size: n= 894 India
Copyright © 2022 Deloitte Development LLC. All rights reserved. 2022 Deloitte Global Automotive Consumer Study 15Future vehicle
intentions
16COVID-19 has a higher impact on consumers, across age groups and living
area, as they plan to buy their next vehicle to avoid public transport.
COVID-19 to impact next vehicle purchase
Overall Age Group Living area
18-34 35-54 55 and older Urban Suburban/
Rural
No, I will purchase my next
36% 37% 35% 38% 37% 33%
vehicle as planned
Yes, I will buy one to avoid public
transportation
45% 44% 48% 42% 46% 43%
Yes, I no longer need multiple
vehicles in my household
9% 8% 10% 12% 9% 10%
Yes, I no longer need a vehicle
due to extended home office 8% 10% 6% 7% 7% 12%
measures
Yes, other 1% 1% 1% 2% 1% 3%
Q15. Has the global COVID-19 pandemic had an impact on your decision to purchase your next vehicle?
Sample size: n= 1,006 [overall];490 [18-34], 343 [35-54], 173 [55 and older]; 806 [urban], 200 [suburban/rural] India
Copyright © 2022 Deloitte Development LLC. All rights reserved. 2022 Deloitte Global Automotive Consumer Study 174 in 10 consumers plan to take out a loan for their next vehicle with
preferred term durations ranging from 1-4 years.
Planning to pay for next vehicle through
Preferred loan duration in months
Loan contract 43% 37%
27%
19%
13%
Cash payment 38%
2% 2% 1%
< 12 12-24 25-36 37-48 49-60 > 60 Don’t
Leasing contract without
9% mo. mo. mo. mo. mo. mo. know
complementary services
Preferred lease duration in months
Leasing contract with
8% 24% 24%
complementary services 20%
19%
7%
Vehicle subscription* 3% 2% 2% 1%
< 12 12-18 19-24 25-30 31-36 37-42 > 42 Don’t
mo. mo. mo. mo. mo. mo. mo. know
Note: “complementary services” include service and maintenance, insurance; * includes mid/long-term rental contract/other
Q22. How do you plan to pay for your next vehicle?; Q23. What is your preferred finance duration?; Q24. What is your preferred lease duration?
Sample size: n= 910 [Q22]; 387 [Q23]; 153 [Q24] India
Copyright © 2022 Deloitte Development LLC. All rights reserved. 2022 Deloitte Global Automotive Consumer Study 18Consumers still want to acquire their next vehicle via an in-person
experience.
Most preferred way to acquire next vehicle
1% 0% 1% 2%
10% 10% 11% 8%
Don't know
15%
21% 22% 22%
Fully virtual process (i.e., online shopping,
digital document signing, vehicle drop-off)
75% Partially virtual process (i.e., online
69% 68% 66% shopping, physical test drive, digital
document signing)
In-person (i.e., face-to-face at the
dealership)
Overall 18-34 35-54 55 and older
Q35. How would you most prefer to acquire your next vehicle?
Sample size: n= 910 [overall]; 434 [18-34], 313 [35-54], 163 [55 and older] India
Copyright © 2022 Deloitte Development LLC. All rights reserved. 2022 Deloitte Global Automotive Consumer Study 19Even consumers who plan to purchase virtually prefer to buy from dealers.
Interest in third party retailers is higher among used vehicle buyers.
Prefer to acquire next vehicle via a virtual process from
Overall Age group
12% 6% 8%
54% 56%
63%
33% 37% 26%
18-34 35-54 55 and older
Manufacturer Authorized dealer
Third party retailer Other/Don’t know
Type of next vehicle
0%
6% 3%
29%
58%
45%
35% 24%
Q36. From whom would you most prefer to acquire your next vehicle via a virtual process?
New CPO + Other used
Sample size: n= 278 [overall]; 138 [18-34], 102 [35-54], 38 [55 and older]; new [240], CPO/Other used [38] India
Copyright © 2022 Deloitte Development LLC. All rights reserved. 2022 Deloitte Global Automotive Consumer Study 20Convenience coupled with ease of use are the main reasons for consumers to
consider a virtual process for acquiring their next vehicle.
Main reason to acquire next vehicle via a virtual process
32% At the time of survey
2021 2022 fielding, health concerns
28% appear to have been abating
27%
23% 23% 23%
22%
16%
5%
1%
0% 0%
Convenience Ease of use Speed of transaction Necessity (i.e., health General desire to Other
concerns about avoid going to a
physical interactions) dealer
Q37. What is the main reason you would prefer to acquire your next vehicle via a virtual process?
Sample size: n= 278 [2022], 350 [2021] India
Copyright © 2022 Deloitte Development LLC. All rights reserved. 2022 Deloitte Global Automotive Consumer Study 21But, at the end of the day, some things are simply hard to digitize as people
still need to see/drive a vehicle before they buy it.
Main reasons for being not interested in acquiring next vehicle via virtual process
I have to see the vehicle before I buy it 80%
I have to test drive the vehicle before I buy it 65%
I want to have my questions answered by a real person 44%
I prefer to negotiate the price of the vehicle in person 42%
38%
I don’t feel comfortable making such a big purchase online 41% I prefer to negotiate the
price of the vehicle in 41%
person
I would like to build a relationship with the dealer for service 38% 54%
The purchase experience is important to me 32%
18-34 35-54 55 and older
I want to have a personal contact in case something goes wrong 31%
The vehicle manufacturer’s / dealer’s online ordering process is too
28%
complicated
Q38. What are the main reasons you are not interested in acquiring your next vehicle via virtual process? (Select all that apply)
Sample size: n= 624 India
Copyright © 2022 Deloitte Development LLC. All rights reserved. 2022 Deloitte Global Automotive Consumer Study 22Mobility
applications
23Room for improvement exists for mobility app providers in offering multiple
services within the same app or risk consumers switching to different apps.
Percentage of consumers who think that
Disagree Disagree Disagree
7% 6% Neutral 13%
Neutral
12% 12%
Neutral
23%
Agree
64%
Agree Agree
81% 82%
Available smartphone apps Mobility apps should I don’t mind switching apps
provide sufficient mobility offer several different to use different types of
services services within one app mobility services
Q39. To what extent do you agree/disagree with the following statements?
Sample size: n= 1,006 India
Copyright © 2022 Deloitte Development LLC. All rights reserved. 2022 Deloitte Global Automotive Consumer Study 24At the same time, consumers, across age groups, assign the highest
importance to ease of use and types of services offered by the app.
Most important characteristics of a mobility app
1. Availability of multiple types of mobility service
Overall
2. Ease of use
3. Multiple payment options
1 Ease of use
18-34 4. Price
5. Proximity of available mobility services near me
6. Availability of pricing packages
2 Availability of multiple types of
mobility service
3 Multiple payment options 1. Ease of use
2. Availability of multiple types of mobility service
3. Multiple payment options
4 Price
35-54 4. Proximity of available mobility services near me
5. Price
6. Availability of pricing packages
5 Proximity of available mobility
services near me
6 Availability of pricing packages 1. Ease of use
2. Availability of multiple types of mobility service
3. Price
55+ 4. Proximity of available mobility services near me
5. Multiple payment options
6. Availability of pricing packages
Q41. Please rank the following characteristics of a mobility app in order from most to least important.
Sample size: n= 1,006 India
Copyright © 2022 Deloitte Development LLC. All rights reserved. 2022 Deloitte Global Automotive Consumer Study 25Consumers plan to use map and journey planning apps more frequently than
other transport-related apps.
Types of mobility apps planning to use
Map and journey planning apps Public transport specific apps Dedicated transport service apps Multimodal app offering various
offering a single mobility service mobility services
only
Never 1% 8% 5% 14%
A couple of times
9% 10% 9% 8%
per year
Once every few
12% 17% 17% 17%
months
A couple of times
15% 19% 24% 17%
per month
At least once a
22% 25% 24% 22%
week
A couple of times
39% 15% 18% 14%
per week
Don’t know 1% 7% 3% 7%
Q40. Looking forward, how often do you intend to use the following types of mobility apps?
Sample size: n=1,006 India
Copyright © 2022 Deloitte Development LLC. All rights reserved. 2022 Deloitte Global Automotive Consumer Study 26Mobility services
27More than a third of consumers use multiple transport modes in the same trip
at least once a week. Only 8% NEVER use multiple modes in the same trip.
Use of multiple modes of transportation in the same trip
Never 8%
A couple of times per year 19%
Once every few months 15%
A couple of times per month 19%
At least once a week 9%
A couple of times per week 15%
Every day 13%
Don’t know 1%
Q43. How often do you use multiple modes of transportation in the same trip (e.g., a trip using a subway, commuter train and your own vehicle)?
Sample size: n= 1,006 India
Copyright © 2022 Deloitte Development LLC. All rights reserved. 2022 Deloitte Global Automotive Consumer Study 28Personal vehicles remain the most used transportation mode while sharing
services like e-scooters/bikes are used relatively less often.
Frequency of usage of different modes of transportation
Personal vehicle 4%6% 6% 8% 10% 22% 44% 1%
Scheduled public transportation 5% 11% 16% 18% 17% 22% 9% 1%
On-demand public transportation 9% 11% 17% 18% 18% 16% 9% 2%
Ride-hailing 16% 11% 13% 17% 14% 17% 9% 4%
Car share (e.g., Zipcar, Share Now, Communauto) 22% 10% 13% 12% 14% 16% 10% 3%
Bike sharing service 32% 8% 10% 11% 14% 13% 8% 3%
Shared e-scooter (e.g., Bird, Lime) 34% 8% 10% 10% 11% 13% 10% 4%
Never A couple of times per year Once every few months A couple of times per month
At least once a week A couple of times per week Every day Don’t know
Q42. How frequently do you typically use the following modes of transportation?
Sample size: n=1,006 India
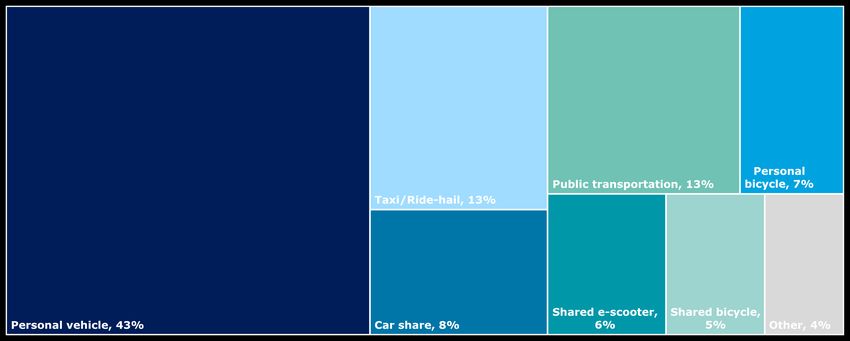
Copyright © 2022 Deloitte Development LLC. All rights reserved. 2022 Deloitte Global Automotive Consumer Study 29Going forward, personal vehicles are likely to remain the preferred mobility choice for consumers. Going forward, percentage of mobility needs will be met by Q44. Going forward, what percentage of your mobility needs will be addressed by each of the following types of transportation? Sample size: n= 1,006 India Copyright © 2022 Deloitte Development LLC. All rights reserved. 2022 Deloitte Global Automotive Consumer Study 30
Middle-aged consumers are interested in subscription services: different
brands, different models from same brand, and pre-owned vehicles.
Percentage of consumers who are somewhat/very interested in a subscription
service where they have the convenience and flexibility to periodically opt for …

                                                                                  Overall      18-34   35-54   55 and more                                  Y/Y change

                                                                                                                                     69%                                8
                                                           different pre-owned vehicles
                                                                                                                                      71%                               11
                                                                                                                                        75%                             2
                                                                                                                             50%                                        13

                                                                                                                                      72%                               6
                                                                  different brand of vehicle
                                                                                                                                      72%                              10
                                                                                                                                                81%                     1
                                                                                                                               57%                                     12

                                                                                                                                     70%                                1
                                     different vehicle model from same brand
                                                                                                                                     71%                                5
                                                                                                                                        76%                             7
                                                                                                                               57%
                                                                                                                                                                        10

Q45. How interested are you in each of the following scenarios?
Sample size: n= 1,006 [Overall]; 490 [18-34], 343 [35-54], 173 [55 and older]                                                                                                India

Copyright © 2022 Deloitte Development LLC. All rights reserved.                                                                       2022 Deloitte Global Automotive Consumer Study   31
Consumers are willing to pay more for a subscription with more than 4 in 10
saying they would pay up to 20% more than a regular lease.
Percentage of consumers who are willing to pay for …
different vehicle model from the same brand different brand of vehicle different pre-owned vehicles
30%
26%
26%
23%
17% 19% 20%
17% 17%
11% 13%
12% 13% 12%
10%
7%
5% 6% 5%6%
4%
I would expect to I would not expect Less than 10% 10% to less than 20% to less than 30% to less than 40% or more
pay less to pay more more 20% more 30% more 40% more
Q46. How much would you be willing to pay for each of the following services as compared to a regular vehicle lease?
Sample size: n= 893 India
Copyright © 2022 Deloitte Development LLC. All rights reserved. 2022 Deloitte Global Automotive Consumer Study 32OEMs are the most preferred choice to offer a “vehicle-as-a-service” solution
in the market.
Most trusted provider to offer a “vehicle-as-a-service” solution
44%
15% 13%
13%
8%
5%
3%
0%
Other
Startups
Large tech-companies
Vehicle rental
their captive finance
Mobility service
Independent financial
Don’t know
manufacturers and
companies
service providers
providers
Automotive
providers
Q48. Which of the following providers would you most trust to offer a “vehicle-as-a-service” solution (i.e., flexible vehicle usage offering)?
Sample size: n= 1,006 India
Copyright © 2022 Deloitte Development LLC. All rights reserved. 2022 Deloitte Global Automotive Consumer Study 33Contacts
Rajeev Singh
India Automotive Leader
Deloitte Consulting LLP
rpsingh@deloitte.com
Srinivasa Reddy Tummalapalli Ryan Robinson Shannon Helmer
Automotive Research Manager Automotive Research Leader Automotive Marketing Leader
Deloitte Support Services India Pvt. Ltd. Deloitte LLP Deloitte Services LP
sritummalapalli@deloitte.com ryanrobinson@deloitte.ca shelmer@deloitte.com
Acknowledgements
We would also like to thank Srinivasarao Oguri, and Dinesh Tamilvanan for their
important contributions to the research.
Deloitte Insights/automotive
About Deloitte
Deloitte refers to one or more of Deloitte Touche Tohmatsu Limited, a UK private company limited by guarantee (“DTTL”), its network of member firms, and their related entities. DTTL and
each of its member firms are legally separate and independent entities. DTTL (also referred to as “Deloitte Global”) does not provide services to clients. In the United States, Deloitte refers
to one or more of the US member firms of DTTL, their related entities that operate using the “Deloitte” name in the United States and their respective affiliates. Certain services may not be
available to attest clients under the rules and regulations of public accounting. Please see www.deloitte.com/about to learn more about our global network of member firms.
Copyright © 2022 Deloitte Development LLC. All rights reserved.You can also read