2022-2026 CEDS Draft for Public Comment - Region Nine ...
←
→
Page content transcription
If your browser does not render page correctly, please read the page content below
2022-2026 CEDS Draft for Public Comment
REGION NINE DEVELOPMENT COMMISSION |
3 CIVIC CENTER PLAZA, SUITE 310 MANKATO, MN 56061
INTRODUCTION
About Region Nine Development Commission
Region Nine Development Commission (RNDC) is one of ten regional development
commissions that address the economic, social, and physical concerns of each
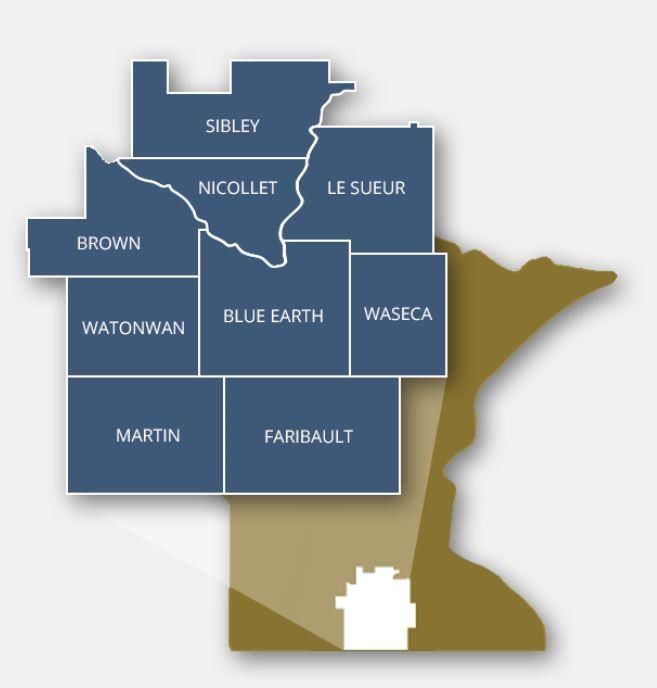
region within the state1. RNDC serves a nine-county area comprised of Blue Earth,
Brown, Faribault, Le Sueur, Martin, Nicollet, Sibley, Waseca, and Watonwan; in
south-central Minnesota (Region 9).
RNDC also serves as a designated Economic Development District (EDD) by the
U.S. Economic Development Administration (EDA), a bureau within the U.S.
Department of Commerce. As an EDD2, RNDC receives a recurring investment from
the EDA to prepare and implement a Comprehensive Economic Development
Strategy (CEDS) to help regions build the capacity for economic development
based on local business conditions and needs
Other activities range from facilitating regional conversations and forums on
workforce, diversity and equity, and economic well-being; to determining project
opportunities and assisting communities interested in seeking local, state, or
federal funding.
Mission: to promote the development of the region through
intergovernmental cooperation, community and human
development, long-range planning, and technical assistance
RNDC takes great pride in working with and on behalf of these nine counties, the 72 cities, 147 townships, and 33 school
districts. Since 1972, being a partner for progress has led to the development of programs in the areas of economic and
business development, community health, transportation, community development by leveraging regional resources.
1
Regional Development Act of 1969 MN SS(462.381-462.398)
2
Title 13 Code of federal regulations parts 303 and 304
1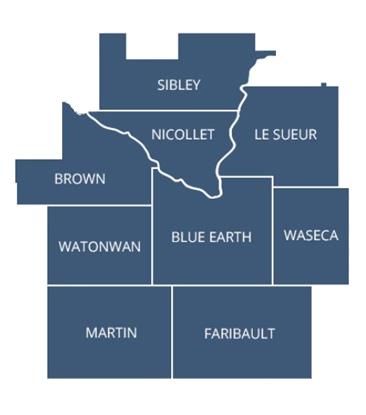
RNDC is governed by 40 regional leaders representing elected officials serving the local units of government of the region, the
Minnesota Valley Council of Governments, and special interest groups including Health and Human Welfare, Minority
Populations, and Youth.
RNDC and its public, private and non-profit partners look to champion and advance effective, sustainable, and resilient rural
economic development in south-central Minnesota.

Comprehensive Economic Development Strategy
Guided by the basic principle that sustainable economic development should be locally-driven, the Comprehensive Economic
Development Strategy (CEDS) is a strategic blueprint of the challenges and opportunities that lay ahead for the region. Serving
as a guide toward an inclusive and resilient region, the plan builds capacity by leveraging existing regional assets and forging
new partnerships to support the implementation of economic development strategies.
The CEDS must comply with the obligations set forth in statute 13 C.F.R. § 303.7 and structured around four requirements:
    •   Regional Overview: A summary background of the economic conditions of the region, including discussions of changing
        demographics and the economy.
    •   SWOT Analysis: An analysis of regional strengths, weaknesses, opportunities, and threats (commonly known as a
        “SWOT” analysis) based on quantitative data and qualitative inputs provided through stakeholder engagement
        sessions;
    •   Strategic Direction: The strategic direction builds on findings from the SWOT analysis and integrates priorities and
        themes from the stakeholder engagement structured around the cornerstones3 of the DevelopMN plan. Finally,
        consideration was also given to the Federal EDA priorities;
    •   Implementation and Evaluation Plan: The implementation and evaluation plan identifies potential partners, timetables,
        and opportunities for the integrated use of other local, state, and federal funds. Performance measures are stated to
        evaluate the organization’s implementation of the CEDS and impact on the regional economy.
Finally, the CEDS plan is updated to include a focus on regional sustainability and economic resiliency for the prevention,
response, and recovery to economic shocks.

3
 Minnesota Association of Development Organizations (MADO), DevelopMN2019 Plan. DevelopMN’s established key
components of strong regions and communities noted as cornerstones: human capital, economic competitiveness, community
resources and foundational assets..
                                                                                                                                  2
Process
The 2022-2026 CEDS was a yearlong planning process, which engaged a range of partners, including community leaders,
residents, the private sector, educational institutions, local government officials, and other stakeholders. Engagement was
April-June 2021 -
March 2021 - Kickoff Engagement July 2021 - CEDS August-October November 2021 - December 2021 - January 2022 - Final
January 2021- CEDS
Workshop with CEDS (Community Survey) Committee goals 2021 - Report Public Comment Presentation and CEDS Plan Submitted
Committee assigned
Committee and Stakeholder meeting Drafting Period CEDS Plan approvals to EDA
meetings
mostly conducted in a virtual format using tools such as Zoom, Mentimeter, and SurveyMonkey.
Five engagement meetings were held during the spring of 2021, one conducted as part of the June Workforce Council meeting.
The online survey was open from April 1to June 30, offered in both English and Spanish languages. Ninety-Four respondents
participated in the survey from 29 geographic zip codes across the region.
We acknowledge the limitation of broadband connectivity and access as well as socio-economic factors that hindered
participation by using these methods for engagement. We will continue to improve and expand upon stakeholder engagement.
A Note on COVID-19 and Ongoing Developments
The COVID-19 pandemic has negatively impacted Region Nine districts much as it has elsewhere in the state and country. The
CEDS was developed in the midst of the pandemic and recovery efforts are ongoing. Businesses and industries shifted their
operating processes, educators and students expanded their learning models, and individuals coped with shutdowns, loss of
employment, and loss of loved ones.
The pandemic exacerbated the disparities and conditions already present in the United States and accelerated the need to
focus time and attention on implementing steps towards alternative solutions.
3COVID-19 has added many uncertainties that were not expected during the development of the 2016-2021 CEDS, or even
when plans for 2021 were made as part of the Annual Performance Report (APR) update in fall 2020.
Prior to COVID-19, five Opportunity Zones (OZ) were selected in the region of the 128 designated throughout Minnesota. All
nine counties of the region received disasters declaration from the 2019 spring flooding, and several larger plant closures
occurred preceding the current CEDS period.
Adding to economic concerns were the civil unrest that took place throughout Minnesota in the last year and the potential
negative impact this would have on the state’s business climate and the opportunities to attract and retain a talented
workforce amid social and economic upheaval. This CEDS addresses some of these concerns through secondary data and
stakeholder priorities should also be interpreted in the context of these developments.
A note on the data
A majority of the statistical data presented in this report will come from the 2019 American Community Survey (ACS) 5-Year
estimates. While 2020 decennial census population counts by age, sex, and race/ethnicity were released as part of the
redistricting data, for consistency and uniformity with other elements of data such as income and educational attainment
being reported on, the 2019 ACS 5-year survey estimates were analyzed4.
Additionally, the margin of error for the estimates is not reported. ACS estimates are based on a sample and are subject to
sampling error. The margin of error measures the degree of uncertainty caused by sampling error and communicates the
precision of the estimate at a given confidence level. The Census Bureau reports statistics at a 90 percent confidence level,
meaning a 10 percent chance of incorrect inference for all estimates exists.
4
The American Community Survey (ACS) is a survey conducted every month, every year, nationwide by the U.S. Census Bureau to provide communities with
current information such as demographics, housing, social and economic data to make informed decisions on programs, emergency management, understand
local issues and conditions.
4REGIONALOVERVIEW
Demographic Changes and Economic Conditions in Region Nine
Region Nine’s counties have been impacted in different ways by demographic changes at the local, regional, state, national, and
international levels since the last CEDS was developed five years ago.
As the above figure illustrates,
Changing Changes in demographic changes are often
In- and Out-
Demand Purchasing drivers of economic change. The
Migration
Patterns Power ongoing retirements of the large post-
World War II generation, the baby
boomers, have contributed to labor
Demographic Market shortages as the generations that
Economic Impact
Change Conditions followed, particularly Generation X,
were significantly fewer in numbers.
From an economic resiliency point of
Aging Price and Wage view, one cannot overemphasize the
Population Labor Shortages Adjustments importance of diversifying the
economic base of local communities
and for public and private entities to
Figure 1. The Dialectic Nature of Demographic Changes and Market Conditions collaborate through local resources
(e.g., local industry or other
community partnerships) as well as other sources of growth, such as the “silver” (e.g., aging population) and the “green” (e.g.,
sustainable resource management) economies that can generate niche opportunities for local communities. Furthermore,
collective efforts by the public, academia, and private industry are important in adapting to the fluctuating trends (i.e.,
population growth in some markets and shrinkage across other geographic areas) and responding appropriately to the
changing environment. Resilient strategies will ensure that communities can respond to emerging and ongoing changes,
secure funding for future operations, and attract and retain a skilled labor force in an increasingly competitive market.
5Population Distribution of Population for Minnesota
Regine Nine has a rural base, by County and of Region Nine by City populations over
meaning most of the 72 cities and 5,000
147 townships within the region
have a population under 2,5005;
only 15 cities have populations
greater than 2,5006. One major
metropolitan area is located in the 18.11%
region, the Mankato-North Mankato Greater MN Counties, 7-County Metro,
Metropolitan Statistical Area (MSA). 2,498,231 3,065,147
Approximately 24 percent of the 5.93%
232,000 people living in the region, Region Nine
53.54% 5.70%
reside in the Mankato-North
Mankato MSA, with an additional 22 5.10%
percent in five cities. In all, Region 4.36%
Nine represents about 9% of the 3.87%
3.40%
population outside of the seven-
county Minneapolis-St. Paul region.
Mankato North Mankato New Ulm
As a region, the population grew St. Peter Fairmont Waseca
0.48% from 2010-2019, while the New Prague Remaining cities and townships
State of Minnesota saw a net
Source: US Census Bureau, 2019 ACS 5-Year Estimates Data Profiles
increase of 4.35%. Only three of the
nine counties in the region saw a population increase during the period, Blue Earth, Le Sueur, and Nicollet Counties, while the
others saw population decreases ranging between -2.07% and -5.17%. The highest loss occurred in Faribault County.
5
The Census Bureau defines rural as any population, housing, or territory NOT in an urban area or urban cluster. An urban area is 50,000 or more people; an
urban cluster is 2,500-50,000 people.
6
Source: Minnesota State Demographic Center; PopFinder for Cities & Townships, year 2019.
6The population decline is
Change in Population 2010-2019 not unique to just Region
Nine. According to the
Minnesota 4.89%
Minnesota State
Region Nine 0.48%
Demographic Center, steady
Blue Earth 4.35%
Brown
urbanization will lead to a
-2.82%
Faribault -5.17%
declining population in
Le Sueur 1.95% more than two-thirds of
Martin -4.74% Minnesota's 87 counties.
Nicollet 3.75% The five counties with the
Sibley -2.19% largest declines in
Waseca -2.07% population by 2053 are
Watonwan -2.13% Saint Louis (-28,238),
-6.00% -4.00% -2.00% 0.00% 2.00% 4.00% 6.00% Winona (-8,960), McLeod (-
8,425), Freeborn (-7,078),
Source: US Census Bureau, 2010 Decennial; 2019 ACS 5-Year Estimates Data Profiles and Martin (-6,541). The
Center is projecting a total
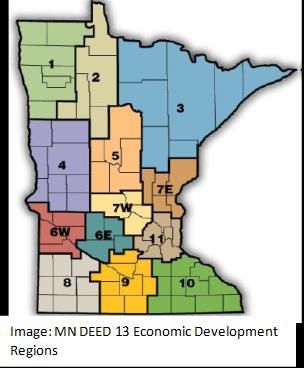
loss for the south-central district of -20,349, with the Arrowhead region (EDR 3) in the Northeast corner of the state
experiencing the greatest loss at -48,642 residents. Together, 6 out of the 11 Economic Development Regions are projected to
lose over 160,000 residents by 20537.
As the graph shows on the following page, the same three counties experiencing gains in population in the next 40 years are
also expected to do so in the near term, yet each will peak before the year 2060. Le Sueur County is projected to reach its
highest population in 2031, Nicollet County in 2042, and Blue Earth in 2045.
7
Long-Term-Population Projections for Minnesota; October 2020
7A decline in rural
County Population Projections 2010-2060 population due to
77,500
75,000 suburbanization and de-
72,500
70,000 industrialization has
67,500
65,000 2045: 73,067 resulted in a wide range
62,500 of socio-economic
60,000
57,500 changes (e.g., structural
55,000
52,500 changes in employment,
50,000
47,500
decrease in revenue,
45,000 degradation of
42,500
40,000
2042: 36,545
properties) that have
37,500
35,000 impacted economic
32,500
30,000
2031: 28,674 development.
27,500
25,000 Population shrinkage
22,500
20,000 will remain a key
17,500
15,000
challenge for Region
12,500 Nine coupled with the
10,000
7,500 impact of COVID-19,
2010 2015 2020 2025 2030 2035 2040 2045 2050 2055 2060 globalization,
Blue Earth Brown Fairbault Le Sueur Martin
Nicollet Sibley Waseca Watonwan
Source: Minnesota State Demographic Center, Long-Term Population Projections for Minnesota, October 2020
knowledge/technological shifts, climate change and the development of the green economy, and inclusiveness. On the flip side,
opportunities, such as the development of the knowledge economy, growing demand for medical services, and the natural
“green” advantage of shrinking areas, are all areas that can spur further economic growth in the region.
Age
Region Nine, like the rest of the nation, is getting older. It is predicted that 1 in 5 people will be age 65 or older by 20308. An
increase in the aging population can be attributed to the large Baby Boomer population and increased life expectancies. As the
chart illustrates, Region Nine is estimated to have a larger percentage of adults 65+ than the state.
8
Based on projections from the U.S. Census and Minnesota State Demographic Center
8Region Nine by percentage will have
more 15–24-year-old residents than Estimated Population Pyramid Percentage by Age Group
the state and is home to Minnesota’s
-20.00 -15.00 -10.00 -5.00 0.00 5.00 10.00 15.00 20.00
youngest county, Blue Earth. Median
6.32
age is an indicator of the age 5.78 6.28 5.75
Under 5 years
13.10
distribution of a population, as it 12.41 12.68 5-14 Years
11.96
provides the midpoint where half 16.27 12.87
15-24 Years
12.52 16.75
the people are older than this age, 13.59
12.12 12.96 25-34 Years
and the other half is younger. As the 11.77
11.26 12.53
table illustrates, the median age in 13.25 11.54
35-44 Years
12.74
neighboring Faribault County is 11.42 11.63 11.12
45-54 Years
almost 15 years higher than in Blue 13.46 13.41
10.77 55-64 Years
10.07
Earth County. 2019 MN 9.18 8.82
10.91 65-74 Years
11.12
2019 R9 5.40 4.53
6.57 75-84 Years
7.12
2028 MN 2.08
2.70 2.44 85 years and over
2028 R9 2.80
Source: U.S. Census Bureau, 2019 ACS 5-Year Estimates Data Profiles; Minnesota State Demographic
Center, Long-Term Population Projections for Minnesota, October 2020
Median Age by County in Region Nine 2000-2019
Years
0 5 10 15 20 25 30 35 40 45 50
Blue Earth 29.9 31.0
Brown 38.4 42.3
Faribault 42.4 45.8
Le Sueur 37.3 41.0
Martin 41.5 45.3
Nicollet 32.6 36.3
Sibley 37.3 41.7
Waseca 36.3 40.5
Watonw… 38.6 39.9
Minnesota 35.4 38.0
2019 2000
Source US Census Bureau, 2010 Decennial; 2019 ACS 5-Year Estimates Data Profiles
9Births & Migration
Region Nine saw a natural increase,
more births than deaths from 2010 Components of Population Change, 2010-2019
to 2019, but also experience net Total April 1, 2010 to July 1, 2019
Population Natural Vital Events Net Migration
out-migration, meaning more
Change Increase Births Deaths Total International Domestic
people moved out than moved in.
Region 2,217 5,025 24,239 19,214 -2,776 2,273 -5,049
Despite suffering domestic out- Nine
migration, Region Nine welcomed State of 335,705 250,488 637,356 386,868 88,161 114,414 -26,253
net international in-migration, Minnesota
gaining new Minnesotans from Source: U.S. Census Bureau, Population Estimates, DEED Regional Profile 9/16/2021
foreign countries.
Compared to the State, Region Nine has a smaller percentage of foreign-born residents. However, from 2010 to 2019, Region
Nine had a rapid increase in foreign-born residents compared to the State. The largest increase in foreign-born residents
during the period was from Africa.
World Region of Region 9 Change 2010-2019 Minnesota
Birth of Foreign Number Percent Number Percent Percent Change
Born, 2019
Foreign-born 9,713 4.2% 2,257 30.3% 8.5% 28.9%
Population
Europe 894 9.2% -3 -0.3% 9.9% 4.5%
Asia 2,27 26.0% 564 28.7% 37.5% 30.3%
Africa 1,399 14.4% 585 71.9% 25.5% 72.0%
Oceania 18 0.2% -42 -70.0% 0.5% 37.2%
Americas: 4,875 50.2% 1,153 31.0% 26.6% 10.0%
Latin America 4,670 48.1% 1,218 35.3% 24.1% 12.2%
Northern America 205 2.1% -65 -24.1% 2.5% -7.7%
Source: U.S. Census Bureau, Population Estimates, DEED Regional Profile 9/16/2021
10Race & Ethnicity
Population by Race, 2019
The United States hit a tipping point in 2015 in its racial and
ethnic make-up: more toddlers under the age of five were White Alone
minorities than non-Hispanic whites. Minnesota and Region Black or African
Nine are still predominantly white. However, the population American Alone
American Indian and
has become more racially diverse as the number of residents Alaskan Native Alone
of other races has increased. Asian Alone
Native Hawaiian and
Other Pac. Isl. Alone
As the racial demographics have changed throughout the Some Other Race
region, clustering in various areas throughout the state has Two or More Race 93.07%
occurred. This is particularly true in the South Central and Groups
Southwest Workforce Investment Areas, where there are
Source: US Census Bureau, 2019 ACS 5-Year Estimates Data Profiles
strong food manufacturing clusters – industries that heavily
employ immigrant labor.
Race and Hispanic Origin, Region 9 Minnesota
2019 Number Percent Change from Percent Change from
2010-2019 2010-2019
Total 232,411 100% 0.48% 100% 4.89%
White Alone 216,311 93.07% 2.15% 82.85% 4.63%
Black or African American 4,785 2.06% 53.86% 6.41% 32.46%
Alone
American Indian and Alaskan 570 0.25% -0.87% 1.04% 4.67%
Native Alone
Asian Alone 2,818 1.21% 16.16% 4.82% 25.91%
Native Hawaiian and Other 38 0.02% -9.52% 0.04% 17.96%
Pac. Isl. Alone
Some Other Race 3,751 1.61% N/A* 1.87% N/A*
Two or More Races 4,138 1.78% 88.35%% 2.97% 60.33%
Hispanic or Latino origin 13,946 6.00% 25.66% 5.38% 19.70%
Source: U.S. Census Bureau; 2019 ACS 5-Year Estimates Data Profiles
11The most racially diverse county in the region is Watonwan County. Previously, it had been Blue Earth. The population
consists of 85.77% white, 10.91% of some other race, followed by Asian with 1.18%, 1.13% of two or more races, and 0.93%
black or African American. Martin County is one of the least diverse counties in the region, with a 96.30% white population.
The Latinx population is one of the
fastest-growing segments of the U.S.
population. Watonwan County has a
Percentage of Population Hispanic and Speaking a
growing Hispanic or Latino Language other than Englsih
population, with 25.49% of the total
0.00% 5.00% 10.00% 15.00% 20.00% 25.00% 30.00%
population identifying as Latinx and
5.38%
21.2% of households speaking a Minnesota 11.90%
6.00%
language other than English at home. Region Nine 6.7%
3.65%
This large Hispanic and Latino Blue Earth County 6.90%
4.40%
population is a growing influence in Brown County 4.80%
6.91%
the county’s communities, workforce, Faribault County 4.50%
and economy. Le Sueur County 6.00%
6.21%
Martin County 4.47%
3.80%
Nicollet County 4.56%
6.00%
Sibley County 8.96%
9.50%
Waseca County 6.00%
5.10%
Watonwan County 25.49%
21.20%
Hispanic Speak a language other than English
Source: US Census Bureau, 2019 ACS 5-Year Estimates Data Profiles
12Race Alone by County, 2019
Native Percent
America Percent
Percent Hawaiia Hawaiian Percent Percent
Black or n Indian Indian Some Two or
Total Percent Black or Percent n and and Some Two or
County White African and and Asian other More
Population White African Asian Other Other other More
American Alaska Alaska race Races
American Pacific Pacific race Races
Native Native
Islander Islander
Minnesota 5,563,378 4,609,049 82.85% 356,515 6.41% 58,011 1.04% 268,181 4.82% 2,194 0.04% 1.87% 2.97%
104,032 165,396
Region Nine 232,411 216,311 93.07% 4,785 2.06% 570 0.25% 2,818 1.21% 38 0.02% 3,751 1.61% 4,138 1.78%
Blue Earth 66,795 60,604 90.73% 2,578 3.86% 177 0.26% 1,443 2.16% 11 0.02% 341 0.51% 1,641 2.46%
Brown 5,163 24,021 95.46% 181 0.72% 76 0.30% 166 0.66% - 0.00% 531 2.11% 188 0.75%
Faribault 13,801 13,350 96.73% 35 0.25% 41 0.30% 51 0.37% - 0.00% 130 0.94% 194 1.41%
Le Sueur 28,242 26,972 95.50% 238 0.84% 50 0.18% 115 0.41% 3 0.01% 468 1.66% 396 1.40%
Martin 19,852 19,117 96.30% 92 0.46% 30 0.15% 102 0.51% 16 0.08% 212 1.07% 283 1.43%
Nicollet 33,954 31,228 91.97% 958 2.82% 13 0.04% 592 1.74% - 0.00% 288 0.85% 875 2.58%
Sibley 14,892 14,199 95.35% 157 1.05% 43 0.29% 107 0.72% 4 0.03% 270 1.81% 112 0.75%
Waseca 18,740 17,409 92.90% 444 2.37% 131 0.70% 113 0.60% 4 0.02% 314 1.68% 325 1.73%
Watonwan 10,972 9,411 85.77% 102 0.93% 9 0.08% 129 1.18% - 0.00% 1,197 10.91% 124 1.13%
Source: U.S. Census Bureau; 2019 ACS 5-Year Estimates Data Profiles
13Poverty and income
Percent of Total Region Nine Minnesota
Poverty continues to be linked with
race and ethnicity in Region Nine Below
Percent
Below
Percent
and Minnesota. People of color are below below
poverty level poverty level
poverty level poverty level
unproportionally more likely to live
Population for whom poverty status is 26,891 12.0% 526,065 9.70%
in poverty. As the above and below
determined
tables illustrate, 82% of Minnesota’s
population is white, yet only 9.7% White alone 22,008 10.6% 328,497 7.30%
of people in poverty are white. Black or African American alone 1,928 45.2% 98,277 28.60%
Moreover, data on Region Nine American Indian alone 78 18.4% 16,949 31.30%
shows that 45.2% of African Asian alone 797 32.2% 35,815 13.60%
Native Hawaii & Other Pacific Is. 4 10.5% 310 14.50%
American residents and 32.2% of
Some other race 1,097 30.0% 20,139 19.70%
Asian residents have earnings
Two or more races 979 24.9% 26,078 16.30%
below the poverty line. Poverty in Hispanic or Latino (of any race) 3,747 27.8% 54,309 18.60%
minority populations is a serious Not Hispanic or Latino (of any race) 22,008 10.6% 328,497 7.30%
concern in the state. Source: U.S. Census Bureau; 2019 ACS 5-Year Estimates Data Profiles
Over 60% of households in
Household Income, 2019 $s the region had an income
under $75,00, with the largest
Minnesota 15.3% 19.5% 17.6% 14.2% 17.8% 15.6%
share having an income
between $25,000-$49,999.
Only 8.5% of the households
had an income greater than
Region 9 18.1% 23.3% 19.0% 15.2% 15.9% 8.5%
$150,000 compared to the
state’s percentage of 15.6.
0% 10% 20% 30% 40% 50% 60% 70% 80% 90% 100%
Less than $25,000 $25,000-$49,999 $50,000-$74,999
Source: US Census Bureau, 2019 ACS 5-Year Estimates Data Profiles
14The median household income
Median Income and Per Capita Income in the Past 12 Months for the region is $60,2959,
80,000 which is lower when compared
70,000 to the state. Le Sueur County
60,000
has the highest median
household income ($71,080),
50,000
comparable to the state figure
40,000 ($71,306), while Martin County
30,000 had the lowest ($52,798).
20,000
Overall, Region Nine had the 7th
highest median household
10,000
income of the 13 economic
0 development regions in the
Minnesota Blue Earth Brown Faribault Le Sueur Martin Nicollet Sibley Waseca Watonwan
County County County County County County County County County
state.
Median Household Income (2019 $s) Per Capita Income
Source: US Census Bureau, 2019 ACS 5-Year Estimates Data Profiles A measure used to express the
average income earned per
person in an geographic area is per capita income. It is derived by dividing the aggregate income of a particular group by the
total population10. Each county in the region has a per capita income lower than the state figure of $37,625.
9
Minnesota Department of Employment and Economic Development Regional Profile, September 16, 2021 using 2015-2019 American Community Survey 5-
year estimates.
10
https://www.census.gov/quickfacts/fact/note/US/INC910219
15Housing Affordability
Housing is considered affordable if no more than 30% of income is
Housing Costs as a Percentage of Income
spent on housing costs. About 24% of households spent 30 percent
for Region Nine
or more of their household income in the past 12 months (2019
ACS data) on housing costs. Households spending more than 30%
15.0% mortgage Less than 20% are considered cost burdened. Renter households often are more
rent cost burdened than households who own their housing. As depicted
20.0 to 24.9%
5.6% 30.0%
below, renters are twice as likely to be cost burdened compared to
35.8% 25.0 to 29.9% 20.6% owner-occupied units.
10.0% 30.0 to 34.9% Sibley County had the highest percentage of owner-occupied
53.9% households considered to be cost burdened closely followed by Le
35.0 percent% Sueur County and Brown County had the lowest. Conversely, Sibley
9.6%
13.8% County had the lowest renter-occupied households considered to
15.5% 10.7% be cost burdened, which Waseca County almost having half their
renters paying more than 30% on rent.
Source: US Census Bureau, 2019 ACS 5-Year Estimates Data Profiles
Housing Costs as a percentage of Housheold Income by County
60.0%
50.0%
40.0%
30.0%
20.0%
10.0%
0.0%
Blue Earth Brown County Faribault County Le Sueur County Martin County Nicollet County Sibley County Waseca County Watonwan
County County
Mortgage Cost >30% of household income Rent >30% of household income
Source: U.S. Department of Commerce. 2019 Bureau of Economic Analysis, Regional Economic Accounts, Washington, D.C., reported by
Headwaters Economics’ Economic Profile System
16The median monthly owner cost for owner-occupied units with a mortgage was $1,291 and the median monthly rent cost for
the region was $77711 Both figures are less than the state median values of $1,580 and $977 respectively.
Le Suer County had the highest
Median Monthly Housing Cost by County monthly median mortgage cost
$1,600 ($1,481) with Nicollet County
$1,400
close behind ($1,419).
Watonwan County had a
$1,200
median mortgage cost of $975,
$1,000
the lowest in the region.
$800
Looking at median rent,
$600
Faribault County had the
$400 lowest at $590 and Blue Earth
$200 County almost $300 more at
$- $883
Blue Earth Brown Faribault Le Sueur Martin Nicollet Sibley Waseca Watonwan
County County County County County County County County County
Median monthly mortgage cost Median gross rent
Source: US Census Bureau, 2019 ACS 5-Year Estimates Data Profiles
11
Minnesota Department of Employment and Economic Development Regional Profile, September 16, 2021 using 2015-2019 American Community Survey 5-
year estimates
17Educational Attainment
More than 92 percent of the adult population (18 years and over) in the region has at least a high school diploma or equal.
Education levels can be a predictor of poverty and can have a direct impact on income potential. Watonwan County has the
highest percentage of adults with less than a high school degree, whereas Nicollet County has 29.7% of adults with a bachelor’s
degree or higher.
Education level Less than High school Some Bachelor's High
for population 18 high graduate college or degree or higher school
year and over school (includes associate's graduate
graduate equivalency) degree or higher
Minnesota 7.5% 25.0% 34.0% 33.5% 92.5%
Region Nine 7.1% 31.4% 38.3% 23.2% 92.9%
Blue Earth 4.8% 23.8% 43.8% 27.5% 95.2%
County
Brown County 6.8% 34.5% 37.5% 21.2% 93.2%
Faribault County 8.6% 38.0% 36.0% 17.5% 91.4%
Le Sueur County 7.0% 36.3% 34.7% 21.9% 93.0%
Martin County 8.3% 37.8% 34.9% 19.0% 91.7%
Nicollet County 5.8% 24.8% 39.6% 29.7% 94.2%
Sibley County 10.0% 39.8% 34.7% 15.5% 90.0%
Waseca County 8.2% 36.2% 35.6% 20.0% 91.8%
Watonwan 16.4% 40.6% 28.6% 14.5% 83.6%
County
Source: U.S. Census Bureau, American Community Survey, 2019 5-Year Estimates
The region has several higher educational institutions that offer a wide variety of programs including, Minnesota State
University, Mankato, South Central College, Bethany Lutheran College, Gustavus Adolphus College, and Martin Luther College.
In addition, more school districts are providing opportunities to become skilled and earn certifications while in high school.
18Economic Conditions
This report was prepared as the COVID-19 pandemic actively impacted the regional economy, health, and social and fiscal
infrastructure. Therefore, this should be taken into account when evaluating the region’s economic performance and
resilience. As one looks at the trends, shifts were already in motion well before March 2020, when the pandemic began in the
United States, which accelerated conditions already present in the region.
RNDC findings suggest that the pandemic reduced the region’s economic output by more than $2.1 billion (annualized) over
the first 15 months of the pandemic, and $620 million annually in economic revenue. Nevertheless, as the pandemic has
impacted regional economies nationally and globally, relative individual indicators remain consistent from a macro economic
standpoint. The importance of monitoring within regional differences and industry specific changes will be critically important
over the next five years as the region continues to recover. Accordingly, the Annual Performance Reports (APR12) will serve as
important addendums to the
Economic Distress Criteria (primary elements) Region Nine, Minnesota, and the U.S.
CEDS.
Region Nine
Economic Distress Metric Region Nine EDD MN U.S. Threshold
Calculations
To become a designated Economic
Development Districts (EDD) at 24-month Average
least one geographical area within Unemployment Rate (BLS) 4.55 4.95 6.62 -2.07
period ending September 2021
the designated service boundaries
must meet the EDA’s regional
2019 Per Capita
distress criteria as set out in 13 Money Income (5-year ACS) $31,022
CFR § 301.3(a). $37,625 $34,103 91.0
Traditional economic distress 2019 Per Capita
criteria are: Personal Income (BEA) $49,808 $58,834 $56,490 88.2
Source: U.S. Bureaus of Census, Labor Statistics, and Economic Analysis; Calculations generated by StatsAmerica
• An unemployment rate that is,
for the most recent 24-month period for which data is available, at least one percentage point greater than the national
average unemployment rate;
• Per capita income that is, for the most recent period for which data are available, 80 percent or less of the national average
per capita income.
12
13 C.F.R. 303.6(B)(3)(iii)
19While, Region Nine continues to lag behind the national average with respect to per capita money income (i.e., cash sources of
income) and per capita personal income (i.e., includes cash sources of income in addition to insurance, transfer payments,
dividends, interest and rent) by 9% (threshold: 91.0) and 11.8% (threshold: 88.2) respectively, it is still above the distress
threshold. The 24-month unemployment rate (4.55%) was significantly lower than the national average for the period ending
September 2021.
As illustrated in the next table, all of the region’s counties have a threshold calculation below 100 for both per capita personal
income (PCPI) and per capita money income (PCMI), with the exception of Martin County’s PCPI figures. Only Watonwan
County comes close to the 80 percent or less of the national average per capita income with 83.1 threshold calculation.
Interestingly, no distinct patterns exist between unemployment and PCPI or PCMI. This is most likely due to the relatively high
labor mobility between the counties and that the labor force may reside and work in different counties. This is not uncommon
for mostly rural areas, still it indicates that regional industries are either producing in labor intensive sectors with a
downward pressure on wages,
Economic Distress Criteria (primary elements) by County in Region Nine Economic Development
or that a rapid increase in lower
District
paying service-related
ACS 5-
24 Month Threshold Threshold Year Threshold
industries have outpaced
Counties Unemployment Calculation BEA PCPI Calculation PCMI Calculation growth in more economically
Blue Earth 4.32 -2.3 $46,793 82.8 $29,677 87 robust industries such as
Brown 4.31 -2.31 $55,904 99 $31,237 91.6 manufacturing and construction
Faribault 5.26 -1.36 $46,941 83.1 $29,991 87.9
Le Sueur 5.64 -0.98 $50,728 89.8 $33,311 97.7
Martin 4.4 -2.22 $57,091 101.1 $31,066 91.1
Nicollet 3.87 -2.75 $51,036 90.4 $33,031 96.9
Sibley 4.73 -1.89 $49,408 87.5 $32,016 93.9
Waseca 5.33 -1.29 $44,262 78.4 $29,929 87.8
Watonwan 4.08 -2.54 $48,684 86.2 $28,341 83.1
Source: U.S. Bureaus of Census, Labor Statistics, and Economic Analysis; Calculations generated by StatsAmerica
20Employment by Industry
Although Region Nine and Minnesota began to experience structural shifts in employment in the late 1960s with the
emergence of neoliberal trade policies, the gradual shift from manufacturing to service industries is still taking place. By the
early 1970s service industry employment surpassed manufacturing as the leading employment industry for the first time and
by the early 1980s, Minnesota became a service-dominant state with respect to employment. Retail trade had by that time also
surpassed manufacturing as the second leading employment sector in the state. Region Nine is now, fifty years later, facing a
more symbolic shift in employment as health care is expected to overtake manufacturing as the single largest employing
industry in the region.
Region Nine Industry Employment Statistics, Number of Jobs Percent of Average Annual Wage
2019 Total Jobs
Agriculture, Forestry, Fishing and Hunting 3,181 3.0% $46,644
Mining 210 0.2% $79,456
Construction 5,082 4.8% $56,524
Manufacturing 19,005 17.9% $53,872
Wholesale Trade 3,975 3.7% $67,808
Retail Trade 11,771 11.1% $25,636
Transportation and Warehousing 4,575 4.3% $39,416
Utilities 476 0.4% $94,328
Information 1,884 1.8% $53,716
Finance and Insurance 2,849 2.7% $64,740
Real Estate and Rental and Leasing 1,016 1.0% $30,056
Professional, Scientific, and Technical Services 2,573 2.4% $62,140
Management of Companies 817 0.8% $83,304
Admin. Support and Waste Mgmt. Services 2,194 2.1% $32,760
Educational Services 9,597 9.0% $45,500
Health Care and Social Assistance 18,807 17.7% $45,656
Arts, Entertainment, and Recreation 1,115 1.1% $13,364
Accommodation and Food Services 8,060 7.6% $14,560
Other Services (except Public Administration) 3,221 3.0% $28,756
Public Administration 5,705 5.4% $48,152
Total, All Industries 106,122 100.0% $44,457
Source: DEED QCEW, 2019 All Industries All Ownership, complied by RNDC
21Looking at the Quarterly
Region Nine Employment by Industry 2011-2020 Census of Employment and
Wages (QCEW) through the
– yearly averages (industries w/more than 3,000 jobs) Minnesota Department of
20500 Employment and Economic
Development (DEED), the
18500
major employment
16500 industries in Region Nine
are manufacturing (17.9%),
14500
followed health care and
12500 social assistances (17.7),
10500 and retail trade (11.1%).
8500 Since 2008 health care and
social assistance has been
6500
Minnesota’s largest industry
4500 segment followed by “other
2500
services”, retail trade, and
2011 2012 2013 2014 2015 2016 2017 2018 2019 2020 manufacturing. No other
industry is growing at the
Construction Manufacturing rate of health care, which
Wholesale Trade Retail Trade
Transportation and Warehousing Educational Services saw the largest net growth
Health Care and Social Assistance
Public Administration
Accommodation and Food Services in employment since 2011,
with 977 jobs; followed by
Transportation and
Source: U.S. Bureaus of Census, Labor Statistics, and Economic Analysis; Calculations generated by
StatsAmerica.
Warehousing (+ 888 jobs).
Construction and Agriculture
grew by 767 and 569 jobs respectively. The largest losses were in Manufacturing (- 2,123 jobs; -763 from 2019 to 2020),
Accommodations and Food Services (- 766, with 1,300 jobs lost between 2019 and 2020 after a steady increase for the previous
nine years), and Retail Trade (-494). Only Agriculture and Finance and Insurance grew in employment between 2019 and
2020.
22Projections based on regressions for each of these nine industries indicate that Health Care and Social Services will be the
largest employing industry by the end of 2023 and Region Nine’s employment portfolio will mirror that of the state. Other
leading industries are expected to experience only moderate to no gains in employment; Transportation and Warehousing is
expected to gain 105 jobs per year, while Construction and Health Care and Social Services will add 95 and 89 jobs per year
respectively. Manufacturing is expected to decrease by 210 jobs per year over the next five years. These figures are based on
the annualized employment for the
past ten years. Region Nine Employment by Industry, Projections 2021-
Technological changes account for 2025 – yearly averages (industries w/more than 3,000
some of these changes, particularly
20,500 jobs).
in manufacturing, but consumers’
retail preferences are also 18,500
accounting for decline in jobs in 16,500
many leading industries. That does
not, however, alone solve the labor 14,500
shortage problem. Region Nine’s 12,500
population is not keeping up with
10,500
the demand for jobs in many
industries, and the introduction of 8,500
new production technologies and
6,500
systems will require different skills
than in the past. As an example, the 4,500
integrated nature of supply chains in 2,500
the manufacturing industry will 2011 2012 2013 2014 2015 2016 2017 2018 2019 2020 2021 2022 2023 2024 2025
require design engineers to
understand logistics and Construction Manufacturing
transportation, marketing, and Wholesale Trade Retail Trade
Transportation and Warehousing Educational Services
product placements as supply
Health Care and Social Assistance Accommodation and Food Services
chains are adjusting to super- Public Administration
consumers , intense battles on price Source: U.S. Bureaus of Census, Labor Statistics, and Economic Analysis; Calculations generated by
and the need for more dynamic StatsAmerica. Only industries with more than 3,000 jobs in 2020 are included
products. Accordingly, the region will face a paradox of shrinking populations while also experiencing structural labor
shortages
23Wages/Salaries by Industry
Of the nine largest industries by employment, aggregate wages (as measured by average monthly earnings) differ quite
distinctively, the highest earnings were in Wholesale Trade, Construction, and Manufacturing. The lowest wages were in Retail
Trade, Accommodations and Food Services, and other Services. The below table illustrates changes between Quarter 1 2015 and
Quarter 4 2019 for the respective industries.
As the table illustrates, wages grew faster in the industries with above average wages. Wages were stagnant or only growing 3-
5% over the five-year period for the three industries with the lowest wages. Accordingly, significant industry specific
characteristics exist regionally.
Region Nine Wage Changes by Industry and Wages in Comparison to Regional Averages
(industries w/more than 3,000 jobs).13
Wholesale
Construction Manufacturing Trade Retail Trade
Change
2015-2019 12.79 10.03 13.88 4.7
Percent of
Average 1.387998 1.34894 1.652027 0.649027
Health
Transportation Care and Accommodation Other Services
and Educational Social and Food (except Public
Warehousing Services Assistance Services Administration)
Change
2015-
19 7.49 3.68 8.37 3.05 5.01
Percent
of
Average 0.961265 0.848555 1.039157 0.4062 0.706832
13
U.S. Bureaus of Census, Labor Statistics, and Economic Analysis; Calculations generated by StatsAmerica. Only industries with more than 3,000 jobs in 2020
are included.
24Broader analyses reveal similar trends, with great disparities between sectors of the regional economy. Traditionally large
sectors, like manufacturing, are in decline from an employment standpoint, but continue to represent high average annual
wages, while job growth is expected in service-related jobs, where jobs lag the regional average.
Region Nine Wages by Sectors of Employment and Inter-sector Comparisons.14
Avg. Annual
% Above or
Employment and Wages in 2020 Wages (2020
Below Avg.
$s)
Total $47,477
Private $46,460 -2.1%
Non-Services Related $56,181 18.3%
Natural Resources and Mining $49,842 5.0%
Agriculture, forestry, fishing & hunting $46,484 -2.1%
Construction $58,066 22.3%
Manufacturing (Incl. forest products) $56,917 19.9%
Services Related $42,148 -11.2%
Trade, Transportation, and Utilities $40,513 -14.7%
Information $58,989 24.2%
Financial Activities $61,571 29.7%
Professional and Business Services $57,570 21.3%
Education and Health Services $46,911 -1.2%
Leisure and Hospitality $14,913 -68.6%
Other Services $32,047 -32.5%
Employment changes do not only impact the individual worker, but also the regional earnings. The gradual shift from non-
service-related employment to the service sector, places an automatic downward pressure on regional earnings, and by
default on the regional tax-base, local communities’ ability to provide public services, and general maintenance of
infrastructure and other critical needs. The below figure illustrates earnings by industry since 2000.
14
Data Sources: U.S. Department of Commerce. 2020. Bureau of Economic Analysis, Regional Economic Accounts, Washington, D.C.
251,600
Earnings by Industry, Region Nine
1,400
1,200
1,000
Millions of 2020 $s
800
600
400
200
0
2001
2002
2003
2004
2005
2006
2007
2008
2009
2010
2011
2012
2013
2014
2015
2016
2017
2018
2019
Farm Construction
Mfg. (incl. forest products) Wholesale Trade
Retail Trade Transportation & Warehousing
Information Finance & Insurance
Professional, scientific, & technical Health Care & Social Assist.
Other Services Government
Source: U.S. Department of Commerce. 2020. Bureau of Economic Analysis, Regional Economic Accounts, Washington, D.C.,
reported by Headwaters Economics’ Economic Profile System headwaterseconomics.org/eps.
26Labor Force and Labor Force Participation Rate
Region Nine Minnesota
Labor Force Participation
Labor Unemp. Labor Unemp.
The labor force participation rate represents the percentage In Labor Force Rate Force Rate
of the population that is either working or actively looking Force Partic. Partic.
Rate Rate
for work.
Total Labor Force 130,178 69.5% 3.7% 69.7% 3.6%
In order to actively recruit businesses and public sector 16 to 19 years 8,697 61.8% 15.6% 53.2% 11.0%
employers, it is important to highlight a labor force that is 20 to 24 years 17,452 83.5% 4.7% 84.6% 6.0%
25 to 44 years 48,699 89.6% 3.2% 88.8% 3.2%
willing, able, and ready to work.
45 to 54 years 23,259 87.7% 2.6% 87.6% 2.7%
55 to 64 years 23,876 76.3% 2.9% 73.0% 2.8%
Labor Force is defined as all people age 16 and older who 65 to 74 years 6,739 31.6% 2.8% 27.9% 2.2%
are classified as either employed and unemployed.1, In 75 years and over 1,440 7.7% 11.9% 6.6% 2.4%
order to be considered unemployed, a person must be RACE AND HISPANIC OR LATINO ORIGIN
available and actively seeking work. White Alone 122,237 69.5% 3.3% 69.3% 3.0%
Black or African American 2,454 67.2% 17.6% 71.3% 8.8%
Regine Nine had a slightly lower labor force participation American Indian and Alaska
300 58.3% 0.7% 58.9% 12.6%
rate than the state overall. Yet had a higher participation Native
Asian 1,600 64.7% 2.4% 71.2% 4.3%
rate among every age category other than 20 to 24 years. Some other race 1,947 73.0% 4.2% 77.7% 6.1%
That may be due to the number of colleges in the region. Two or more races 1,628 79.4% 12.1% 73.6% 7.4%
Hispanic or Latino origin
The labor force racially is less diverse than the state, but is (of any race)
6,808 74.4% 8.5% 76.5% 6.1%
become more diverse over time. Black workers are twice as DISABILITY STATUS
likely to be unemployed in the region than the state. Two or With any disability 6,365 54.1% 8.4% 53.0% 8.6%
EDUCATIONAL ATTAINMENT
more race workers also see a higher unemployment rate
Population 25 to 64 years 95,837 85.4% 2.5% 84.5% 3.0%
compared to the rest of the state. Less than high school
4,217 67.4% 3.7% 66.3% 4.2%
graduate
As the workforce continues to age and the looming High school graduate
26,657 81.6% 1.8% 78.5% 2.6%
retirement of the baby boomer generation, this may be (includes equivalency)
particularly impactful to rural communities in Region Nine Some college or associate's
37,003 87.8% 2.0% 85.3% 3.0%
degree
that skew slightly older. Bachelor's degree or higher 27,975 90.0% 1.5% 90.0% 1.7%
Source: U.S. Census Bureau; 2019 ACS 5-Year Estimates Data Profiles, DEED
Regional Profile 9/16/2021
Commute and Labor Sheds (Where People Work and Live)
27Approximately 76% of workers within Region Nine live and work in the region. Of the 103,427 employed in the region, 24,863
workers reside outside the area and the region sheds 34,071 of workers to fill employment outside the nine counties.
78,564
24,863 34,071
Source: U.S. Census Bureau, OnTheMap Application and LEHD Origin-Destination Employment Statistics, 2019
The top work destination in the region is Mankato-North Mankato, which accounted for 24.8% of employment. The top
commuters into the region from outside the region were from Minneapolis (0.7%) and Owatonna (0.5%).
Of the 34,000 residents of Region Nine that work outside the nine counties, many of those commuters are employed in the
Twin Cities metropolitan area, Owatonna, or Rochester. Although the numbers are not significant, 1.7% of all workers in the
region (representing 1,900 workers) commuted into Owatonna, 1.4% into Minneapolis, 1.1% for both St. Paul and Rochester.
Le Sueur County had the highest percentage of people that worked outside the county of residence at 62.5% and Martin
County had the lowest at 14.4%.
28Place of Work, 2019
100%
90%
80%
70%
60%
50%
40%
30%
20%
10%
0%
Blue Earth Brown County Faribault County Le Sueur County Martin County Nicollet County Sibley County Waseca County Watonwan
County County
Worked in county of residence Worked outside county of residence
Source: U.S. Department of Commerce. 2019 Bureau of Economic Analysis, Regional Economic Accounts, Washington, D.C., reported by
Headwaters Economics’ Economic Profile System
29R E G I O N A L S.W.O.T. A N A L Y S I S
Regional cluster-analyses suggest that there
are strong growth potentials in Region Nine
and specifically within segments of STRENGTHS WEAKNESS
manufacturing (e.g., MDM and food- •Human capital & knowledge •Low scale production
production), construction, and health care- creation •Expensive logistics
related clusters.15 Yet, progress within •Relatively high portfolio •Lack of industry synergy
certain clusters has been gradual due to the diversity •Poor access to capital
inability to fill vacancies, promote workers, •Flexible manufacturing •Business dynamics
designs
and retain talent. Additionally, firms are •Business profile
•Relatively high workforce
indicating that there is little synergy in participation rates
some industry clusters with corresponding •Economic wellbeing
high operations costs, which puts them at a
competitive disadvantage despite the
proximity to major manufacturing hubs in THREATS
OPPORTUNITIES
the Twin Cities and other regional centers. •Population decline and an aging
▪ Economies of scale population
Developments in Region Nine are typical of through consolidation •Mental Health/Substance Abuse
economic development challenges outside and/or cooperation Treatment Shortages
• Sustainable •Increasing Industry
the Twin Cities. Whereas the largest Concentration
industry sectors in are Manufacturing, Retail manufacturing
•Global Competition
Trade, and Health Care and Social Assistance, • Growth in healthcare •Labor Shortages and Brain Drain
all relatively robust industry clusters, sectors •Childcare Shortages
average earnings per job have stagnated • Alignment with statewide •Affordable Housing, Poverty, and
somewhat over the past five years, with the growth clusters Regional Economic Disparities
•Poor Broadband Connectivity
2018 regional figure at $45,083. This was a
13% increase from 2010. The relatively
slow increase corresponds with a slow-
down in manufacturing jobs and an increase
15
See recent Region Nine reports for specifics: https://www.rndc.org/what-we-do/medtech-connect/
and https://www.rndc.org/what-we-do/community-economic-development/agriculture-resiliency-plan/
30in service jobs, particularly in retail trade. Total employment increased by 7,348 jobs regionally between 2010 and 2018. The
largest gains were in services with 5,268 jobs, manufacturing with 1,378 jobs, and construction with 1,221. During the same
period 800 farm jobs and 306 government jobs were lost.
In 2018, the three industries with the largest earnings were manufacturing ($1,371.1 million), health care and social assistance
($983.3 million), and retail trade ($408.6 million). Manufacturing continues to represent the highest wages by industry at an
average annual wage (in 2018 $s) of $52,904 per year, closely followed by construction at $52,777. Service-related jobs
averaged $36,837 per year, which is 12.9% below the regional average. This remains a concern with respect to the regional
economic resiliency as these industries represent the fastest growing segments of the economy. Investments to boost the
growing need for health care services and traditional sectors, such as manufacturing, are therefore warranted as these present
opportunities for further job creation and higher paying jobs.
To identify such opportunities, this report utilizes a Strengths, Weaknesses, Opportunities, and Threats (SWOT), framework to
analyze current and ongoing industrial developments in the region, consistent with requirements and guidelines from the
federal EDA.
STRENGTHS
Strengths are a region’s relative competitive advantages (e.g.,
Human capital and knowledge creation
industry supply chains and clusters, extensive port, rail, and
Human capital and knowledge creation has been a strength broadband assets, specialized workforce skills, higher education
for the state for several decades. The Human Capital and levels, collaboration among stakeholders) and often are internal in
Knowledge Creation Index suggests the extent to which a nature;
region’s population and labor force have the collective
cognitive capacity and know-how to engage in innovative
activities. It includes measures of educational attainment, patent/technology diffusion, university-based knowledge spillovers,
incubator knowledge spillovers, STEM education, and other measures tied to knowledge creation.
Human capital and knowledge creation is a definite strength for the region. Region Nine scores 120.0 (100 = expected national
average) on this index and ranks 88 out of 384 EDDs ranked on StatsAmerica’s Headline Index. Specific regional strengths
include sub-categories of High School Attainment, College Degrees (i.e., Some College, No Degree, Associate Degrees, Bachelor
Degrees, University-Based Knowledge Spillovers, STEM Degree Creation (per 1,000 Population), and High-Tech Industry
Employment Share. The sole weaknesses identified include Graduate Degree, Patent Technology Diffusion, Business Incubator
Spillovers, and Technology-Based Knowledge Occupation Clusters.
31Employment productivity is another strength of Region Nine’s Human Capital, scoring 115.5 on the index, which places the
region 106th out of 384 EDDs. The Employment and Productivity Index describes economic growth, regional desirability or
direct outcomes of innovative activity. Minnesota scores particularly high in the southern portions of the state, even in
relatively rural counties. It includes measures of job growth, cluster diversity, cluster strengths, GDP per worker, patents, and
other variables tied to productivity.
Relatively High Portfolio Diversity
Local manufacturers in Region Nine often produce a variety of products and services. Many firms consider themselves
commodities producers, which happen to sell some of their product to specialized companies in a certain segment of a
particular industry. Others are co-manufacturers that produce across related industries such as agriculture, consumer
products, and electronics.
Although some regional manufacturing specialization exists, particularly with respect to medical devices and more specialized
service providers, most derive significant revenue from other industries and segments of the economy. This form of customer
diversification diminishes their sensitivity to demand fluctuations within a particular industry.
Flexible manufacturing designs
Many regional manufacturers have been in existence for several decades and have acquired technology over time, which
allows them to adapt to purchase orders without incurring significant capital investments. Some of the plants have developed
or acquired technology to easily accommodate flexible production schedules.
High workforce participation rates
Region Nine has maintained a relatively stable workforce and many of the local MDM producers experience relatively low
turnover. An experienced and qualified workforce should be considered a strength in an economy where turnover is costly.
Economic Well-Being
Economic well-being is the highest scoring index for Minnesota and the same is true for Region Nine. With a score of 138.9, the
region ranks at 56th out of 384 EDDs. The Economic Well-Being Index explores standard of living and other economic
outcomes based on
measures such as per capita personal income growth, income inequality, poverty rates, unemployment rates, dependency
based on income sources, and net migration.
32WEAKNESSES
Low Scale Production Weaknesses are a region’s relative competitive disadvantages
(e.g., a risk-averse or change-resistant regional culture), also often
Few regional manufacturing plants are internal in nature;
producing at a scale that compares to global
competitors. Also, their business strengths in
product diversity simultaneously diminish their attractiveness to larger companies seeking co-manufacturers as niche
partners. In other words, most regional firms cannot achieve the economies of scale necessary to meet preferred supplier
status among larger players in their industry. While some of the producers can produce at a higher rate, and thereby reduce
the average unit price, many firms lack the capital required to significantly increase production and reduce time from design-
to-production. Others face geographic limitations when it comes to expansion. For example, some plants are in older industrial
parks and are unable to expand.
Expensive Logistics
There are few indications that producers of similar products in Region Nine utilize pooled logistics channels, which is common
in other geographic industry clusters.16 This significantly increases procurement costs, which again puts them at a
disadvantage in their respective industries. Similarly, there is no indication that producers outside the Twin Cities pool
together to create leveraged purchasing power. Whereas competitors often collaborate to keep logistics and materials costs
down, there is little indication that this is the norm in Region Nine.
Lack of Industry Synergy
Unlike industry trends that indicate that producers increasingly collaborate to meet the demand of buyers, few instances of
such arrangements appear to be common in Region Nine. This lack of interconnectedness generates low synergy, which is
viewed as critical in industries where collaboration and lean operations has become the norm.
Poor Access to Capital
Regional businesses and entrepreneurs report having limited access to capital. Local, regional, and national banks meet the
basic funding needs of most regional small businesses. However, this analysis was unable to identify any venture capital
16
See https://www.rndc.org/what-we-do/medtech-connect/ for a detailed discussion.
33You can also read