2021 First Quarter Earnings - Ted Doheny, President & CEO Chris Stephens, SVP & CFO Lori Chaitman, VP Investor Relations - Investors

Page created by Adam Deleon
 
CONTINUE READING
2021 First Quarter Earnings - Ted Doheny, President & CEO Chris Stephens, SVP & CFO Lori Chaitman, VP Investor Relations - Investors
2021 First Quarter Earnings
  May 4, 2021
  Conference Call Supplement (Unaudited Results)

Ted Doheny, President & CEO
Chris Stephens, SVP & CFO
Lori Chaitman, VP Investor Relations
2021 First Quarter Earnings - Ted Doheny, President & CEO Chris Stephens, SVP & CFO Lori Chaitman, VP Investor Relations - Investors
Safe Harbor and Regulation G Statement
 Forward-looking Statements
 This presentation contains “forward-looking statements” within the meaning of the safe harbor provisions of the Private Securities Litigation Reform Act of 1995. All statements other than
 statements of historical facts included in this presentation regarding our strategies, prospects, financial condition, operations, costs, plans and objectives are forward-looking statements.
 Examples of forward-looking statements include, among others, statements we make regarding expected future operating results (including the SEE Operating Model), expectations
 regarding the results of restructuring and other programs, expectations regarding the results of business strategies and transformations, anticipated levels of capital expenditures and
 expectations of the effect on our financial condition of claims, litigation, environmental costs, contingent liabilities and governmental and regulatory investigations and proceedings.
 Forward-looking statements are subject to risks and uncertainties, many of which are outside our control, which could cause actual results to differ materially from these statements. For
 information about some of those risks and uncertainties, see the “Risk Factors” section appearing in our most recent Annual Report on Form 10-K, and as revised and updated by our
 Quarterly Reports on Form 10-Q and Current Reports on Form 8-K. Any forward-looking statement speaks only as of the date on which it is made, and we undertake no obligation to
 publicly update such statement.

 Non-U.S. GAAP Financial Measures
 Our management uses non-U.S. GAAP financial measures to evaluate the Company’s performance, which exclude items we consider unusual or special items. We believe that the use
 of non-U.S. GAAP measures helps investors to gain a better understanding of core operating results and future prospects, consistent with how management measures and forecasts the
 Company's performance, especially when comparing such results to previous periods or forecasts. Please see Sealed Air’s May 4, 2021 earnings press release and the appendix of this
 presentation for important information about the use of non-U.S. GAAP financial measures relevant to this presentation, including applicable reconciliations to U.S. GAAP financial
 measures. Information reconciling forward-looking U.S. GAAP measures to non-U.S. GAAP measures is not available without unreasonable effort. Values in this presentation are
 approximate due to rounding. Additionally, the individual components of bridges or the individual quarterly components presented in the current or prior quarter earnings presentation
 may not sum to the full year amount due to rounding.

 Website Information - Please visit our website Sealedair.com
 We routinely post important information for investors on our website, www.sealedair.com, in the "Investors" section. We use this website as a means of disclosing material, non-public
 information and for complying with our disclosure obligations under Regulation FD. Accordingly, investors should monitor the Investors section of our website, in addition to following our
 press releases, SEC filings, public conference calls, presentations and webcasts. The information contained on, or that may be accessed through, our website is not incorporated by
 reference into, and is not a part of, this document.

                                                                                                                                                                           © 2021 Sealed Air      |2
2021 First Quarter Earnings - Ted Doheny, President & CEO Chris Stephens, SVP & CFO Lori Chaitman, VP Investor Relations - Investors
Q1 Financial Results
  Performance driven by volume growth & Reinvent SEE

        Net Sales $1.3B; +8%, +6% constant dollar
        Adjusted EBITDA $268M; +6%

        Adjusted EPS $0.78; +7%

        Free Cash Flow $36M vs ($8M) in Q1 2020

           Raising 2021 Outlook for Sales, Earnings & FCF

                                                            © 2021 Sealed Air   |4
2021 First Quarter Earnings - Ted Doheny, President & CEO Chris Stephens, SVP & CFO Lori Chaitman, VP Investor Relations - Investors
SEE Operating Model

                                                                                                        Organic Sales
                         Adjusted EBITDA ($M)                                                             3 - 5% growth YoY

                                                                                                        Earnings
                                                      1,120 – 1,150                                       Adjusted EBITDA 5 - 7% growth YoY
                                                                                                                    Operating Leverage ∆ P / ∆ G 1 >30%
                                                 1,051
                                                                                                        Earnings per Share
                                       965
                                                                                                          Adjusted EPS >10% growth YoY
                           890
                833                                                                                     Cash Generation
                                                                                                          >50% Free Cash Flow conversion 2
               2017        2018       2019       2020       2021E                 2024E
                                                                                  2024E                             ROIC > WACC

                         Automation, Digital & Sustainability driving 2021 growth & beyond
                                                       SEE Operating Engine delivering earnings power

1   Operating Leverage (Profit / Growth ratio) YoY change in Adj. EBITDA / YoY change in Net Sales   2 FCF   Conversion: Free Cash Flow / Adj. EBITDA   © 2021 Sealed Air   |5
2021 First Quarter Earnings - Ted Doheny, President & CEO Chris Stephens, SVP & CFO Lori Chaitman, VP Investor Relations - Investors
SEE Solutions for Critical Packaging Challenges
    Market driven solutions: automation, digital and sustainability powering global growth

         Q1 2021
           Sales           62% Americas                           22% Europe, Middle East & Africa                                         16% Asia Pacific
Cryovac ® Barrier Bags    Darfresh ® On Tray/Board Vacuum Skin        Medical     Sealed Air® Korrvu ®   Bubble Wrap® Pick Pack Mailers   Autobag® StealthWrap ®   Sealed Air® Instapak ®

  Cryovac ® Auto Pouch System        Cryovac® Bag In Box       Bubble Wrap ® Inflation Systems     Sealed Air® Paper Systems   Autobag ® Bagging Systems    Cold Chain   Specialty Foams

  Red Meat 22%            Poultry 7%         Cheese 7%           Seafood 2%            Medical, Life Sciences 5%           Industrials 12%        Retail & Consumer Goods 12%
    Smoked & Processed 9%                   * Other Foods 6%              Liquids & Fluids 3%            Electronics 7%        Transportation & Other 5%           Logistics 3%

* Other Foods includes frozen foods, produce, pantry items, meal kits and plant-based proteins                                                                     © 2021 Sealed Air   |6
2021 First Quarter Earnings - Ted Doheny, President & CEO Chris Stephens, SVP & CFO Lori Chaitman, VP Investor Relations - Investors
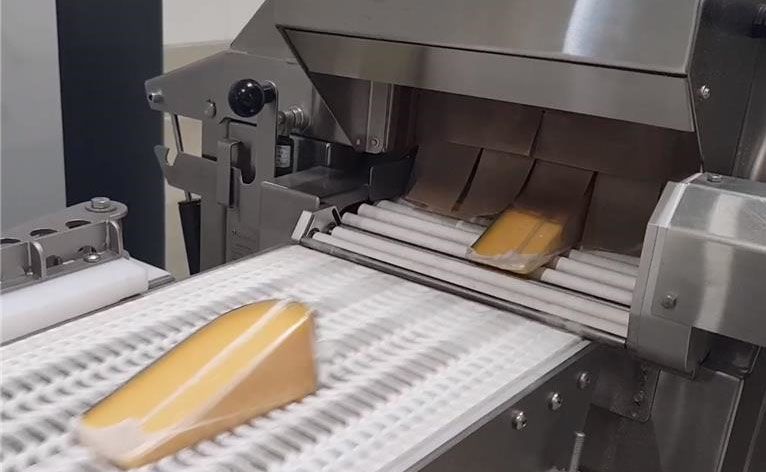
SEE™ Automation Solutions: Equipment System • Service • Materials
 Growth opportunity over life cycle >$5B
                                                                                                                         >5,000

 Solving Customers’ Automation Needs                                          ($M)                        >750
  Automation “Touchless Systems” targeting multi-million $ customer savings
  Targeting customer payback < 3 years                                                        ~ 425
                                                                                       380
                                                                              324
                                                                                                          >500
                                                                                              >250
 SEETM Automation Branded Solutions to Create References                      176      217

  Q1 2021 Equipment, Systems & Services up 18% YoY, on track to ~$425M        '19       '20    '21E        '25E          Life Cycle
                                                                                    Equipment + Systems   Services      Materials

 Enhanced Service Models to Improve Life Cycle Value
                                                                                    3x+ Solutions Multiple
                                                                                     over Equipment Life Cycle
 Drive Materials & Service Sales via Integrated Solution Model                 Modeling life cycle opportunity at 10 years
                                                                                Fleet life cycle between 3 and 30 years

                                          “Touchless Systems”
     Eliminate waste → simplify the process → remove people from harm’s way → automate “touchless”
                       Best solutions • right price • make them sustainable
                                                                                                                 © 2021 Sealed Air   |7
2021 First Quarter Earnings - Ted Doheny, President & CEO Chris Stephens, SVP & CFO Lori Chaitman, VP Investor Relations - Investors
Leadership Actions through COVID-19 Pandemic
Accelerating transformation to a stronger and better company

   Lead through crisis                             Accelerate transformation                                      Stronger post crisis
     Keep people out of harm’s way                        Keep people out of harm’s way                  Transforming operations into touchless & zero-harm
  Supporting peak customer demands                     Reinvent SEE 4P’S based playbook                        Flexible workplace, eCommerce platform
     Activated crisis management                  Innovation speed; “at the table” now online           Automation solutions: Equipment, service, materials
     Global leadership collaboration           Capital allocation strategy to create Economic Value       2025 Plastics Pledge & 2040 Net Zero Carbon

                                                                                                               SEE Mark™ – Smart Packaging Patent Pending

                      Sealed Air ® brand
                    Kevothermal ® Cold Chain     Cryovac ® brand      Bubble Wrap ® brand Sealed Air ® brand
Autobag ®   brand    packaging solutions for     Darfresh ® On Tray     Inflation Systems
 Bagging Systems                                                                            Paper Systems
                       vaccine distribution
                                                                                                                       Vacuum Gripping Tool Patent Pending

                    Leading to digitally enabling “touchless systems”
                                                                                                                                                       © 2021 Sealed Air   |8
2021 First Quarter Earnings - Ted Doheny, President & CEO Chris Stephens, SVP & CFO Lori Chaitman, VP Investor Relations - Investors
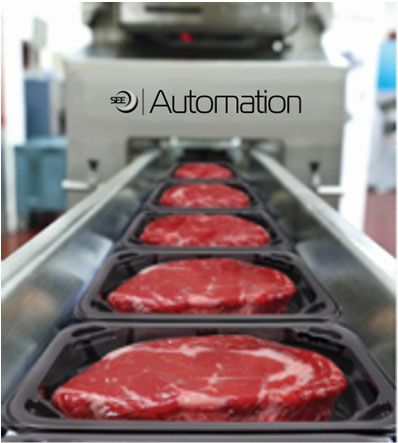
Q1 2021 YoY Sales Performance

       ($M)
                                                         Segments                      Regions
                                               SEE     Food   Protective   Americas*   EMEA      Asia Pacific

                               Sales          $1,267   $702      $565        $788       $281         $198
      As Reported Change                         8%      2%      17%           3%       14%           23%

 Constant Dollar Change                          6%       -      14%           4%         7%          12%

                      % of Sales              100%      55%      45%          62%       22%           16%

                                                 Strong growth across all regions

* Americas includes North and South America                                                         © 2021 Sealed Air   |9
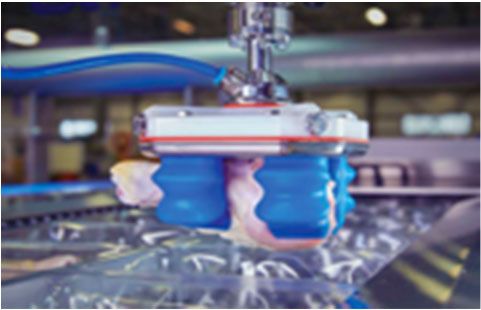
2021 First Quarter Earnings - Ted Doheny, President & CEO Chris Stephens, SVP & CFO Lori Chaitman, VP Investor Relations - Investors
YoY Sales Trends
   Q1 volume up in all regions led by double-digit growth in Protective

    2020
                    Growth %                      Growth %                     Volume %                            Price %
    2021             As Reported                  Constant Dollar          Excluding Acquisitions             Excluding Acquisitions

               Q1   Q2    Q3    Q4     Q1   Q1    Q2    Q3    Q4    Q1   Q1    Q2    Q3    Q4   Q1      Q1      Q2    Q3       Q4         Q1

    Food        2   (5)   (3)      -    2    5      -   (1)    -     -    5    (2)   (2)    -       -     -      1       1       -         1

Protective     12    6     9     8     17   13     8     8     7    14   (2)   (8)    4     7   13      (1)     (1)    (1)     (1)         1

     SEE        6   (1)    2     3      8    8     3     3     3     6    2    (4)    1     3       5     -       -      -       -         1

Americas        8     -    1     1      3   11     3     4     4     4    3    (6)    1     4       3   (1)      1       -     (1)         1

   EMEA         4   (3)    2     5     14    7      -     -    1     7    1    (5)   (2)    -       7     -       -      -       1          -

   APAC       (5)    1     4     9     23   (1)    4     1     4    12   (2)    3     1     4   13        -       -      -       -        (1)

     SEE        6   (1)    2     3      8    8     3     3     3     6    2    (4)    1     3       5     -       -      -       -         1

           Strength in eComm, automation, industrials and food retail offset by food service declines

                                                                                                                      © 2021 Sealed Air   | 10
SEE Q1 Net Sales & Adjusted EBITDA

                ($M)                             8% Net Sales
                                                                        25    1,267
                                              60           8
                                1,174

                                                   Constant Dollar 6%

                               Q1 2020     Volume         Price         FX   Q1 2021                            Growth largely driven by
                                                                                                                strength in Protective &
                                                6% Adj. EBITDA
                                                                                   21.2% Margin
                                                                                                                 Reinvent SEE benefits
                                        19
                                                                             4        268
                                                                  10
                       21.6% Margin
                           253
                                                    -18
                                                   Constant Dollar 4%

                         Q1 2020      Volume       P/C *       Op.Op.
                                                                   Costs *   FX      Q1 2021

* Q1 Reinvent SEE benefits $14M: $1M Price Cost Spread (P/C); $13M Operating Costs, including $4M Restructuring Savings              © 2021 Sealed Air   | 11
Reinvent SEE Creating Structural & Cultural Change
    Growth workstream accelerating innovation and penetrating adjacent markets
                                                                                                             Reinvent SEE Benefits
                                                                                                                     (Adj. EBITDA, $M)
     ($M)                ’18 & ‘19   2020   Q1 ‘21                                                                                        ~ 355
                                                                                                       356
                                                                                                       351
                                                                                                       346
                                                                                                       341
                                                                                                       336
                                                                                                       331
             Total                                                                                     326
                                                                                                       321
                                                                                                       316
                                                                                                       311
                                                                                                       306
                                                                                                       301
                                                      Reinventing how we innovate to solve             296
                                                                                                       291
                                                                                                       286
                                                                                                       281
                                                                                                       276
       YoY Benefits        172       118      14                                                       271
                                                                                                       266
                                                                                                       261
                                                                                                       256
                                                                                                       251
                                                                                                       246
                                                                                                       241
                                                                                                       236
                                                                                                       231
                                                                                                       226
                                                                                                       221
                                                                                                       216     172
                                                                                                       211
                                                                                                       206
                                                                                                       201
                                                                                                       196
                                                                                                       191
                                                                                                       186
                                                                                                       181
                                                                                                       176
                                                                                                       171
                                                                                                       166
                                                                                                       161
                                                                                                       156               118
                                                                                                       151
                                                                                                       146
                                                                                                       141
                                                                                                       136
                                                                                                       131
                                                                                                       126
                                                      Logistics rate improvements                      121
                                                                                                       116
                                                                                                       111
                                                                                                       106
                                                                                                       101
                                                                                                        96                       ~ 65
                                                                                                        91
                                                                                                        86
                                                                                                        81
                                                                                                        76
                                                                                                        71
                                                                                                        66
                                                                                                        61
                                                                                                        56
                                                                                                        51
                                                                                                        46
                                                                                                        41
                                                                                                        36
  Price / Cost Spread                                 Strategic value capture                           31
                                                                                                        26
                                                                                                        21
                                                                                                        16
                                                                                                        11
                                                                                                         6
                             37       14       1                                                         1
                                                                                                        -4
         YoY Benefits                                 Non-market price movements                             '18 & '19    '20     '21E     Total
                                                      Procurement savings
                                                                                                         Reinvent SEE Cash Payments
Total Operating Costs
        YoY Benefits        135      104      13      SG&A efficiency and savings on indirect spend
                                                                                                       225($M)                           ~ 205
                                                                                                       220
                                                                                                       215
                                                                                                       210
                                                                                                       205
                                                      Manufacturing network efficiencies               200
                                                                                                       195
                                                                                                       190
                                                                                                       185
      Operating Costs                                                                                  180
                                                                                                       175
                                                                                                       170
                                                                                                       165
                                                                                                       160
                                                                                                       155
                                                                                                       150
        YoY Benefits         64       71        9     Yield improvements and gauge optimization        145
                                                                                                       140
                                                                                                       135
                                                                                                       130
                                                                                                       125
                                                                                                       120
                                                                                                       115
                                                                                                       110     91
                                                      Material substitution & alternate raw material   105
                                                                                                       100
                                                                                                        95
                                                                                                        90                74
                                                                                                        85
                                                                                                        80
                                                                                                        75
                                                                                                        70                       ~ 40
         Restructuring                                                                                  65
                                                                                                        60
                                                                                                        55
                                                                                                        50
                             71       33        4     Delayering & simplifying organization             45
                                                                                                        40
                                                                                                        35
                                                                                                        30
         YoY Savings                                                                                    25
                                                                                                        20
                                                                                                        15
                                                                                                        10
                                                                                                         5
                                                                                                         0
                                                                                                             '18 & '19    '20     '21E     Total

            2021 Reinvent SEE benefits ~$65M, ~50% flow through from 2020 actions
                         One SEE Operating Engine to continue driving productivity above inflation beyond 2021

                                                                                                                                © 2021 Sealed Air   | 12
Food Q1 Net Sales & Adjusted EBITDA

                ($M)                                2% Net Sales
                                                                           11         702

                                 690                         4

                                               -3
                                                    Constant Dollar Flat

                                Q1 2020      Volume         Price           FX   Q1 2021
                                                                                                            Retail and automation strength
                                               Flat Adj. EBITDA                                              offset food service softness
                       22.6% Margin                                                     22.3% Margin
                           156                                      11           1           157

                                        -4

                                                       -8
                                                     Constant Dollar Flat

                         Q1 2020      Volume         P/C *       Op.Op.
                                                                     Costs *     FX         Q1 2021

* Q1 Reinvent SEE benefits $10M: $1M Price Cost Spread (P/C); $9M Operating Costs, including $2M Restructuring Savings             © 2021 Sealed Air   | 13
Protective Q1 Net Sales & Adjusted EBITDA

               ($M)                            17% Net Sales
                                                                      15         565
                                             63           4

                                484

                                                Constant Dollar 14%

                              Q1 2020      Volume        Price        FX     Q1 2021
                                                                                                       Strong growth across geographies
                                               18% Adj. EBITDA                                          led by eCommerce & automation
                                       23                                          19.5% Margin
                                                                            4           110
                                                                 1
                       19.2% Margin
                           93
                           93                      -10

                                                  Constant Dollar 15%

                        Q1 2020       Volume      P/C *       Op.Op.
                                                                  Costs *   FX         Q1 2021

* Q1 Reinvent SEE benefits $4M: $0M Price Cost Spread (P/C); $4M Operating Costs, including $2M Restructuring Savings          © 2021 Sealed Air   | 14
Free Cash Flow
     Growth largely driven by higher Adj. EBITDA and lower tax & restructuring payments

                                                                                                 Three Months Ended Mar. 31,
                                               ($M)                                                    2021        2020
                                                                                 Adjusted EBITDA        268         253
                                                Interest payments, net of interest income                  (41)      (47)
                                                      Income tax payments, net of refunds                   2        (16)
                                       Reinvent SEE, restructuring & assoc. payments                       (5)       (26)
                                                     Change in trade working capital, net 1                (55)      (56)
                                                            Change in other assets/liabilities             (89)      (67)
                                                   Cash flow provided by operating activities              80        41
                                                                             Capital expenditures          (44)      (49)
                                                                                  Free Cash Flow           36        (8)

                                      Raising Free Cash Flow Outlook $520 to $570M

1 Includes   cash from trade receivables, inventory, customer advance payments, and accounts payable net                       © 2021 Sealed Air   | 15
Capital Allocation to Create Economic Value

Investing for Strategic Growth:                                                                                      Returning Capital to Shareholders:
  Attractive markets, innovate faster & disruptive technology                                                         Net Leverage, FCF Conversion
        Solution platforms for automation, equipment systems and service                                                Q1 2021 Net Debt / LTM Adj. EBITDA                      3.2x
        Sustainability to deliver our plastics & net-zero carbon emission pledges                                       2021 FCF Conversion1 Outlook                           ~48%
        Smart packaging and digital printing, eCommerce
                                                                                                                      Dividends
        Convert rigids to sustainable flexibles, fluids & liquids packaging
                                                                                                                        Q1 2021 Cash dividend $26M or $0.16 per share
        SEE Ventures: early-stage disruptive technology / businesses
                                                                                                                        Dividend payout ratio 2 20%
  2021 Capital Expenditures ~$210M
                                                                                                                      Share Repurchase
        Focusing on breakthrough processes, automation, digital, sustainability
                                                                                                                       Q1 2021 Repurchased 4M shares for $177M
            Investing ~25% in circularity & net-zero carbon emission goals
                                                                                                                       ~$500M remaining under current authorization
            ~40% growth ~45% maintenance ~15% cost/productivity

                 Driving Industry Leading ROIC 3 with Economic Value Added
                                   Financial policy leverage ratio change to ‘3.5x or below’ from ‘3.5 to 4x’

1 FCF   Conversion: Free Cash Flow / Adj. EBITDA   2 Dividend   payout ratio: annual dividend per share / Adj. EPS   3 LTM   ROIC ~ 15%, calculation in appendix   © 2021 Sealed Air   | 16
2021 Outlook
          Net Sales                       Adj. EBITDA                       Adj. EPS                 Free Cash Flow
   $5.25 to $5.35B                    $1.12 to $1.15B                  $3.40 to $3.55              $520 to $570M
       As Reported 7 – 9%                As Reported 7 – 9%              As Reported 6 – 11%            Capex ~$210M

    Favorable Currency ~1.5%          Favorable Currency ~1.5%                D&A ~$235M             Restr. Payments ~$40M
                                                                         Int. Exp., Net ~$170M
     Constant Dollar 6 – 8%                 Margin ~21.4%
                                                                        Adj. Tax Rate 26 – 27%
 Food 4 – 6%, Protective 8 – 10%

                                              Outlook Range Variables
         –    Food service recovery                           +   Equipment, eComm, Food Retail strength
         –    Material inflation & supply dynamic             +   Industrial rebound accelerates
                                                              +   SEE Operating Engine outperforms

                   Raising guidance to reflect business momentum acceleration
 Previous Guidance (Feb 2021)

            Net Sales                        Adj. EBITDA                       Adj. EPS                 Free Cash Flow
           $5.1 to $5.2B                    $1.10 to $1.13B                  $3.25 to $3.40             $500 to $550M
                                                                                                                © 2021 Sealed Air   | 17
Our 4P’S of Reinvent SEE
            SM                         TM

Transformation focused on Zero Harm, automation, digital, and sustainability for growth

  Performance: World-class One SEE Operating Engine

  People: SEE high performance culture

                                                                                          Operating Engine
  Products: Best solutions, right price, make them sustainable

  Processes: SEE Operational Excellence culture

  Sustainability: In everything we do, ESG fueling our growth

                  We are in business to protect,
              to solve critical packaging challenges,
          and to make our world better than we found it.

                                                                                                   © 2021 Sealed Air   | 18
Appendix
U.S. GAAP Summary & Reconciliations

                                      © 2021 Sealed Air   | 19
U.S. GAAP Summary & Reconciliations

                                                         Three Months Ended March 31,
                                                           2021              2020
         ($M, except tax rate and per share data)                                                                              Q1 '21 Net Debt / Adjusted EBITDA
                                                                                                         ($ millions)
                                   Net Sales             $      1,267.1          $       1,173.9
                                                                                                         Non-U.S. GAAP Total Company Adj EBITDA (LTM)                           $   1,066
 Pre-tax Earnings from Continuing Operations                      160.4                    147.2
                                                                                                          Total Debt                                                            $   3,737
    Net Earnings from Continuing Operations                       105.8                    114.5          Less: cash and cash equivalents                                             370
    EPS from Continuing Operations (Diluted)            $          0.68         $           0.74         Net Debt                                                               $   3,367
                          Effective Tax Rate                     34.0%                    22.2%          Net Debt / Adjusted EBITDA                                                    3.2
                        Operating Cash Flow             $          79.9         $           41.0

                                                                                                                       Three Months Ended March 31,
                                                                                                                     2021                       2020
                  ($M, except per share data)                                                              Net Earnings Diluted EPS Net Earnings Diluted EPS
                  U.S. GAAP net earnings and diluted EPS from continuing operations                        $        105.8      $      0.68    $       114.5     $       0.74
                  Special Items(1)                                                                                      16.0          0.10             (1.1)           (0.01)
                  Non-U.S. GAAP Adjusted net earnings and adjusted diluted EPS                             $        121.8      $      0.78    $       113.4     $       0.73
                  Weighted average number of common shares outstanding - Diluted                                                    155.4                              154.8
                   1 Special Items for the three months ended March 31, 2021 includes $7.8 million in pre-tax Special Items, a $(0.9) million tax benefit on those items, and
                   $9.1 million in Tax Special Items.
                   Special Items for the three months ended March 31, 2020 includes $10.1 million in pre-tax Special Items, a $(2.6) million tax benefit on those items, and
                   $(8.6) million in Tax Special Items.

                                                                                                                                                                      © 2021 Sealed Air   | 20
LTM Adjusted EBITDA and Adjusted Tax Rate
                                                                                                       Three months ended
                                                               ($M) Mar. 31, 2021    Dec. 31, 2020       Sep. 30, 2020    Jun. 30, 2020     Mar. 31, 2020
             U.S. GAAP Net earnings from continuing operations               105.8             137.5               131.8            100.3             114.5
                                             Interest expense, net            43.1              43.7                43.0             43.3              44.4
                                              Income tax provision            54.6              47.4                17.4             44.6              32.7
                                    Depreciation and amortization             56.9              55.4                56.2             53.4              51.5
                                                    Special Items:
                                            Restructuring charges                -             (0.7)                1.0              10.1              0.6
                              Other restructuring associated costs             5.3              4.5                 7.2               3.8              4.0
  Foreign currency exchange loss due to high inflationary economies            1.4               1.5                1.1               1.2              0.9
                          Increase in fair value of equity investment            -            (15.1)                  -                 -                -
                Charges related to acquisition and divestiture activity        0.3              2.0                 1.0               1.2              2.9
                                                   Other special items         0.8              2.5                 0.6               2.0              1.7
                                       Pre-tax impact of special items        7.8              (5.3)               10.9             18.3              10.1
                Non-U.S. GAAP Total Company Adjusted EBITDA                 268.2             278.7               259.3            259.9             253.2
                          Last twelve months Adjusted EBITDA              1,066.2

                U.S. GAAP Earnings before income tax provision              160.4             184.9               149.2            144.9             147.2
                                Pre-tax impact of Special items               7.8              (5.3)               10.9             18.3              10.1
 Non-U.S. GAAP Adjusted Earnings before income tax provision                168.2             179.6               160.1            163.2             157.3

                                 U.S. GAAP Income tax provision              54.6              47.4                17.4             44.6              32.7
                                               Tax Special Items             (9.1)             (5.9)               12.6             (3.2)              8.6
                                      Tax impact of Special Items              0.9             (1.5)                3.0               3.5              2.6
                    Non-U.S. GAAP Adjusted Income Tax Provision              46.4              40.0                33.0             44.9              43.9

                                U.S. GAAP Effective income tax rate        34.0%             25.6%               11.7%             30.8%            22.2%
                            Non-U.S. GAAP Adjusted income tax rate         27.6%             22.3%               20.6%             27.5%            27.9%

                                                                                                                                              © 2021 Sealed Air   | 21
ROIC Calculation LTM March 31, 2021
                                                                                                                       Q1 2021 Trailing Twelve Months

                                                                                               ($M, except tax rate data)

                                                                                                       Adjusted EBITDA (Non-GAAP)                 1,066
                                                                                                  Less: Depreciation and Amortization             (222)
                                                                                                             Adjusted Operating Profit              844
                                                                                                   Adjusted Tax Rate (Non-GAAP)1                   24%
                                                                                                   Tax on Adjusted Operating Profit               (207)
                                                                                           Net Adjusted Operating Profit After Tax                  637

                                                                                                          Q1 '20            Q1 '21        Avg: '20 & '21

                                                                             Book value of Equity             (182)             101                (40)
                                                                (Total Stockholders' (Deficit) Equity
                                        Current and Long-Term Debt and Operating Leases2                      3,958            3,810              3,884

                                                                     Other Long-Term Liabilities                738             736                 737
                                                       (Deferred taxes; Other non-current liabilities)
                                                                    Less: Non-Operating Assets                (278)            (370)              (324)
                            (Cash/equivalents; Marketable Securities; Current Assets Held for Sale)

                                                                                     Total Capital            4,236            4,277              4,257

                                                                 Returned on Invested Capital                                                      15%

 1 Adjusted   Tax Rate represents blended average over last 12 months; refer to previous slide for Adjusted Tax Rate reconciliation by quarter.
 2 Short-term   borrowings, Long-term Debt (Current and non-current); and Operating Lease Liabilities (Current and Non-current)
                                                                                                                                                           © 2021 Sealed Air   | 22
U.S. GAAP Summary & Reconciliations
 Full Year Historical Performance
                                                                                             Twelve Months Ended Dec. 31,
                                                                                 2020           2019            2018             2017
                          ($ millions, except tax rate and per share data)
                                                         Net Sales           $    4,903.2     $    4,791.1     $   4,732.7   $    4,461.6
                       Pre-tax Earnings from Continuing Operations                  626.2            370.3           457.8          393.3
                                      Net Earnings from Cont. Ops.                  484.1            293.7           150.3           62.8
                                     EPS from Cont. Ops. (Diluted)           $       3.10     $       1.89     $      0.94   $       0.33
                                                Effective Tax Rate                 22.7%            20.7%           67.2%          84.0%
                                              Operating Cash Flow            $      737.0     $      511.1     $     428.0   $      424.4

                                                              ($ millions)
                           U.S. GAAP Net earnings from Cont. Ops.            $      484.1     $     293.7      $    150.3    $       62.8
                                                Interest expense, net               174.4           184.1           177.9           184.2
                                                 Income tax provision               142.1            76.6           307.5           330.5
                  Depreciation and amortization, net of adjustments                 216.5           184.5           159.0           158.3
                                                        Special items
                                               Restructuring charges                  11.0           41.9            47.8            12.1
                                Other restructuring associated costs                  19.5           60.3            15.8            14.3
                             FX loss on high inflationary economies                    4.7            4.6              2.5              -
                  Loss on debt redemption and refinancing activities                     -           16.1              1.9              -
                         Increase in fair value of equity investments               (15.1)              -                -              -
                                      Novipax settlement agreement                       -           59.0                -              -
                               Acquisitions and divestitures charges                   7.1           14.9            34.2            84.1
                                                  Other Special Items                  6.8           29.1            (7.4)         (13.0)
                                 Pre-tax impact of Special Items                     34.0           225.9            94.8            97.5
                    Non-U.S. GAAP Adj EBITDA from Cont. Ops.                 $    1,051.1      $    964.8      $    889.5    $      833.3

                                                                                                                                            © 2021 Sealed Air   | 23
You can also read