2020 Family Vacation Cost Analysis - RECREATION VEHICLE DEALERS ASSOCIATION OF CANADA, CANADIAN RECREATIONAL VEHICLE ASSOCIATION & GO RVING CANADA ...
←
→
Page content transcription
If your browser does not render page correctly, please read the page content below
2020

2020 Family Vacation
Cost Analysis

RECREATION VEHICLE DEALERS ASSOCIATION OF
CANADA, CANADIAN RECREATIONAL VEHICLE
ASSOCIATION & GO RVING CANADA
NOVEMBER 2020

PREPARED BY THE PORTAGE GROUP INC.
2020 Family Vacation Cost Comparison

                           About Recreation Vehicle Dealers Association
The Recreation Vehicle Dealers Association of Canada (RVDA) is a national federation which exists to
protect and promote the interests and welfare of RV Dealers across Canada to enable the industry to
maximize its potential. The core objective of the RVDA of Canada is to bring together and represent
the retail businesses involved in the recreation vehicle industry across Canada, thus providing the
support and strength to protect and promote the interests and welfare of Canadian RV Dealers, and to
maximize the potential of the industry for all involved.

                      About The Canadian Recreational Vehicle Association
The Canadian Recreational Vehicle Association (CRVA) is a non-profit organization comprised of leading
Recreational Vehicle Manufacturers and Suppliers of the components that go into Recreational Vehicles
that are sold in Canada. CRVA has been in existence for over 40 years and works continually to
promote all aspects pertaining to the quality and safety in the RVs built by its member companies. The
Association ensures a continuity of professional standards beneficial to the RV industry and, ultimately,
in the best interest of the consumer.

                                            About Go RVing
The Go RVing Canada coalition was formed in 1997, and consists of RV manufacturers, RV dealers and
campground operators in the multi-billion dollar Canadian RVing industry. The coalition serves as the
Canadian RV camping industry ambassador to provide the public and media with information about the
benefits of RV travel. Go RVing Canada seeks to enhance consumer information and satisfaction with
the RV experience, it’s the destination for everything RVing.

                                    About The Portage Group Inc.
The Portage Group Inc. is a consulting group with a shared passion for helping your organization
through the various stages of its journey. Our consulting team offers deep sector expertise across
multiple service areas that include: Research, Strategy, Search, Human Resources, Organizational
Performance and Governance. Through its Research and Strategy Division, the firm provides a broad
range of research services to associations and to the members they serve. For more information, please
visit www.portagegroup.com.

                                    © 2020 RVDA, CRVA & Go RVing Canada
2020 Family Vacation Cost Comparison

                                               Disclaimer
Although the information in this report has been obtained from sources that The Portage Group Inc.
believes to be reliable, its accuracy and completeness cannot be guaranteed. This report is based on
available data from sources as identified and were accurate at the time of collection in September,
October and November 2020. Travel pricing is dynamic and subject to frequent change. Accordingly,
the same prices may not be applicable at a future date. This report is for information purposes only. All
opinions and estimates included in this report are based on available data combined with our judgment
as of this date and are subject to revision.

                                               Copyright
This document contains proprietary information of the Recreation Vehicle Dealers Association of
Canada (RVDA), the Canadian Recreational Vehicle Association (CRVA) and Go RVing Canada. No
disclosure or use of any portion of the contents of this material may be made without the express
written consent of RVDA, CRVA or Go RVing Canada. For permission to reproduce any material
contained in this publication, please call RVDA at 1.604.718.6325 or by email at info@rvda.ca, CRVA at
1.905.315.3156 or by email at info@crva.ca or Go RVing Canada at 1.888.467.8464 or by email at
info@gorving.ca. If consent is granted, attribution to RVDA, CRVA, The Portage Group Inc. and other
sources specified in the document should be made. All rights reserved.
                                 © 2020 RVDA, CRVA & Go RVing Canada

                                    © 2020 RVDA, CRVA & Go RVing Canada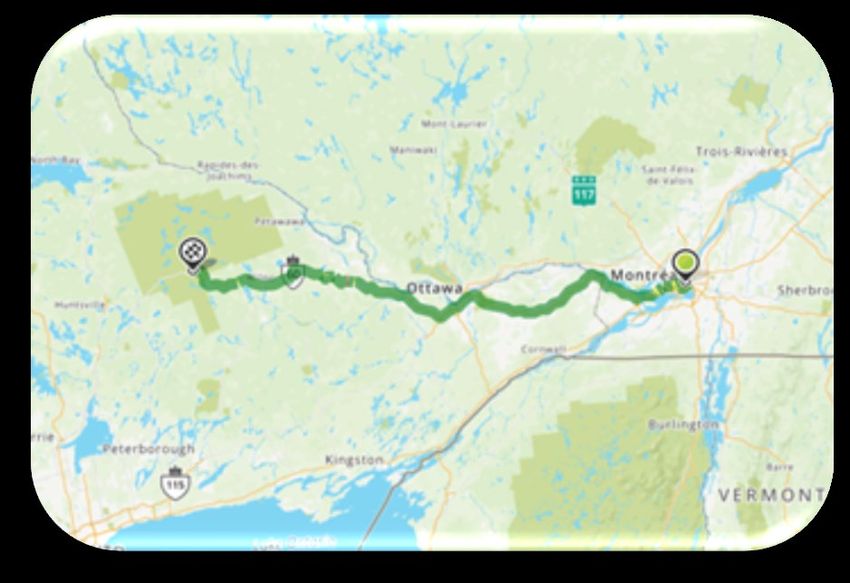
2020 Family Vacation Cost Comparison
CONTENTS
EXECUTIVE SUMMARY............................................................................................................... I
I. INTRODUCTION ............................................................................................................. 4
II. STUDY PARAMETERS AND METHODOLOGY .......................................................... 5
GENERAL STUDY PARAMETERS ..................................................................................................................................... 5
TRIP PARAMETERS ........................................................................................................................................................... 6
TRANSPORTATION COSTS ............................................................................................................................................ 9
ACCOMMODATION COSTS ......................................................................................................................................... 12
FOOD COSTS................................................................................................................................................................. 13
VEHICLE OWNERSHIP COSTS ...................................................................................................................................... 15
III. VACATION COST ANALYSIS ..................................................................................... 19
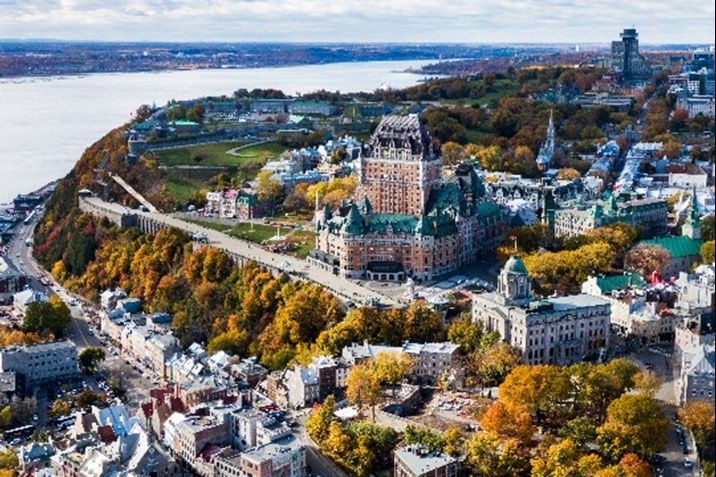
TRIP 1 – MONTREAL (QC) TO ALGONQUIN PROVINCIAL PARK .......................................................................... 20
TRIP 2 – HALIFAX (NS) TO QUEBEC CITY (QC) ..................................................................................................... 22
TRIP 3 – TORONTO (ON) TO STURGEON FALLS (ON) ........................................................................................ 24
TRIP 4 – BRANDON (MB) TO DRUMHELLER (AB) ................................................................................................... 26
TRIP 5 – VANCOUVER (BC) TO BANFF NATIONAL PARK (AB) ............................................................................ 28
IV. CONCLUSIONS .............................................................................................................. 30
© 2020 RVDA, CRVA & Go RVing Canada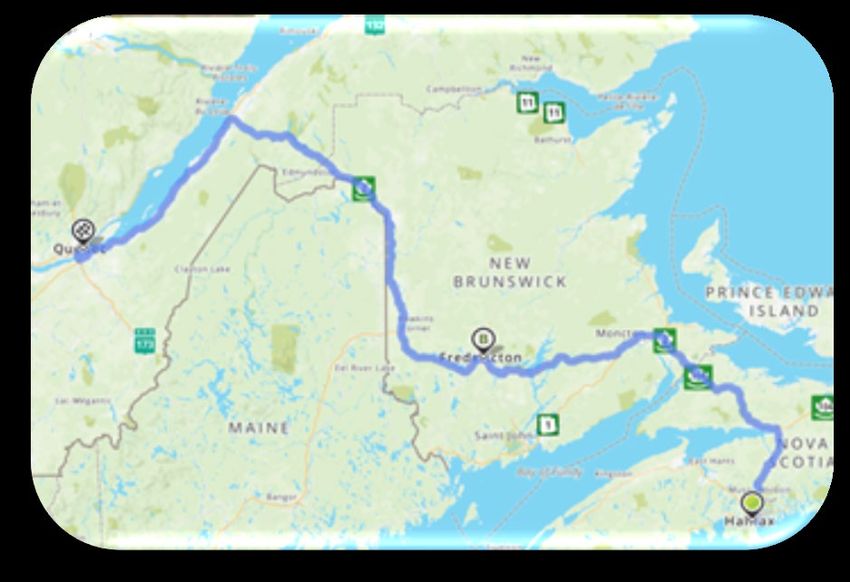
2020 Family Vacation Cost Comparison

EXECUTIVE SUMMARY

For many Canadians, recreation vehicles (RVs) are more than just a convenient way to travel and enjoy
the outdoors, it is a way of life. However, travellers today have a wide range options when it comes to
vacation travel. Not only do travellers have traditional options such as hotels, motels, resorts and
campgrounds, but the last decade has seen a significant rise in private rental options through platforms
like Airbnb.

First time RV purchasers often ask the significant question of whether or not there is cost savings when
travelling by RV vs traditional travel. The purpose of this study is to answer this question by providing a
cost comparison between vacations taken via RV and those where travellers stay in hotels or private
rentals and travel by other means.

This report summarizes the approach, assumptions and analysis used to compare the different travel
options.

VACATION COST ANALYSIS

The vacation cost analysis was based on a hypothetical family consisting of two adults and two children,
travelling by different modes of transportation and staying in different types of accommodation. The
following five trips were analyzed:

    •   Trip 1 – Montreal, QC to Algonquin Provincial Park, ON for 3 Days
    •   Trip 2 – Halifax, NS to Quebec City, QC for 10 Days
    •   Trip 3 – Toronto, ON to Sturgeon Falls, ON for 3 Days
    •   Trip 4 – Brandon, MB to Drumheller, AB for 10 Days
    •   Trip 5 – Vancouver, BC to Banff National Park, AB for 7 Days

For each of the five trips, major vacation costs were calculated for six scenarios (trip configurations) as
follows:

    1. Tent Camping Trailer: Family travelling in a personal car, towing a tent camping trailer,
       staying at campgrounds, and preparing all meals in the RV or outdoors at campsites.

    2. Travel Trailer: Family travelling in a personal light duty truck or SUV, towing a travel trailer,
       staying at campgrounds, and preparing all meals in the RV or outdoors at campsites.

    3. Class C Motorhome: Family travelling in a class C motorhome, staying at campgrounds, and
       preparing all meals in the RV or outdoors at campsites.

                                      © 2020 RVDA, CRVA & Go RVing Canada                                      i
2020 Family Vacation Cost Comparison

    4. Personal Car - Hotel: Family travelling in a personal car, staying at hotels/motels, and eating
       meals in restaurants.

    5. Personal Car – Airbnb: Family travelling in a personal car, staying at Airbnb rentals in the
       destination and hotels/motels in stopover locations. Meals are eaten in restaurants during travel
       and in the rental property at the destination.

    6. Air Travel: Family travelling by air to the destination, renting a car, staying at hotels/motels,
       and eating meals in restaurants.

Exhibit 1 provides a summary of the total costs and cost per day for each trip for each of the six trip
configurations.

 Exhibit 1 – Vacation Cost Analysis Summary

                                      Tent                       Class C       Personal    Personal
                                                   Travel                                                  Air
                                    Camping                      Motor-          Car/        Car/
                                                   Trailer                                                Travel
                                     Trailer                      home          Hotel       Airbnb
 Trip 1 – Montreal to Algonquin Provincial Park – 3 Days
 Total Cost                    $1,272    $1,331     $1,518                       $2,025       $1,498       $4,321
 Cost per Day                   $424       $444      $506                         $675         $499        $1,440
 Trip 2 – Halifax to Quebec City – 10 Days
 Total Cost                    $3,918    $4,033     $5,812                       $6,670       $4,344       $8,971
 Cost per Day                   $392       $403      $581                         $667         $434         $897
 Trip 3 – Toronto to Sturgeon Falls – 3 Days
 Total Cost                    $1,142    $1,188     $1,442                       $1,740       $1,477       $2,668
 Cost per Day                   $381       $396      $481                         $580         $492         $889
 Trip 4 – Brandon to Drumheller – 10 Days
 Total Cost                    $3,864    $3,979     $5,710                       $6,045       $4,400       $7,662
 Cost per Day                   $386       $398      $571                         $605         $440         $766
 Trip 5 – Vancouver to Banff National Park – 7 Days
 Total Cost                    $2,777    $2,887     $3,930                       $4,947       $3,794       $6,076
 Cost per Day                   $397       $412      $561                         $707         $542         $868

CONCLUSIONS
Based on the parameters and data samples in this study, RV vacations are generally less expensive than
those where the travel party stays in a hotel/motel. However, while towable RVs are more economical
than private property rentals, an Airbnb vacation can be more economical than one in a class C
motorhome.

The difference in the cost of vacations in tent camping trailers and travel trailers tends to be small
despite travel trailers carrying a higher initial price tag. The reasons behind this are twofold. First, the
residual percentages tend to be a bit stronger compared to the actual price paid on travel trailers.
Second, the average number of nights travel trailer owners use their RV per year is considerably higher

                                         © 2020 RVDA, CRVA & Go RVing Canada                                        ii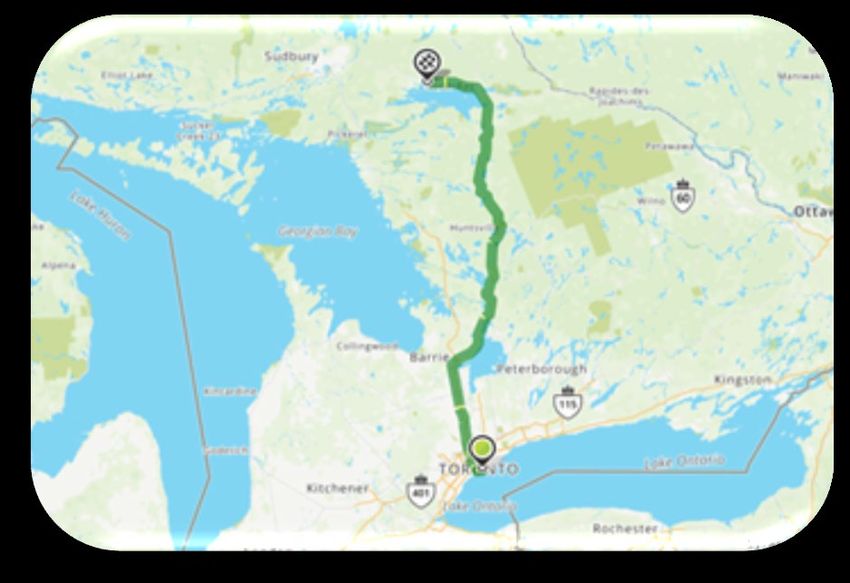
2020 Family Vacation Cost Comparison

than among owners of tent camping trailers. So while the average annual total cost is significantly higher
on a travel trailer, the daily cost (based on days used) is only slightly higher.

The lowest cost vacations are those taken in tent camping trailers and travel trailers. For the
hypothetical travel party these trip configurations were, on average, 16% lower than driving and staying
in Airbnbs, 37% lower than driving and staying in hotels and 57% lower than flying and staying in hotels.
The actual cost difference varies significantly depending on the cost of accommodations in a destination,
trip length and distance. The savings range was 7% to 27% compared to Airbnb, 32% to 44% compared
to drive and hotel and 48% to 71% compared to flying.

Class C motorhomes represent a more significant investment. This results in this type of vacation being
similarly priced to some Airbnb vacations and more expensive than others depending on the cost of the
Airbnb. For three of the trips, the different in cost was within 5%. For the other two, Airbnb trips were
more economical by 27% and 35%.

Class C motorhome trips were however more economical than trips where travellers stayed in hotels.
For the hypothetical travel party these trip configurations were, on average, 16% lower than driving and
staying in hotels and 41% lower than flying and staying in hotels. The cost difference varies significantly
depending on the cost of accommodations in a destination, trip length and distance. The savings range
was 6% to 25% compared to drive and hotel and 25% to 65% compared to flying.

The RV cost of ownership per day is based on the number of days the RV is used through the year and
is a significant driver of total trip cost. The more often a travel party travels, the lower the daily cost of
ownership which would widen the cost gap in favour of RVs. Likewise, holding onto the RV longer will
also generally result in a lower daily cost of ownership.

                                       © 2020 RVDA, CRVA & Go RVing Canada                                     iii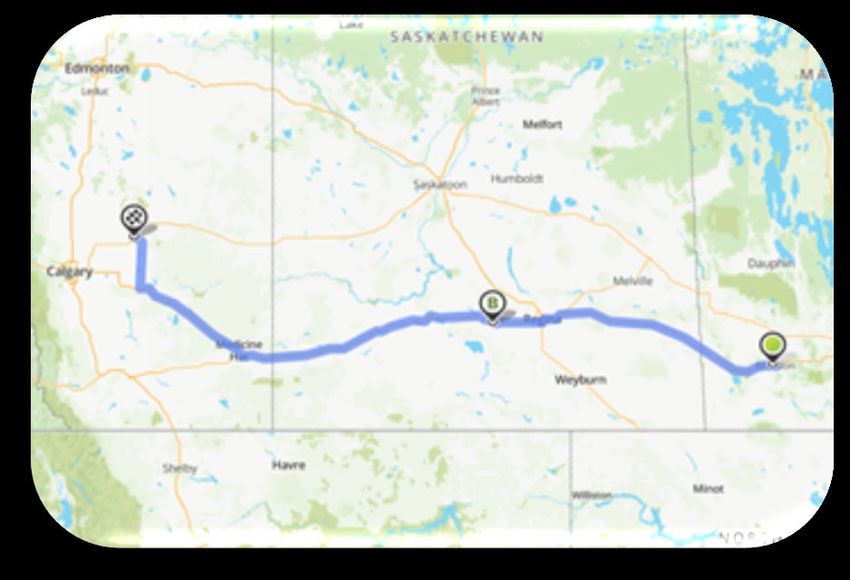
2020 Family Vacation Cost Comparison

 I.     INTRODUCTION

For many Canadians, recreation vehicles (RVs) are more than just a convenient way to travel and enjoy
the outdoors, it is a way of life. However, travellers today have a wide range options when it comes to
vacation travel. Not only do travellers have traditional options such as hotels, motels, resorts and
campgrounds, but the last decade has seen a significant rise in private rental options through platforms
like Airbnb.

First time RV purchasers often ask the significant question of whether or not there is cost savings when
travelling by RV vs traditional travel. The purpose of this study is to answer this question by providing a
cost comparison between vacations taken via RV and those where travellers stay in hotels or private
rentals and travel by other means.

This report summarizes the approach, assumptions and analysis used to compare the different travel
options.

                                      © 2020 RVDA, CRVA & Go RVing Canada                                     4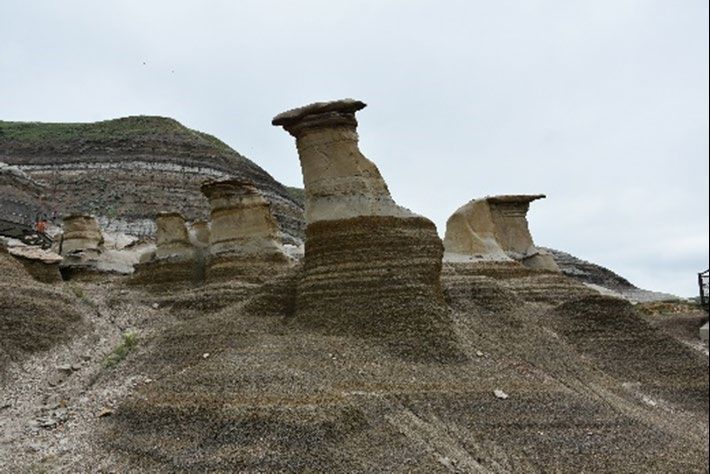
2020 Family Vacation Cost Comparison

II.       STUDY PARAMETERS AND METHODOLOGY

This section provides a detailed summary of the approach used to undertake the vacation cost analysis.
It includes an overview of key parameters, assumptions and background data along with details about
how the data was applied.

GENERAL STUDY PARAMETERS

Following are the general parameters for the vacation cost analysis:

      •   Data collection was completed in September, October and November 2020.

      •   Trips were assumed to be starting on Friday, July 16, 2021.

      •   Costs analyzed include major cash or credit expenditures from the start of the hypothetical trip
          to the end. Major costs include airfare, car rental, fuel, accommodation (hotel, campsite or
          Airbnb) and food (grocery and/or restaurant). Incidental expenses, such as entertainment,
          shopping and activities were not considered as they are unlikely to vary by mode of
          transportation or type of accommodations used.

      •   For those travelling by RV, the cost of ownership (depreciation, maintenance, insurance and
          storage) is factored in based on the average nights RVs are used each year.

      •   Costs also include wear and tear on personal vehicles for the trip. However, as most families
          are likely to own a personal vehicle, the cost of owning a personal vehicle is not included.

      •   All trips analyzed were taken exclusively in Canada.

      •   A vacation is defined as a non-work-related trip take for pleasure and/or leisure.

      •   Vacations that include overnight stays in the homes of friends and relatives were not analyzed in
          this study.

Study Limitations
The purpose of the analysis is to provide a general idea of the difference in cost for different vacation
profiles. The analysis is not intended to be representative of all trips. The analysis is based specifically on
the sample data selected for the analysis based on assumptions about the level of accommodations used,
grocery and restaurant choices and other trip variables. The costs of actual trips will vary depending on
the actual choices made by the travel party.

                                       © 2020 RVDA, CRVA & Go RVing Canada                                     5
2020 Family Vacation Cost Comparison

TRIP PARAMETERS

TRAVEL PARTY

For the purpose of this study, all vacation trip costs are based on
the same hypothetical travel party. The hypothetical travel party
used in the vacation cost analysis is a family of four comprised of
two adults and two children – one under the age of 12 and one
over the age of 12.

The rationale for the travel party having both a child under 12 and a child over 12 is that party
composition sometimes impacts the cost of accommodation. Where applicable, the age of the children
was included in the accommodation parameters.

VACATION LOCATIONS

Vacation destinations were selected in conjunction with Go RVing Canada. The destinations selected
are all highly popular RV destinations. Origins were selected based upon travel distance and the
availability of commercial air service while also ensuring the distance between origin and destination was
large enough that air travel is a realistic alternative. The origins and destinations are consistent with
previous studies. The following table lists the origin, destination, and duration of each of the trips
analyzed.
                                      Origin                          Destination                Duration

                                                           Algonquin Provincial
                        Montreal, QC                                                          3 Days
                                                           Park, ON

                        Halifax, NS                        Quebec City, QC                    10 Days

                        Toronto, ON                        Sturgeon Falls, ON                 3 Days

                        Brandon, MB                        Drumheller, AB                     10 Days

                        Vancouver, BC                      Banff National Park, AB            7 Days

                                     © 2020 RVDA, CRVA & Go RVing Canada                                     6
2020 Family Vacation Cost Comparison
SELECTED RV TYPES
There are several different types of RVs available to consumers. For the purpose of the vacation cost
analysis, the study focuses on three specific types of RVs including:
• Tent camping trailers
• Travel trailers
• Class C motorhomes
The types of RVs were selected in consultation with Go RVing Canada and are consistent with those
analyzed in previous studies. Following is a brief description of each of the three RV types.
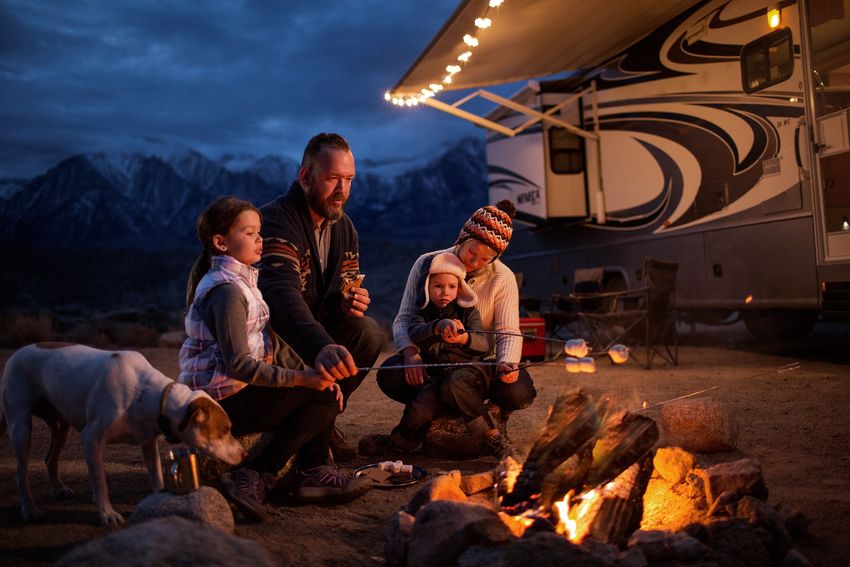
Tent Camping Trailer
Known as pop-up’s and fold-down trailers, these
versatile, hard-working tent camping trailers
have been a feature in many family histories.
They are often bought as a first trailer, are
lightweight enough to be towed by virtually any
car and can be found in many lengths with
options such as hot water, refrigerator, air conditioning and washrooms. 1 For the purpose of this study,
it was assumed the travel party used a tent camping trailer weighing approximately 2,000 pounds
(between 1,500 pounds and 3,000 pounds).
Travel Trailer
These compact homes can be towed by a car,
SUV or pick-up truck and hauled all over the
country. RV travel trailers come in endless sizes
and many feature garages, roof top patios, bay
windows, fireplaces, offices, hideaway beds,
expanding sides, and lowering roofs. 2 For the
purpose of this study, it was assumed the travel party used a lightweight travel trailer weighing
approximately 4000 pounds (between 3,000 pounds and 5,500 pounds).
1 https://gorving.ca/rv/tent-camping-trailer
2 https://gorving.ca/rv/travel-trailer
© 2020 RVDA, CRVA & Go RVing Canada 72020 Family Vacation Cost Comparison
Class C Motorhome
Class C Motorhomes are built on a commercial
cut-away van chassis and come with all the
amenities of any motorhome. Equipped with full
sleeping, kitchen, dining, and bathroom facilities
found in a conventional motorhome, as well as
entertainment systems and plenty of storage.
Gas or diesel models are available, and they can typically sleep 5-7 comfortably. 3
TRIP CONFIGURATION
For each of the five trips, major vacation costs were calculated for six scenarios (trip configurations) as
follows:
1. Tent Camping Trailer: Family travelling in a personal car, towing a tent camping trailer,
staying at campgrounds, and preparing all meals in the RV or outdoors at campsites.
2. Travel Trailer: Family travelling in a personal light duty truck or SUV, towing a travel trailer,
staying at campgrounds, and preparing all meals in the RV or outdoors at campsites.
3. Class C Motorhome: Family travelling in a class C motorhome, staying at campgrounds, and
preparing all meals in the RV or outdoors at campsites.
4. Personal Car - Hotel: Family travelling in a personal car, staying at hotels/motels, and eating
meals in restaurants.
5. Personal Car – Airbnb: Family travelling in a personal car, staying at Airbnb rentals in the
destination and hotels/motels in stopover locations. Meals are eaten in restaurants during travel
and in the rental property at the destination.
6. Air Travel: Family travelling by air to the destination, renting a car, staying at hotels/motels,
and eating meals in restaurants.
Travel Dates
All trips were assumed to have started on Friday, July 16, 2021. Trips ranged from 3 to 10 days in length.
The number of days for each trip is related to the round-trip driving distance.
3 https://gorving.ca/rv/class-c-motorhome
© 2020 RVDA, CRVA & Go RVing Canada 82020 Family Vacation Cost Comparison
TRANSPORTATION COSTS
The vacation cost analysis includes the following transportation costs:
• Round-trip commercial airfare
• Rental vehicle fees
• Fuel cost of personally owned or rental vehicles
Below is a summary of the approach and information sources used to determine the transportation
cost.
AIRFARES
For trip profiles where the travel party flew to the destination, it was assumed that they flew from their
origin city to the airport closest to the destination with commercial flights available. Round trip airfares
were gathered directly from the airline’s websites for major airlines, Air Canada, West Jet and Porter (in
the east). It was assumed that the theoretical travel party would select the lowest economy fare for the
given travel dates. All airfares were collected in September, October and November 2020 for a trip
starting on July 16, 2021. Airfares include all fees and taxes. It should be noted that airfares are
dynamically priced and can change from day to day. Accordingly, the rates found for this study may not
be available, or may not be the cheapest, at a later date.
Note: The average airfare for each trip configuration is presented with the trip cost summaries later in this
report.
RENTAL CAR
Those travelling by air were assumed to have rented a standard mid or full-size car from a national car
rental company for the duration of their stay in the destination. Further, it was assumed that they would
rent the vehicle from an airport rental facility. Collision damage waiver fees, personal accident insurance
fees, and additional insurance fees were not included in the cost calculation as they are not mandatory
and are automatically covered by many personal auto insurance policies and/or credit cards. Car rental
fees were gathered directly from the rental agency websites in September, October, and November
2020.
Note: The average car rental fee for each trip configuration is presented with the trip cost summaries later in this
report.
© 2020 RVDA, CRVA & Go RVing Canada 92020 Family Vacation Cost Comparison
DISTANCE TRAVELLED
The total distance driven was calculated based on two components as follows:
• Travel Distance: The distance from the origin to the destination was obtained using the
shortest travel time route suggested by Google Maps. Where applicable, the route included
passing through a stopover city. For those who travelled by air, the distance from the
destination airport to the destination was included in the distance travelled. The travel distance
was doubled to account for the return trip.
• Activity Distance: The analysis assumes that the travel party will drive 75 kilometres per day
for activities and sightseeing. This is consistent with previous studies. For those towing an RV, it
is assumed the RV is left at the campground for these excursions.
Note: The distance driven for both components are presented with the trip cost summaries later in this report.
Maps for the route travelled for each trip is also presented in the trip summary.
FUEL ECONOMY
Fuel economy ratings for a wide range of light vehicles is tracked by Natural Resources Canada (NRC)
and can be found using their search tool at https://fcr-ccc.nrcan-rncan.gc.ca/en. According to the
Automotive Industries Association of Canada’s 2018 Outlook Study, the average age of light vehicles on
the road in Canada is 9.7 years. Accordingly, average fuel economy ratings were calculated for vehicle
model years 2001 to 2020. Average fuel economy ratings (combined city and highway) were calculated
for the following categories:
• Mid/Full Size Car or SUV: It was assumed those not towing an RV would be driving a mid or
full-size car or a SUV. The average fuel economy for these types of vehicles across model years
is 12.0 litres per 100 kilometres.
• Non-Truck Tow Vehicle: Those towing a tent camping trailer were assumed to be driving a
full-size car or SUV. The average fuel economy for these types of vehicles across model years is
12.6 litres per 100 kilometres.
• Light Truck: Those towing a travel trailer were assumed to be driving a light truck (pickup).
The average fuel economy for these types of vehicles across model years is 13.6 litres per 100
kilometres.
• Class C Motorhome: Official ratings of fuel economy were not found for class C motorhomes.
The website www.fuelly.com was used to obtain an estimate for class C motorhome fuel
economy. The website is a crowd sourced fuel economy tracking application where users enter
data used to calculate the actual fuel economy achieved. Appropriate benchmarks were
© 2020 RVDA, CRVA & Go RVing Canada 102020 Family Vacation Cost Comparison
identified for 79 class C motorhomes with a total of 1.2 million kilometres tracked. The average
fuel economy reported was 27.8 litres per 100 kilometres (or 8.4 MPG).
• Rental Car: The average fuel economy for rental vehicles was based on the common vehicle
models offered by rental companies in the mid to full size classes. The average fuel economy
across benchmark vehicles is 9.1 litres per 100 kilometres. The fuel economy ratings of specific
vehicles according to the NRC is as follows:
o 2020 Kia Forte - 8.6 L/100 KM
o 2020 Volkswagen Jetta - 7.8 L/100 KM
o 2020 Hyundai Elantra - 8.9 L/100 KM
o 2020 Toyota Corolla - 8 L/100 KM
o 2020 Chevrolet Malibu - 8.2 L/100 KM
o 2020 Dodge Charger - 12.4 L/100 KM
o 2020 Hyundai Sonata - 8.6 L/100 KM
o 2020 Toyota Camry - 10.5 L/100 KM
Impact of Towing
A search of the internet did not reveal any official data related to the impact of towing a trailer on fuel
economy. Previous studies have used the theory (based on results) of a leading trailer manufacturer
that for every 1,000 pounds, one additional gallon of fuel will be used per 100 miles. 4 This translates to
an additional 2.352 litres per 100 kilometres per 1,000 pounds. It should be noted that this estimate
does not account for the variability of trailer aerodynamics, highway wind conditions or wind resistance.
However, these will impact fuel consumption.
FUEL PRICES
Average weekly fuel prices were collected for both gasoline and diesel from Natural Resources Canada
(NRC - https://www.nrcan.gc.ca/our-natural-resources/domestic-and-international-
markets/transportation-fuel-prices/4593). Prices were gathered for all origins and destinations as well as
for all available cities along the selected routes for each vacation. For the vacation cost analysis, the
NRC data was used to calculate average fuel price for each city for the 52-week period ending October
1, 2020. As is it not possible to determine where the hypothetical travel party would fill their tanks, fuel
prices were calculated for their trips by averaging the origin, destination and route city prices to create a
regional benchmark for each trip.
The 52-week average gasoline price in Canada was $1.12 per litre. Most regional benchmarks were
within ±10% of the national average. Exceptions include Vancouver (+23%) and Calgary (-12%).
Similarly, the 52-week average diesel in Canada was $1.15 per litre. All regional benchmarks were within
±10% of the national average except for Vancouver (+11%). It is important to note that fuel prices
fluctuate significantly throughout the year and over time. Accordingly, the benchmark fuel prices may or
4 Source: “Family Vacation Cost Comparison”, Go RVing Canada 2011 and “The 2018 Vacation Cost Comparison”, RV Industry Association, 2018
© 2020 RVDA, CRVA & Go RVing Canada 112020 Family Vacation Cost Comparison
may not be reflective of the actual fuel prices for the summer of 2021 when the hypothetical trips would
occur.
Notes:
• Fuel prices assume all gasoline purchases are regular unleaded.
• The average fuel rates for each trip are presented with the trip cost summaries later in this report.
TOTAL FUEL COST
The total fuel cost is calculated by multiplying the distance driven by the appropriate fuel economy as
follows:
Kilometres / 100 X Litres per 100KM X Fuel Price per Litre
Notes:
• For those towing an RV, activity fuel was calculated using the standard fuel economy while travel fuel
economy was calculated using the standard fuel economy plus an additional 2.352 litres per 100/KM
per 1,000 pounds of trailer weight.
• Class C motorhome fuel cost was calculated using the average fuel price for gasoline and diesel.
ACCOMMODATION COSTS
As noted in trip configurations, there are three types of accommodations studied in the vacation cost
analysis, campgrounds, hotel/motels and Airbnb rentals. Following is a summary of the methodology and
assumptions regarding accommodations for each of these categories:
• Campgrounds: For the analysis, it was assumed that those travelling by RV would stay in
campgrounds within 25 kilometres of the destination or stopover location. Where available, it
was assumed that the travel party would select a campsite offering a full three service hook-up
or the highest number of hook-ups available. All campgrounds at least offered electrical hook-
up. Additionally, where applicable, costs were based on the travel party composition (two
adults and two children). The nightly cost of campsites was collected directly from the
campground websites and include all additional visitor fees and taxes. Campground prices were
collected in September and November 2020. It should be noted, the prices were generally
consistent from one period to the next.
• Hotels/Motels: For those staying in hotels/motels, it was assumed they would stay in
hotels/motels within 25 kilometres of the destination or stopover location. It was generally
assumed that the hypothetical travel party would stay in recognized brand name mid-level
properties or similar. Nightly rates for a collection of properties were obtained via Hotels.com
in September, October, and November 2020. Other internet booking services were also
checked; however, it was determined that the listings and prices were largely the same across
© 2020 RVDA, CRVA & Go RVing Canada 122020 Family Vacation Cost Comparison
websites. Where applicable, costs were based on the travel party composition (two adults and
two children). Nightly rates include all fees and taxes. It should be noted that hotel prices are
dynamic and can change from day to day. Accordingly, the rates found for this study may not be
available at a later date.
• Airbnb: As with other accommodation types, it was assumed that the travel party would select
Airbnb rentals within 25 kilometres of the destination. It was also assumed that the travel party
would stay in a mid-range property with a full kitchen capable of accommodating four people
comfortably. Nightly rental prices were obtained for a selection of properties through the
Airbnb booking website in September 2020. The rates were verified in November 2020. For
stop over locations, it was assumed the travel party stayed in hotel/motel accommodations as
described above.
For stopover cities, it was assumed that the travel party would drive a maximum of 600 kilometres or
7.5 hours of travel time per day including stops for fuel and refreshment, to avoid fatigue. For trips
exceeding 600 kilometres, stopover cities were selected at logical stopping points along the route that
were between 400 and 600 kilometres from the starting location for the day. Under these assumptions,
all trips analyzed can be driven in a maximum of two days.
Note: The average nightly rate for each of the accommodation categories for each location is presented with the
trip cost summaries later in this report.
FOOD COSTS
The cost of food is a significant contributor to the cost of travel. However, there is a significant
difference in the way people eat depending on whether they are camping, staying in hotels or stay in
Airbnb accommodations. Following is a summary of the different types of food costs and how they
were used in the vacation cost analysis.
Grocery Cost Exhibit 2-1 – Grocery Cost Per Day
The grocery component was calculated using Hypothetical Family Member Grocery Cost
data generated by the U.S. Department of Male - 19 to 50 $16.89
Female - 19 to 50 $14.94
Agriculture (USDA) Center for Nutrition Child 12 to 13 $14.99
Policy and Promotion. Specifically, grocery Child 9 to 12 $14.34
costs are from the USDA’s Official USDA Food Total Family $61.15
Source: USDA Center for Nutrition Policy and Promotion
Plans: Cost of Food at Home at Four Levels, U.S. Note: Converted at average August 2020 Bank of Canada exchange
rate of 1.3222
Average, August 2020. Consistent with previous
studies, the “liberal” plan was selected as the most appropriate for the travel party. Values were
converted to Canadian dollars based on the average exchange rate for August 2020 per the Bank of
Canada. Based on this plan, the daily grocery cost for a family of four is $61.15. The daily grocery costs
for each family member is summarized in Exhibit 2-1.
© 2020 RVDA, CRVA & Go RVing Canada 132020 Family Vacation Cost Comparison
While Statistics Canada also provides data on household food spending, it is limited to the average
annual amount spent per household per year. However, the Statistics Canada data can be used to test
the reasonableness of the USDA grocery data as an approximation for Canadian grocery spending.
Using the average annual household food spend and the average household size from Statistics Canada,
the estimated daily food expenditure in Canada is $14.46 per person, or $57.84 for a family of four
which falls between the moderate and liberal plans from the USDA data. Accordingly, the USDA
grocery data is a good approximation of Canadian grocery spending.
Restaurant Food Cost
The current per diem rates from the Treasury Board of Canada were used to estimate the amount
spent daily to eat in restaurants. As of October 1, 2020, the daily meal allowance rate from the
Treasury Board of Canada was $93.50 per person, or $374 for the hypothetical travel party of four.
Vacation Meal Cost Per Day
The cost of food varies for each vacation configuration as follows:
• RV Trips: Research has shown that campers tend to prepare
their meals at the campground. Accordingly, the analysis
assumes the meals for all RV trips are prepared exclusively in
the RV or at the campground. The daily food cost is based
solely on the grocery cost which is $61.15 per day.
• Hotel Trips: For travel parties staying in hotels, it is assumed
that the majority of their meals are eaten in restaurants.
However, it is acknowledged that travel parties often eat
some meals outside of restaurants such picnics or donuts for
breakfast. The analysis takes this into account by assuming
75% of meals will be eaten in restaurants and 25% outside of
restaurants. Using this ratio, the combined restaurant/grocery
cost for the travel party is estimated at $294.79 per day.
• Airbnb Trips: The analysis assumes that those staying in Airbnb accommodations will generally
purchase groceries and make their meals in the rental unit while in the destination. This is
calculated at the grocery cost of $61.15 per day. While travelling to and from the destination, it
is assumed these travellers will eat in restaurants. This is calculated at the combined
restaurant/grocery cost of $294.79 per day.
Notes:
For air travel, none of the flights in the analysis would be long enough for a meal to be served.
The analysis does not take into account any regional variations in the cost of food.
© 2020 RVDA, CRVA & Go RVing Canada 142020 Family Vacation Cost Comparison
VEHICLE OWNERSHIP COSTS
The analysis includes the cost of vehicle ownership as outlined in the following sections.
PERSONAL VEHICLE OWNERSHIP COSTS
As it is assumed most travel parties would own a vehicle, the cost of personal vehicle ownership
included in the analysis is limited to trip specific wear and tear. The cost of wear and tear is based on
the automobile allowance rates provided by the Treasury Board of Canada. As of October 1, 2020, the
Treasury Board of Canada rate for all personal vehicles was $0.59 per kilometre. This rate includes the
cost of fuel which has already been taken into account elsewhere in the analysis. Removing the average
fuel cost per kilometre based on average fuel consumption and current fuel prices leaves $0.446 per
kilometre in wear and tear.
RV COST OF OWNERSHIP
Following is a summary of the various elements, including data sources, used in calculating the cost of
ownership for RVs:
• New RV Prices: NADA Guides (www.nadaguides.com) provides a searchable database of RVs
of all types that tracks, among other things, the original suggested list price (MSRP) and average
retail price (current value). The price of a new RV is based on the average retail price of a
sample of 2020 model RVs in each category (74 tent camping trailers, 210 travel trailers, 173
class C motorhomes).
• Used RV Prices: Used RVs were assumed to be approximately nine years old. RV prices were
collected for all RV categories for model years 2010 to 2012 from www.autotrader.ca. Prices
were collected for all applicable RVs listed across Canada. The average price for applicable RVs
was used for the average used RV price.
• Length of Ownership: Consistent with previous studies, it was assumed that owners would
keep their RV for seven years. It should be noted that the average cost per day of use generally
decreases with longer ownership periods.
• Residual Values: NADA Guides was used to determine the approximate residual value of RVs.
NADA Guides was used to collect MSRP prices and current selling prices for RVs from 2001 to
2020. This data was used to determine the approximate residual value ratio over time. The
ratios were used to determine the residual value after seven years of ownership for both new
and used RVs.
• Financing Cost: An internet search of RV dealers across the country indicates the current
financing rate for RVs is 5.99%. Specific financing terms are outlined later for each RV type.
© 2020 RVDA, CRVA & Go RVing Canada 152020 Family Vacation Cost Comparison
• Portion Buying New: The portion of buyers purchasing new varies by RV type. Results from
the 2018 RV Market Assessment Study for Go RVing Canada were used to determine the new
vs. used ratio for each RV type. Specific ratios are outlined later for each RV type.
• Average Nights RV is Used: A re-analysis of data from the 2018 RV Market Assessment
Study for Go RVing Canada was used to determine the average number of nights RVers use
their RV per year. The specific averages are outlined later for each RV type.
Cost of Owning a Tent Camping Trailer
For the purpose of the study, it was assumed that the tent camping trailer used by the hypothetical
travel party weighed approximately 2,000 lbs. Key assumptions regarding the tent camping trailer for the
purpose of estimating the cost of ownership:
• Average purchase price is based on a sample of tent camping trailers under 3,000 pounds.
• Financing term is:
o New – financed over 7 years
o Used – financed of 5 years
• 37% buy new, 63% buy used
• Owners use the tent camping trailers for an average of 12.7 nights per year.
Based on these parameters, the cost
Exhibit 2-2 – Cost of Ownership Calculation for Tent Camping Trailers
of owning a tent camping trailer is
approximate $74 per night used. A New Used
summary of the calculation is Average Purchase Price $17,669 $8,489
presented in Exhibit 2-2. Interest Over Ownership Period $4,006 $1,356
Less Residual Value (after 7 years) ($10,099) ($6,263)
In addition to the cost of owning the Total RV Cost $11,576 $3,582
tent camping trailer, owners also Cost Per Year $1,654 $512
must pay for maintenance, insurance, Cost Per Night of Use $131 $40
and storage. According to the 2018 Weighted Average Cost/Day $73.57
RV Market Assessment Study for Go
RVing Canada, owners of tent camping trailers pay an average of approximately $517 per year, or
$40.85 per night of use, for maintenance, insurance, and storage.
© 2020 RVDA, CRVA & Go RVing Canada 162020 Family Vacation Cost Comparison
Cost of Owning a Travel Trailer
For the purposes of the study, it was assumed that the travel trailer used by the hypothetical travel
party weighed approximately 4,000 lbs. Key assumptions regarding the travel trailer for the purpose of
estimating the cost of ownership:
• Average purchase price is based on a sample of travel trailers between 3,000 and 5,500 pounds.
• Financing term is:
o New – financing amortized over 15 years
o Used – financed over 7 years
• 54% buy new, 44% buy used
• Owners use the travel trailers for an average of 21.5 nights per year.
Based on these parameters, the cost
Exhibit 2-3 – Cost of Ownership Calculation for Travel Trailers
of owning a travel trailer is
approximate $79 per night used. A New Used
summary of the calculation is Average Purchase Price $27,657 $14,764
presented in Exhibit 2-3. Interest Over Ownership Period $9,689 $3,347
Less Residual Value (after 7 years) ($23,172) ($8,888)
In addition to the cost of owning the Total RV Cost $14,175 $9,223
travel trailer, owners also must pay Cost Per Year $2,025 $1,318
for maintenance, insurance, and Cost Per Night of Use $94 $61
storage. According to the 2018 RV Weighted Average Cost/Day $79.19
Market Assessment Study for Go
RVing Canada, owners of travel trailers pay an average of approximately $707 per year, or $32.94 per
night of use, for maintenance, insurance, and storage.
© 2020 RVDA, CRVA & Go RVing Canada 172020 Family Vacation Cost Comparison
Cost of Owning a Class C Motorhome
Key assumptions regarding the class C motorhome for the purpose of estimating the cost of ownership:
• Average purchase price is based on a sample of the full range of class C motorhomes except for
a handful of premium models whose MSRP is 60% higher than that the next closest model in the
category.
• Financing term is:
o New – financing amortized over 15 years
o Used – financing amortized over 15 years
• 46% buy new, 54% buy used
• Owners use the class C motorhome for an average of 20.8 nights per year.
Based on these parameters, the cost
Exhibit 2-4 – Cost of Ownership Calculation for Tent Camping Trailers
of owning a class C motorhome is
approximate $366 per night used. A New Used
summary of the calculation is Average Purchase Price $107,729 $60,414
presented in Exhibit 2-4. Interest Over Ownership Period $37,742 $21,165
Less Residual Value (after 7 years) ($79,527) ($38,951)
In addition to the cost of owning the Total RV Cost $65,945 $42,628
tent camping trailer, owners also Cost Per Year $9,421 $6,090
must pay for maintenance, insurance, Cost Per Night of Use $453 $293
and storage. According to the 2018 Weighted Average Cost/Day $365.97
RV Market Assessment Study for Go
RVing Canada, owners of class C motorhomes pay an average of approximately $1,146 per year, or
$55.05 per night of use, for maintenance, insurance, and storage.
© 2020 RVDA, CRVA & Go RVing Canada 182020 Family Vacation Cost Comparison
III. VACATION COST ANALYSIS
This section presents the findings of the vacation cost analysis for each of the five trips. It presents a
summary for each trip that includes a brief overview along with a comparison of the total cost for each
trip configuration followed by a chart that presents the trip parameters along with the detailed cost
breakdown for each trip.
© 2020 RVDA, CRVA & Go RVing Canada 192020 Family Vacation Cost Comparison
TRIP 1 – MONTREAL (QC) TO ALGONQUIN PROVINCIAL PARK
Trip 1 is a short 3-day vacation from
Exhibit 3-1 – Vacation Cost Summary - Montreal to Algonquin
Montreal to Algonquin Provincial Park. Provincial Park – 3 Days
With a one-way distance of 472 KM, most
travellers would make this drive in a single
day. The closest commercial airport is in
North Bay, 131 KM away. Tent Camping Trailer $1,272
For those staying in hotels, most would
stay in the town of Huntsville just outside
Travel Trailer $1,331
the park’s west gate. Campgrounds can be
found both in the park and in the
surrounding area.
Class C Motorhome $1,518
Among the six travel configurations tested,
the lowest cost is for tent camping trailers
and travel trailers at approximately $1,300
(see Exhibit 3-1). For the hypothetical Personal Car/Hotel $2,025
travel party these trip configurations are
approximately 13% lower than driving and
staying in Airbnbs, 35% lower than driving
and staying in hotels and 70% lower than Personal Car/AirBnB $1,498
flying and staying in hotels.
At just over $1,500, the class C
Fly/Hotel $4,321
motorhome configuration cost is on par
with driving and staying in Airbnbs and 25%
lower than driving and staying in hotels and $0 $1,500 $3,000 $4,500 $6,000
65% lower than flying and staying in hotels.
Trip parameters and vacation costs by trip configuration are summarized for the Montreal to Algonquin
Provincial Park trip in Exhibit 3-2. For details on key assumptions and calculations, please refer to the
section titled “II. Study Parameters and Methodology”.
© 2020 RVDA, CRVA & Go RVing Canada 202020 Family Vacation Cost Comparison
Exhibit 3-2 – Trip 1 Parameters – Montreal to Algonquin Provincial Park
Origin Montreal (QC)
Destination Algonquin Provincial Park
(ON)
Days 3 Source: www.mapquest.ca
Driving Distance (KM) Accommodation Rates Per Night
Round Trip Distance 944 Destination Stopover
Activity/Sightseeing Distance 225 Hotel $229 N/A
Round Trip Airport Distance 262 Campsite $61 N/A
Fuel Prices Per Litre Airbnb $200 N/A
Gasoline $1.12 Destination Airport
Diesel $1.15 North Bay (ON – YYB)
Vacation Cost
Tent Class C Personal Personal
Travel Air
Camping Motor- Car/ Car/
Trailer Travel
Trailer home Hotel Airbnb
Transportation
Airfare N/A N/A N/A N/A N/A $2,743
Rental Car N/A N/A N/A N/A N/A $182
Fuel $216 $279 $370 $158 $158 $50
Personal vehicle wear & tear $521 $521 N/A $521 $521 N/A
Accommodation
Hotels N/A N/A N/A $458 N/A $458
Campsites $123 $123 $123 N/A N/A N/A
Airbnb N/A N/A N/A N/A $401 N/A
Food
Meals $183 $183 $183 $887 $418 $887
Cost of RV Ownership
Vehicle Cost $147 $158 $732 N/A N/A N/A
Maintenance/Insurance/
$82 $66 $110 N/A N/A N/A
Storage
Total Cost $1,272 $1,331 $1,518 $2,025 $1,498 $4,321
Cost per Day $424 $444 $506 $675 $499 $1,440
© 2020 RVDA, CRVA & Go RVing Canada 212020 Family Vacation Cost Comparison
TRIP 2 – HALIFAX (NS) TO QUEBEC CITY (QC)
Trip 2 is a lengthy 10-day vacation from
Exhibit 3-3 – Vacation Cost Summary - Halifax to Quebec City – 10
Halifax to Quebec City. With a one-way Days
distance of 1,027 KM, for the purpose of
this study, it is assumed that travellers
would make this drive over two days with a
stopover in Fredericton. For those flying, Tent Camping Trailer $3,918
the closest commercial airport is in
Quebec City itself, 20 KM away from city
centre.
Travel Trailer $4,033
For those staying in hotels, most would
stay in the city itself. Campgrounds can be
found in the surrounding area. Class C Motorhome $5,812
Among the six travel configurations tested,
the lowest cost is for tent camping trailers
and travel trailers at approximately $4,000 Personal Car/Hotel $6,670
(see Exhibit 3-3). For the hypothetical
travel party these trip configurations are
approximately 8% lower than driving and
staying in Airbnbs, 40% lower than driving Personal Car/AirBnB $4,344
and staying in hotels and 55% lower than
flying and staying in hotels.
Fly/Hotel $8,971
At just over $5,800, the class C
motorhome configuration cost is 25%
higher than driving and staying in Airbnbs, $0 $3,000 $6,000 $9,000 $12,000
but 13% lower than driving and staying in
hotels and 35% lower than flying and staying in hotels.
Trip parameters and vacation costs by trip configuration are summarized for the Halifax to Quebec City
trip in Exhibit 3-4. For details on key assumptions and calculations, please refer to the section titled “II.
Study Parameters and Methodology”.
© 2020 RVDA, CRVA & Go RVing Canada 222020 Family Vacation Cost Comparison
Exhibit 3-4 – Trip 2 Parameters – Halifax to Quebec City
Origin Halifax (NS)
Destination Quebec City (QC)
Stopover Fredericton (NB)
Days 10 Source: www.mapquest.ca
Driving Distance (KM) Accommodation Rates Per Night
Round Trip Distance 2,054 Destination Stopover
Activity/Sightseeing Distance 750 Hotel $247 $183
Round Trip Airport Distance 40 Campsite $62 $53
Fuel Prices Per Litre Airbnb $149 N/A
Gasoline $1.09 Destination Airport
Diesel $1.15 Quebec City (QC – YQB)
Vacation Cost
Tent Class C Personal Personal
Travel Air
Camping Motor- Car/ Car/
Trailer Travel
Trailer home Hotel Airbnb
Transportation
Airfare N/A N/A N/A N/A N/A $2,741
Rental Car N/A N/A N/A N/A N/A $972
Fuel $490 $626 $875 $367 $367 $78
Personal vehicle wear & tear $1,251 $1,251 N/A $1,251 $1,251 N/A
Accommodation
Hotels N/A N/A N/A $2,095 $367 $2,222
Campsites $536 $536 $536 N/A N/A N/A
Airbnb N/A N/A N/A N/A $1,044 N/A
Food
Meals $612 $612 $612 $2,958 $1,315 $2,958
Cost of RV Ownership
Vehicle Cost $662 $713 $3,294 N/A N/A N/A
Maintenance/Insurance/
$368 $296 $495 N/A N/A N/A
Storage
Total Cost $3,918 $4,033 $5,812 $6,670 $4,344 $8,971
Cost per Day $392 $403 $581 $667 $434 $897
© 2020 RVDA, CRVA & Go RVing Canada 232020 Family Vacation Cost Comparison
TRIP 3 – TORONTO (ON) TO STURGEON FALLS (ON)
Trip 3 is a short 3-day vacation from
Exhibit 3-5 – Vacation Cost Summary - Toronto to Sturgeon Falls
Toronto to Sturgeon Falls. With a one-way – 3 Days
distance of 382 KM, most travellers would
make this drive in a single day. The closest
commercial airport is in North Bay.
However, at the time of the study, flights Tent Camping Trailer $1,142
were not offered from Toronto to North
Bay. The next closest airport is Sudbury at
88 KM away.
Travel Trailer $1,188
For those staying in hotels, there are
limited options in Sturgeon Falls.
Accordingly, some may stay in North Bay Class C Motorhome $1,442
(39 KM away). Campgrounds can be found
at nearby Lake Nipissing.
Among the six travel configurations tested, Personal Car/Hotel $1,740
the lowest cost is for tent camping trailers
and travel trailers at approximately $1,150
(see Exhibit 3-5). For the hypothetical
travel party these trip configurations are Personal Car/AirBnB $1,477
approximately 21% lower than driving and
staying in Airbnbs, 33% lower than driving
and staying in hotels and 56% lower than
Fly/Hotel $2,668
flying and staying in hotels.
At just over $1,400, the class C $0 $1,000 $2,000 $3,000
motorhome configuration cost is on par
with driving and staying in Airbnbs and 17% lower than driving and staying in hotels and 46% lower than
flying and staying in hotels.
Trip parameters and vacation costs by trip configuration are summarized for the Toronto to Sturgeon
Falls trip in Exhibit 3-6. For details on key assumptions and calculations, please refer to the section
titled “II. Study Parameters and Methodology”.
© 2020 RVDA, CRVA & Go RVing Canada 242020 Family Vacation Cost Comparison
Exhibit 3-6 – Trip 3 Parameters – Toronto to Sturgeon Falls
Origin Toronto (ON)
Destination Sturgeon Falls (ON)
Stopover N/A
Days 3 Source: www.mapquest.ca
Driving Distance (KM) Accommodation Rates Per Night
Round Trip Distance 764 Destination Stopover
Activity/Sightseeing Distance 225 Hotel $141 N/A
Round Trip Airport Distance 176 Campsite $56 N/A
Fuel Prices Per Litre Airbnb $243 N/A
Gasoline $1.10 Destination Airport
Diesel $1.11 Sudbury (ON – YSB)
Vacation Cost
Tent Class C Personal Personal
Travel Air
Camping Motor- Car/ Car/
Trailer Travel
Trailer home Hotel Airbnb
Transportation
Airfare N/A N/A N/A N/A N/A $1,257
Rental Car N/A N/A N/A N/A N/A $203
Fuel $177 $227 $305 $131 $131 $40
Personal vehicle wear & tear $441 $441 N/A $441 $441 N/A
Accommodation
Hotels N/A N/A N/A $281 $0 $281
Campsites $111 $111 $111 N/A N/A N/A
Airbnb N/A N/A N/A N/A $487 N/A
Food
Meals $183 $183 $183 $887 $418 $887
Cost of RV Ownership
Vehicle Cost $147 $158 $732 N/A N/A N/A
Maintenance/Insurance/
$82 $66 $110 N/A N/A N/A
Storage
Total Cost $1,142 $1,188 $1,442 $1,740 $1,477 $2,668
Cost per Day $381 $396 $481 $580 $492 $889
© 2020 RVDA, CRVA & Go RVing Canada 252020 Family Vacation Cost Comparison
TRIP 4 – BRANDON (MB) TO DRUMHELLER (AB)
Trip 4 is a length 10-day vacation from
Exhibit 3-7 – Vacation Cost Summary - Brandon to Drumheller –
Brandon to Drumheller. With a one-way 10 Days
distance of 1,077 KM, for the purpose of
this study, it is assumed that travellers
would make this drive over two days with a
stopover in Moose Jaw Saskatchewan. The Tent Camping Trailer $3,864
closest commercial airport is in Calgary,
120 KM away. Those flying could fly from
Brandon, though some may opt to fly from
Travel Trailer $3,979
Winnipeg (213 KM) given the limited flight
option from Brandon.
For those staying in hotels, there are plenty Class C Motorhome $5,710
of options in the town of Drumheller.
There are also many campground options
scattered throughout the area.
Personal Car/Hotel $6,045
Among the six travel configurations tested,
the lowest cost is for tent camping trailers
and travel trailers at approximately $3,900
(see Exhibit 3-7). For the hypothetical Personal Car/AirBnB $4,400
travel party these trip configurations are
approximately 11% lower than driving and
staying in Airbnbs, 35% lower than driving
Fly/Hotel $7,662
and staying in hotels and 49% lower than
flying and staying in hotels.
$0 $3,000 $6,000 $9,000
At just over $5,700, the class C
motorhome configuration cost is 30% more than driving and staying in Airbnbs, 6% lower than driving
and staying in hotels and 25% lower than flying and staying in hotels.
Trip parameters and vacation costs by trip configuration are summarized for the Brandon to Drumheller
trip in Exhibit 3-8. For details on key assumptions and calculations, please refer to the section titled “II.
Study Parameters and Methodology”.
© 2020 RVDA, CRVA & Go RVing Canada 262020 Family Vacation Cost Comparison
Exhibit 3-8 – Trip 4 Parameters – Brandon to Drumheller
Origin Brandon (MB)
Destination Drumheller (AB)
Stopover N/A
Days 10 Source: www.mapquest.ca
Driving Distance (KM) Accommodation Rates Per Night
Round Trip Distance 2,154 Destination Stopover
Activity/Sightseeing Distance 750 Hotel $166 $132
Round Trip Airport Distance 240 Campsite $50 $47
Fuel Prices Per Litre Airbnb $166 N/A
Gasoline $1.04 Destination Airport
Diesel $1.11 Calgary (AB – YYC)
Vacation Cost
Tent Class C Personal Personal
Travel Air
Camping Motor- Car/ Car/
Trailer Travel
Trailer home Hotel Airbnb
Transportation
Airfare N/A N/A N/A N/A N/A $2,234
Rental Car N/A N/A N/A N/A N/A $878
Fuel $486 $622 $868 $363 $363 $94
Personal vehicle wear & tear $1,295 $1,295 N/A $1,295 $1,295 N/A
Accommodation
Hotels N/A N/A N/A $1,429 $264 $1,497
Campsites $441 $441 $441 N/A N/A N/A
Airbnb N/A N/A N/A N/A $1,162 N/A
Food
Meals $612 $612 $612 $2,958 $1,315 $2,958
Cost of RV Ownership
Vehicle Cost $662 $713 $3,294 N/A N/A N/A
Maintenance/Insurance/
$368 $296 $495 N/A N/A N/A
Storage
Total Cost $3,864 $3,979 $5,710 $6,045 $4,400 $7,662
Cost per Day $386 $398 $571 $605 $440 $766
© 2020 RVDA, CRVA & Go RVing Canada 272020 Family Vacation Cost Comparison
TRIP 5 – VANCOUVER (BC) TO BANFF NATIONAL PARK (AB)
Trip 5 is a weeklong (7 days) vacation from
Exhibit 3-9 – Vacation Cost Summary - Vancouver to Banff
Vancouver to Banff National Park. With a National Park – 7 Days
one-way distance of 851 KM, for the
purpose of this study, it is assumed that
travellers would make this drive over two
days with a stopover in Kamloops British Tent Camping Trailer $2,777
Columbia. The closest commercial airport
is in Calgary, 143 KM away.
Travel Trailer $2,887
For those staying in hotels, most would
stay in the town of Banff. Campgrounds can
be found both in the park and in the
surrounding area. Class C Motorhome $3,930
Among the six travel configurations tested,
the lowest cost is for tent camping trailers
and travel trailers at approximately $2,840 Personal Car/Hotel $4,947
(see Exhibit 3-9). For the hypothetical
travel party these trip configurations are
approximately 25% lower than driving and
staying in Airbnbs, 41% lower than driving Personal Car/AirBnB $3,794
and staying in hotels and 53% lower than
flying and staying in hotels.
Fly/Hotel $6,076
At just over $3,900, the class C
motorhome configuration cost is about 4%
higher than driving and staying in Airbnbs $0 $2,000 $4,000 $6,000 $8,000
and 21% lower than driving and staying in
hotels and 35% lower than flying and staying in hotels.
Trip parameters and vacation costs by trip configuration are summarized for the Vancouver to Banff
National Park trip in Exhibit 3-10. For details on key assumptions and calculations, please refer to the
section titled “II. Study Parameters and Methodology”.
© 2020 RVDA, CRVA & Go RVing Canada 28You can also read