2019 POINT-IN-TIME COUNT - Northeast Florida 05.08.2019 - Changing Homelessness
←
→
Page content transcription
If your browser does not render page correctly, please read the page content below

2019
POINT-IN-TIME COUNT
Northeast Florida
05.08.2019

TABLE OF CONTENTS
Executive Summary........................................................................................................................................... 3

Point-In-Time Count in Northeast Florida...................................................................................................5

Sheltered and Unsheltered.............................................................................................................................. 7

Subpopulations. ..................................................................................................................................................9

   Experiencing Chronic Homelessness........................................................................................................9

   Veterans.......................................................................................................................................................... 10

   Youth/Young Adults..................................................................................................................................... 11

   Families with Children. ................................................................................................................................ 12

All Other Persons Experiencing Homelessness....................................................................................... 12
Conclusion.......................................................................................................................................................... 13

Appendix A – Ten Year Trends. ..................................................................................................................... 14

Appendix B – Governance and Membership.. ........................................................................................... 16

   Northeast Florida Continuum of Care Governance Board................................................................ 16

   Changing Homelessness Board of Directors........................................................................................ 16

   Northeast Florida Continuum of Care Member Agencies. . ............................................................... 16

                                                                                                                                                                           2
PIT COUNT REPORT 04.30.2019                                                                                CHANGING HOMELESSNESS

  EXECUTIVE SUMMARY
  On Wednesday, January 23, 2019, the Northeast Florida          Similarly, the number of sheltered persons has
  Continuum of Care (CoC) joined together with our               decreased by 43%:
  stakeholders throughout the community to conduct the
  annual Point-In-Time Count (PIT). It is named a Point-
                                                                           TOTAL NUMBER OF SHELTERED
  In-Time Count because it offers a snapshot of who was
                                                                               PERSONS COUNTED
  homeless on that one day – a point-in-time. Like reporting
  the weather on just one day out of an entire year, the PIT                   2009 — 2,019           2019 — 1,146
  Count offers a limited portrayal of a dynamic condition.
  This year’s PIT report includes 10-year trends, highlighting   2,500
  the positive changes we have experienced. It also includes
  additional information to develop a more comprehensive         2,000
  understanding of how homelessness is changing in                                   2,019
  Northeast Florida. Data in this report demonstrate how
                                                                  1,500
  long-term investments and commitment to policy changes
  result in lasting community improvements.
                                                                  1,000                            1,146
  The total number of persons experiencing homelessness
  in Northeast Florida has decreased by 32% over the past           500
  10 years:
                                                                       0
      TOTAL NUMBER OF PERSONS COUNTED
                    2009 — 2,442       2019 — 1,654              But we’re cautiously optimistic. Of note this year is an
                                                                 18% increase in unsheltered over 2018. This year’s PIT
   3,000                                                         Count found 79 more persons sleeping on the streets
                                                                 or other places not meant for human habitation.
   2,500
                          2,442                                  The 10-year trend for unsheltered appears stable.
   2,000
                                                                       TOTAL NUMBER OF UNSHELTERED
    1,500
                                                                             PERSONS COUNTED
                                   1654
                                                                               2009 — 423             2019 — 508
   1,000
                                                                   600
      500
                                                                   500
                                                                                                   508
          0
                                                                   400               423
                                                                   300

                                                                   200

                                                                    100

                                                                       0

                                                                                                                              3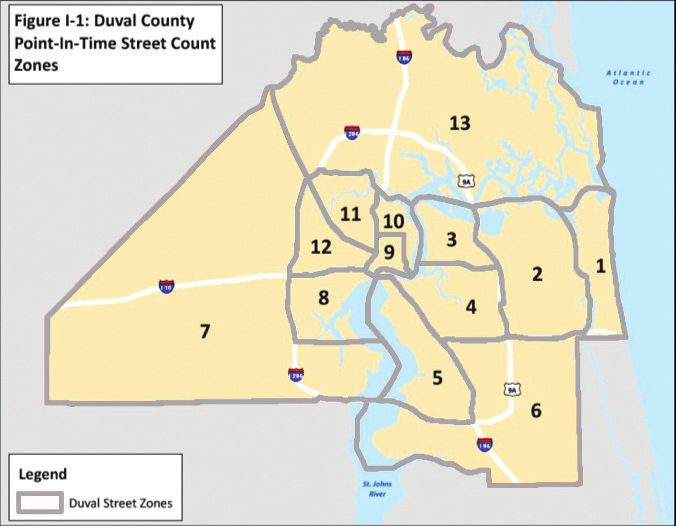
PIT COUNT REPORT 04.30.2019                                                                          CHANGING HOMELESSNESS

  EXECUTIVE SUMMARY
  PIT Count trend shows success in assisting two             Finally, the number of veterans experiencing
  subpopulations. First, a steady drop in the number of      homelessness has dropped significantly:
  persons experiencing chronic homelessness emerges.
  This represents a positive trend for individuals who are
  often difficult to engage with and assist.

                      TOTAL NUMBER OF                                         TOTAL NUMBER OF
                      CHRONIC PERSONS                                         VETERAN PERSONS
                   2009 — 756            2019 — 301                         2009 — 647           2019 — 118

      800
                              756
      700                                                        700

     600                                                         600              647

      500                                                        500

     400                                                         400

      300                                                        300
                                     301
      200                                                        200

      100                                                        100                           118

          0                                                         0

                60%           DECREASE
                                                                          82%      DECREASE

                                               THE BOTTOM LINE:
                                       NORTHEAST FLORIDA
                                         STAKEHOLDERS
                                     ARE WORKING TOGETHER
                                    TO REDUCE HOMELESSNESS.

                                                                                                                        4
PIT COUNT REPORT 04.30.2019                                                                         CHANGING HOMELESSNESS

  POINT-IN-TIME COUNT
  IN NORTHEAST FLORIDA
  In 1974, a group of social service agencies and faith        agreement. CoCs operate throughout the U.S. and since
  leaders formed the Emergency Services and Homeless           the early 1990s conducted Point-In-Time (PIT) Counts.
  Coalition to coordinate efforts at ending homelessness.
  Twenty-seven years later, in 2001, the Emergency             This report is based on information pulled from
  Services and Homeless Coalition was designated by U.S.       over 40 regional social service agencies offering
  Housing and Urban Development (HUD) as the planner           overnight emergency beds, transitional housing, and
  and coordinator of the HUD-funded Continuum of Care          supportive services. It also relies on results of a one-
  projects dedicated to ending homelessness in Duval,          day, volunteer-driven survey of people living in woods,
  Clay, and Nassau counties. At that point, the organization   streets, and cars—places not fit for human habitation.
  became a nonprofit organization, and fifteen years later,
  the agency became Changing Homelessness.                     Figure 1 shows that more than twice the number of
                                                               people experiencing homelessness had some kind of
  Changing Homelessness coordinates data collection and        shelter as compared to those who were unsheltered.
  service provision within HUD’s Continuum of Care (CoC)

   FIGURE 1

                              SHELTERED              UNSHELTERED
                                                                                     TOTAL

                        1,146                           508                      1,654
  Working in teams, 140 volunteers collected survey data from unsheltered people for the 2019 Point-In-Time
  Count. Different areas were canvassed at different times, with volunteers asking each respondent whether
  they had completed a survey already. Every effort was made to ensure individuals were counted once. Areas
  canvassed were selected based on local knowledge of concentrations of unsheltered people. Figures 2, 3, and
  4 show the number of sheltered and unsheltered documented in each county.

  FIGURE 2
  Clay County

                                             67                           SHELTERED
                                                                          UNSHELTERED
                                              7
                                       TOTAL 74

                                                                                                                       5
PIT COUNT REPORT 04.30.2019                                               CHANGING HOMELESSNESS

  POINT-IN-TIME COUNT
  IN NORTHEAST FLORIDA
  FIGURE 3
  Duval County

                              SHELTERED
                              UNSHELTERED

                                                    1,011
                                                      483
                                            TOTAL   1,494

  FIGURE 4
  Nassau County

                                                68
                                                18
                                       TOTAL    86

                                                            SHELTERED
                                                            UNSHELTERED

                                                                                             6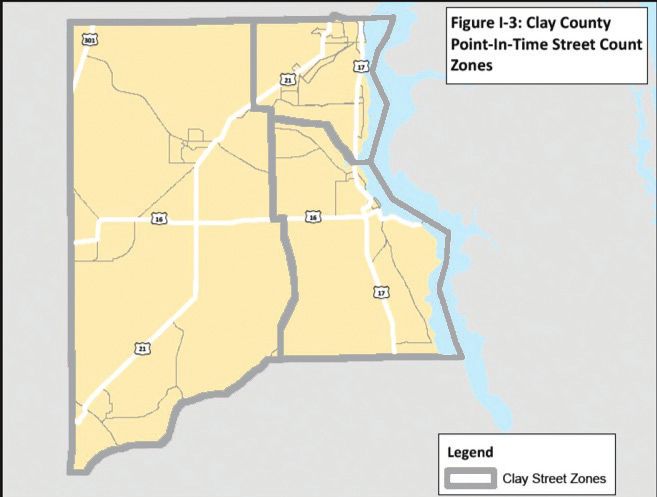
PIT COUNT REPORT 04.30.2019                                                                        CHANGING HOMELESSNESS

  SHELTERED AND
  UNSHELTERED
  Homelessness destabilizes the lives of our neighbors.        The family might gain some of the above in an
  Be it job loss, divorce, death, illness, family rejection,   emergency shelter or transitional housing, however,
  violence, and other crises, there are many ways one          more permanent accommodations provide dignity
  could experience homelessness, or be at-risk of it,          quickly—making it possible for a mom and her children
  and some people are simply a paycheck away from it.          to bounce back.
  Consider, for example, a mother escaping domestic
  violence. When she and her children leave, they also         Northeast Florida’s providers of emergency shelter
  lose privacy and their place to:                             and transitional beds are improving their services
                                                               and offering people more dignity and permanency.
  •    feel safe                                               Examples of these changes include:
  •    sleep                                                   • Salvation Army’s renovation of their family rooms;
  •    cook                                                       and
  •    store clothes                                           • Sulzbacher Village offering private accommodations
  •    bathe; and                                                 for women and children.
  •    a place to live - their address
                                                               This shift means fewer beds in emergency shelters
                                                               (e.g., bunk beds in congregate sleeping areas).
                                                               Figure 5 shows this shift.

  FIGURE 5
                              EMERGENCY SHELTER AND TRANSITIONAL
                                   BEDS, PIT COUNTS 2018-2019
      BEDS                                   2018                        2019                  DIFFERENCE
      Emergency Shelter                      1,015                       848                         -167
      Transitional Housing                   549                         540                          -9
      TOTALS                                1,564                        1,388                       -176

  Because of this shift in services, the number of unsheltered persons also decreased from 2018 to 2019.
  Figure 6 shows the decrease in the number of sheltered persons.

  FIGURE 6
                                  INDIVIDUALS EXPERIENCING
                              HOMELESSNESS, PIT COUNTS 2018-2019
      INDIVIDUALS                            2018                        2019                  DIFFERENCE
      Emergency Shelter                       878                         707                        -171
      Transitional Housing                   487                         439                         -48
      TOTALS                                1,365                        1,146                       -219

                                                                                                                       7
PIT COUNT REPORT 04.30.2019                                                                   CHANGING HOMELESSNESS

  SHELTERED AND
  UNSHELTERED
  Figure 7 shows how the total number of persons experiencing homelessness dropped. It dropped because the
  number of sheltered persons dropped—a consequence of fewer available beds. At the same time, the number
  of unsheltered persons increased.

  FIGURE 7
                        SHELTERED AND UNSHELTERED, PIT COUNTS
                                      2018-2019
    PERSONS                             2018                        2019                  DIFFERENCE
    Sheltered                           1,365                       1,146                       -219
    Unsheltered                          429                         508                        +79
    TOTALS                              1,794                       1,654                       -140

  The increase in unsheltered persons could have been higher given the decrease in emergency capacity—167
  fewer beds. Northeast Florida service providers are carefully managing a well-defined mix of emergency and
  permanent accommodations in a coordinated effort to assist people in the most effective ways.

  “If I didn’t get comfortable with what
   was happening, I’d be okay.”
     Changing Homelessness interviewed people for this report. Their names have been changed.

     Bill was convicted of arson and served 8 years in prison. When he was released, he could not
     make enough money to rent an apartment, and his criminal record prevented him from entering
     many housing assistance programs. He is not unlike many of the 650,000 ex-offenders released
     from U.S. prisons every year. (https://www.justice.gov/archive/fbci/progmenu_reentry.html)

     He did not stay in shelters; he did not want to become comfortable with the experience of
     being homeless. He felt that if he got comfortable with living on the streets, he wouldn’t ever
     leave them.

     Instead, he slept in Klutho Park, taking sponge baths in the fountain. He rode a bus out to St.
     Johns Town Center where he worked on a crew building a WaWa convenience store. However,
     that job ended once the convenience store opened for business. At the end of 2017, two days
     before Christmas, Bill was beaten up badly when he chose a different place— not Klutho Park—
     to sleep. His friend, a priest, saw his injuries and asked him if he wanted to work for a day at a
     church. By this time, Bill had participated in the church for many years. Currently, he maintains
     the church grounds and buildings, has an income and health benefits.

     Reflecting back on the main contributors to his success, he thinks that his support system
     made the biggest difference. The key to bouncing back was his ability to rely on others. He
     says,“My best thinking got me in trouble over and over. Seeing others do good at church,
     feeling them accept me as I am—all of this meant I could do good, too. I wanted to do what
     they do.”
                                                                                                                 8
PIT COUNT REPORT 04.30.2019                                                                               CHANGING HOMELESSNESS

  SUBPOPULATIONS
  Changing Homelessness reports on people who are experiencing homelessness by identifying subpopulations:
  • Chronic homelessness: Individuals who have a documented disabling condition and have been continuously
     homeless for one year or more, or 4+ times within 3 years, totaling 12 months. These are the most vulnerable
     people experiencing homelessness.
  • Veterans: Individuals whose status is verified by the Veterans Administration.
  • Families with children: At least one adult with one or more children.
  • Young Adults: Unaccompanied individuals 18-24 years old who lack a fixed, regular, nighttime residence
     or whose primary nighttime residence is a public shelter or temporary shelter.

  EXPERIENCING CHRONIC HOMELESSNESS
  The 2018 PIT Count found 327 chronically homeless and in 2019 that number decreased to 301.
  Figure 8 shows the 10-year decrease in the number of people identified as experiencing chronic homelessness.

 FIGURE 8
                               PERSONS EXPERIENCING CHRONIC
                               HOMELESSNESS, NEFL PIT COUNTS
                              2009   2010     2011     2012      2013     2014     2015      2016     2017      2018    2019
        Chronic
      Homelessness
                               756   998      1,104     363       276      399       327      325       319      327      301

  Many people who experience chronic homelessness become what are called High-utilizers of emergency services. They
  land in emergency rooms or are booked into jail when they are picked up by law enforcement or emergency medical
  services. Ability Housing, a regional provider of permanent supportive housing, recognized this fact and commissioned
  a study of local High-utilizers.

  The study demonstrated the public costs of failing to stabilize lives. The Solution that Saves report tracked 68 High-
  utilizers of public services such as jails and calculated the number of jail bookings incurred by the 68 people during a
  2-year period when they experienced housing instability. They experienced 84 arrests. In the two years after they entered
  a permanent supportive housing program, the same group experienced 29 arrests. This reduction saved approximately
  $50,000 in jail services alone (www.abilityhousing.org)

  Besides jail costs, High-utilizers also frequently live with trauma-related disorders and seek community mental health
  services. When the U.S. Agency for Healthcare Research and Quality looked at expenditures for mental disorders, they
  found that treatment of mental disorders is one of the top five most costly conditions among the overall U.S. population.
  The Solution that Saves calculated the total costs of hospital and jail services before and after persons moved into
  permanent supportive housing. The savings to the Northeast Florida community is estimated to be 30% in tax-dollar
  funded services. This research, as well as advocacy efforts by Ability Housing and other agencies, establishes the fact
  that permanent supportive housing benefits everyone in Northeast Florida.

                                                                                                                              9
PIT COUNT REPORT 04.30.2019 CHANGING HOMELESSNESS
VETERANS
The 2018 PIT Count found 121 veterans experiencing homelessness and in 2019 that number decreased to 118.
Figure 9 shows the 10-year decrease in the number of veterans experiencing homelessness.
FIGURE 9
VETERANS EXPERIENCING HOMELESSNESS,
NEFL PIT COUNTS
2009 2010 2011 2012 2013 2014 2015 2016 2017 2018 2019
Homeless
Veterans 647 513 345 292 324 224 184 130 125 121 118
In 2017, HUD looked at CoCs across the nation and found that Clay, Duval, and Nassau counties have the 5th
largest number of veterans amongst all other CoCs. Twenty-five percent of the Northeast Florida population is
active or veteran military. HUD also reported our region ranked 39th for the number of homeless veterans. (2017
AHAR) In other words, we are home to thousands of veterans and when they struggle, our community takes
steps to make sure they stabilize through family, friends and supports. Figure 9 shows the success in reducing
veteran homelessness already achieved.
Northeast Florida reduced homelessness amongst veterans because appropriate resources and tools were
engaged during the last 10 years. While there is more work to do to assist our veterans, similar resources can
be applied to others experiencing homelessness.
10PIT COUNT REPORT 04.30.2019 CHANGING HOMELESSNESS
YOUTH/YOUNG ADULTS
The 2018 PIT Count found 132 young adults ages 18-24 experiencing homelessness and in 2019 that number
decreased to 109.
Tracking homelessness amongst youth/young adults started in 2013. Figure 10 shows decreases until 2018
when the total number (sheltered and unsheltered) increased 25% from 2017 to then decrease by 21% from
2018 to 2019.
FIGURE 10
YOUNG ADULTS EXPERIENCING
HOMELESSNESS, NEFL PIT COUNTS
2009 2010 2011 2012 2013 2014 2015 2016 2017 2018 2019
Homeless
Youth/Young
Adults NA NA NA NA 153 120 101 109 106 132 109
Many advocates point out that the prevalence of homelessness amongst young adults is higher than Point-In-
Time counts suggest as demonstrated in the vacillating numbers. It is not uncommon for youth/young adults
to share space with someone – commonly known as couch-surfing. While “Couch-surfing” does not meet
HUD definitions of homelessness, a national research initiative conducted a survey that does include this
common youth/young adult practice. And that survey found that 1 in 10 young adults’ ages 18-25 years are
experiencing “some form” of homelessness in a 12-month period (Voices of Youth Count, National Estimates).
According to the U.S. Census, there is a national demographic change involving young adults putting off
marriage and independent living (“Changing Economics” 2017). A larger portion of young adults prefer to live
in their parents’ home longer. Against this demographic backdrop, the growth of young adult homelessness is
not surprising. For some pregnant young women, lesbian, gay, bisexual and transgender persons, and young
adults aging out of foster care, living with parents might not be possible.
“Drugs Can Take Over Your Life.”
Changing Homelessness interviewed people for this report. Their names have been changed.
When John was 17, he started hanging around with people who sold drugs. He and his friends
sold drugs in his Dad’s home and then his Mom’s. John’s Dad kicked him out of the house
because he was using and selling. The problem didn’t go away, and he and his mother were
evicted from where they were staying.
John was never arrested—although he had run-ins with police. After being evicted, he asked to
stay with his grandmother, and she refused. From September 2018 to January 2019, he slept at
City Rescue Mission. Then he went back to high school.
A social worker at John’s school realized he was homeless. She connected him to daniel, and
now he lives at Youth Crisis Center’s Touchstone Village. He graduates from high school this
month and is starting to apply for jobs.
9
11PIT COUNT REPORT 04.30.2019 CHANGING HOMELESSNESS
FAMILIES WITH CHILDREN
The 2018 PIT Count found 384 persons in families with children experiencing homelessness and in 2019 that
number decreased to 289.
FIGURE 11
PERSONS IN FAMILIES WITH CHILDREN
EXPERIENCING HOMELESSNESS, NEFL PIT COUNTS
2009 2010 2011 2012 2013 2014 2015 2016 2017 2018 2019
Persons in
families w/
children 540 896 648 567 830 674 513 493 425 384 289
Families with children experiencing homelessness are, in some cases, not able to leave homelessness behind;
the children experience it again as young adults. National estimates from the Voices of Youth Count found
that “the majority of young adults…interviewed had experiences of homelessness or housing instability that
started in childhood or adolescence” (www.voicesofyouthcount.org). Prevention of homelessness amongst
families can prevent homelessness amongst youth later in life.
ALL OTHER PERSONS
EXPERIENCING HOMELESSNESS
Figures 12 and 13 show the percentages of the four subpopulations in comparison to all others experiencing
homelessness. The pie charts compare PIT counts in 2009 against 2019, 10 years later.
FIGURE 12 FIGURE 13
2009 2019
All other
people Chronic
experiencing 19%
homelessness Chronic
20% 31%
All other Veterans
people 7%
Families experiencing
with homelessness Families with
Children 56% Children
22% 18%
Veterans
27%
Figures 12 and 13 suggest that compared to 10 years ago:
• The most vulnerable persons, our chronically homeless, are a smaller portion of the total population of
people experiencing homelessness.
• Families with children make up a smaller portion of the total population.
• The all other people, which represents individuals, accounts for more than ½ the total population.
• The percent who are veterans has decreased.
12PIT COUNT REPORT 04.30.2019 CHANGING HOMELESSNESS
CONCLUSION
Northeast Florida’s coordinated efforts to reduce homelessness are working. This year’s PIT Count, when placed
within a 10-year trend, shows that most measures of homelessness are improving, and that some measures are
improving significantly. These data demonstrate Northeast Florida’s commitment to reducing homelessness.
Investments in reducing homelessness result in quantifiable improvements—for individuals, families, and
neighborhoods throughout the region.
“It dawned on me she might not have
been willing to admit to herself she
was homeless.”
The PIT Count is an extraordinary volunteer opportunity. For many who have not experienced homelessness, stereotypes
and myths about it are reinforced by the fact that we rarely meet a person experiencing homelessness. A volunteer for the
2019 PIT Count observed that even people sleeping on the street struggle against the stigma of homelessness. The volunteer
describes an encounter below:
The next member of this group was a well-dressed lady in a leather jacket with
a nice-looking leather purse. As I crouched down to talk to the well-dressed
lady, her neighbor on the sidewalk interjected that the well-dressed lady was
not really homeless. The well-dressed lady affirmed this and said she was just
out there to get the experience so she could design programs to help the
homeless. I mostly believed this in light of her clothes and purse, but I thought
I would go through the questionnaire anyway. It turns out she had been on the
street for months, and this was not her first time. It dawned on me she might
not have been willing to admit to herself she was homeless.
13PIT COUNT REPORT 04.30.2019 CHANGING HOMELESSNESS
APPENDIX A:
TEN YEAR TRENDS
YEAR OVER YEAR POINT-IN-TIME TOTALS
3500
3000
2500
2000
1500
1000
500
0
2009 2010 2011 2012 2013 2014 2015 2016 2017 2018 2019
Total 2442 3241 3025 2861 2768 2049 1853 1959 1869 1794 1654
Chronic 756 998 1104 363 276 399 327 325 319 327 301
Veterans 647 513 345 292 324 224 184 130 125 121 118
Families (with
child) Households
150 237 220 202 232 242 170 164 135 126 90
Families (with
child) # of people
540 896 648 567 830 674 513 493 425 384 289
Youth 153 120 101 109 106 132 109
14PIT COUNT REPORT 04.30.2019 CHANGING HOMELESSNESS
APPENDIX A:
TEN YEAR TRENDS
YEAR OVER YEAR SHELTERED AND
UNSHELTERED TOTALS
2500
2000
1500
1000
500
0
2009 2010 2011 2012 2013 2014 2015 2016 2017 2018 2019
SHELTERED 2019 2069 1593 1542 1671 1756 1427 1518 1437 1365 1146
UNSHELTERED 423 1172 1432 1319 1097 293 426 441 432 429 508
15PIT COUNT REPORT 04.30.2019 CHANGING HOMELESSNESS
APPENDIX B:
GOVERNANCE AND MEMBERSHIP
Northeast Florida Continuum of Care Governance Board
Changing Homelessness appreciates the guidance of
the Northeast Florida
CONTINUUM OF CARE GOVERNANCE BOARD:
• Stephanie Burch, City of Jacksonville • Lili High, Catholic Charities
• Micheal Cochran, Community Member • Ross Jones, UF Health
• Michelle Cook, Atlantic Beach Police • Teri Ketchum, Presbyterian Social Ministries
• Katie Ensign, Jessie Ball duPont Fund • Phyllis Martin, United Way of Northeast Florida
• Will Evans, City of Jacksonville • Shannon Nazworth, Ability Housing
• Cindy Funkhouser, Sulzbacher Center • Doug Orange, Sulzbacher Center
• Matt Galnor, JAX Chamber • John Wright, Nassau County
• Patrick Hayle, Mercy Support Services
Changing Homelessness Board of Directors
CHANGING HOMELESSNESS ACKNOWLEDGES THE LEADERSHIP AND SUPPORT
OF OUR BOARD OF DIRECTORS:
• Sean Hall, Chair • David Berlin
• M. Kevin Woodall, Vice Chair • Joe Wolf
• Derek Brown, Treasurer • Lee Robert Brown
• Ellen Schmitt, Secretary • Paul Davison
• Barney Smith • Terri Lewis
• Brad Russell • Wesley Stapp
• Coretta Hill
15PIT COUNT REPORT 04.30.2019 CHANGING HOMELESSNESS
Northeast Florida Continuum of Care Member Agencies
CHANGING HOMELESSNESS IS GRATEFUL FOR THE HOPE AND COURAGE OF ALL THE ORGANIZATIONS
DEDICATED TO REDUCING AND ENDING HOMELESSNESS:
• Ability Housing • Liberty Center
• Barnabas House • LISC
• BEAM • LSF Health Systems
• Catholic Charities • Lutheran Social Services
• City of Jacksonville, Veterans Services • Mental Health Resource Center
• City Rescue Mission • Mercy Network
• Clara White Mission • Micah’s Place
• Coalition for the Homeless of Nassau • Mission House
• Downtown Vision • Operation New Hope
• Duval County Public Schools • Presbyterian Social Ministries
• Family Promise of Jacksonville • Quality Life Center of Jacksonville
• Family Support Services • Quigley House
• Five S.T.A.R. Veterans Center Inc. • Salvation Army
• Gateway Community Services • Starting Point Behavioral Health
• Her Song • Sulzbacher Center
• Hubbard House • Trinity Rescue Mission
• Jacksonville Housing Authority • United Way of NEFL
• JASMYN, Inc. • Volunteers of America
• Jewish Family and Community Services • Youth Crisis Center
16CHANGING Homelessness
660 Park Street
Jacksonville, Florida 32204
Phone: (904) 318-9184
Email: info@changinghomelessness.orgYou can also read