2017 status muskoxen (Ovibos moschatus) Cape Atholl Thule region Greenland
←
→
Page content transcription
If your browser does not render page correctly, please read the page content below
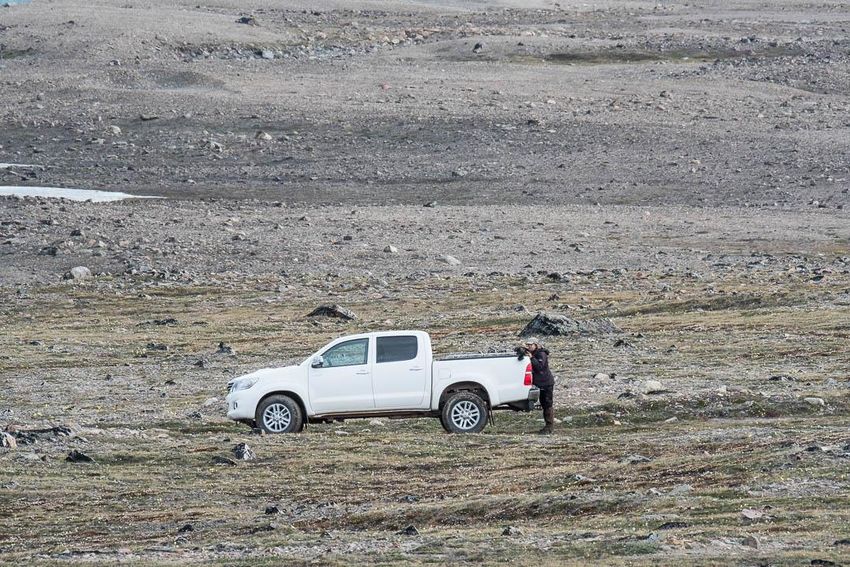
2017 status muskoxen
 (Ovibos moschatus)
      Cape Atholl
Thule region Greenland

                Technical Report No. 104, 2022
Pinngortitaleriffik – Greenland Institute of Natural Resources

                                                                 1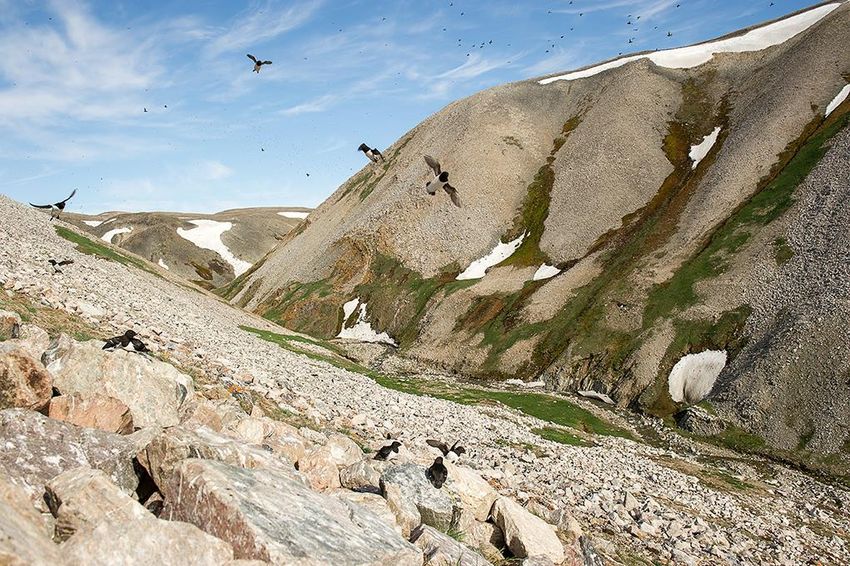
Title:                     2017 status muskoxen (Ovibos moschatus) Cape Atholl,
                           Thule region Greenland

Authors:                   Christine Cuyler1, Kasim S. Virk2, Thomas B. Clausen2,
                           Flemming H. Jensen2, Erik W. Born3, Kristin Laidre1 and
                           Øystein Wiig4

                       1
                         Pinngortitaleriffik – Greenland Institute of Natural Resources, P.O.
                       Box 570, 3900 Nuuk, Greenland
                       2
                         SPE Box 140, 3970 Pituffik, Greenland
                       3
                         Greenland’s Representation, P.O. Box 1915, 1023 Copenhagen K,
                       Denmark.
                       4
                         Natural History Museum, University of Oslo, P.O. Box 1172 Blindern,
                       0318 Oslo, Norway

Series:                    Technical Report No. 104, 2022

Date of publication:       16 February 2022
Publisher:                 Pinngortitaleriffik – Greenland Institute of Natural Resources
Financial support:         Pituffik Municipal Council (Pituffik Borgerråd)
Cover photo:               Inge Gottfredsen: Muskox cows, calves, and juveniles, with
                           Uummannap Kangerlua (Wolstenholme Fjord) in back-
                           ground, July 2017.

ISBN:                      87-91214-81-5
ISSN:                      1397-3657
EAN:                       9788791214813

Cited as:                  Cuyler, C., Virk, K.S., Clausen, T.B. Jensen, F.H., Born, E.W.,
                           Laidre, K. and Wiig, Ø. 2022. 2017 status muskoxen (Ovibos
                           moschatus) Cape Atholl, Thule region Greenland.
                           Pinngortitaleriffik – Greenland Institute of Natural
                           Resources. Technical Report No. 104. 60 pp.

Contact address:           The report is only available in electronic format. You can
                           download a PDF-file of the report at this homepage
                           https://natur.gl/forskning/rapporter/

                           Pinngortitaleriffik – Greenland Institute of Natural Resources
                           P.O. Box 570
                           3900 Nuuk, Greenland

                           Phone: +299 36 12 00
                           E-mail: info@natur.gl
                           www.natur.gl

2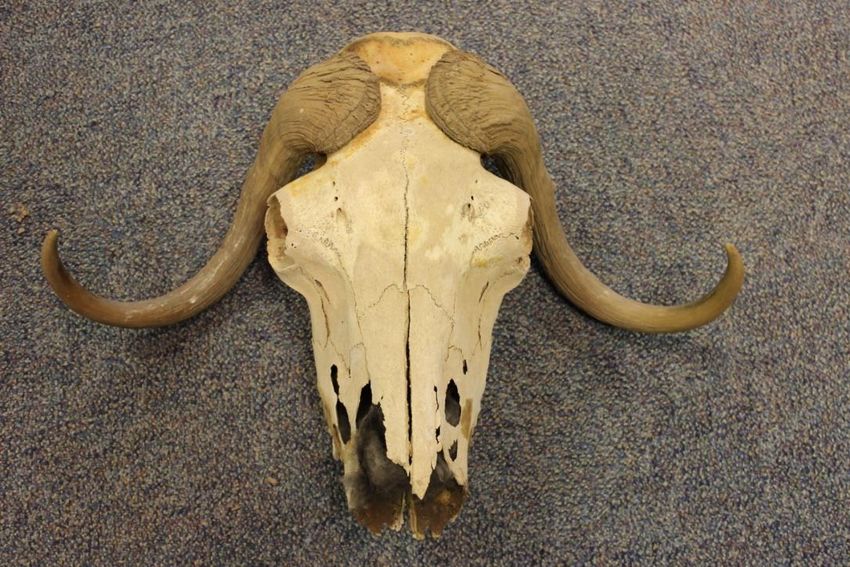
2017 status muskoxen
           (Ovibos moschatus)
                Cape Atholl
          Thule region Greenland

                                           By

Christine Cuyler1, Kasim S. Virk2, Thomas B. Clausen2, Flemming H. Jensen2
              , Erik W. Born3, Kristin Laidre1 and Øystein Wiig4

1
  Pinngortitaleriffik – Institute of Natural Resources, P.O. Box 570, 3900 Nuuk, Greenland
                              2
                                SPE Box 140, 3970 Pituffik, Greenland
         3
           Greenland’s Representation, P.O. Box 1915, 1023 Copenhagen K, Denmark.
4
  Natural History Museum, University of Oslo, P.O. Box 1172 Blindern, 0318 Oslo, Norway

                              Technical Report No. 104, 2022
              Pinngortitaleriffik – Greenland Institute of Natural Resources

                                                                                             3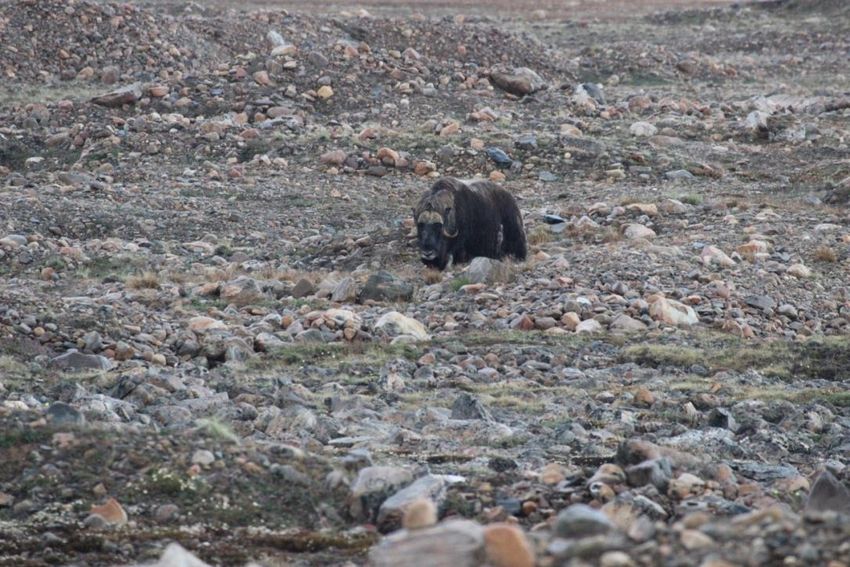
[Empty page]

4
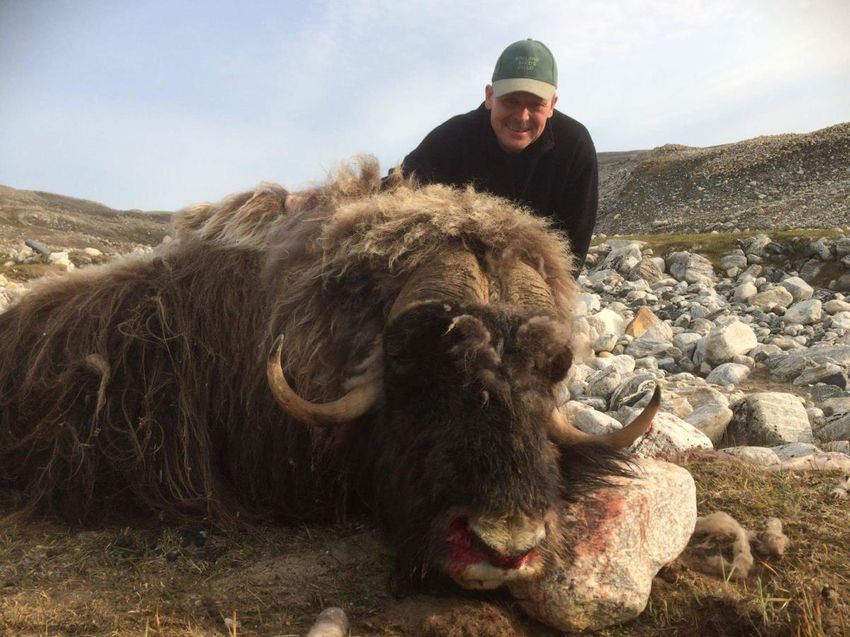
Table of Contents
Summary (English) ................................................................... 7
Eqikkaaneq (kalaallisut) ......................................................... 8
Resumé (dansk) ......................................................................... 9
Introduction ............................................................................. 10
Methods .................................................................................... 16
Results ...................................................................................... 21
Discussion ................................................................................ 24
Acknowledgements ................................................................. 32
Literature cited ........................................................................ 33
Figures
1. Map of the Cape Atholl area, which totals ca. 880 km2, showing Pituffik ... Page 10
2. Flight paths during survey for polar bears between Kullorsuaq and … Page 13
3. Incidental observations of muskoxen made during flights searching for ... Page 14
4. Map of the grid cells used during the 2017 muskox counts of Cape Athol ... Page 18
5. Ground: Road and sea routes used for July 2017 minimum count … Page 18
6. Aerial route flown for 14 September 2017 minimum count ... Page 19
7. Location and size of muskox groups observed during the road and sea … Page 20
8. Location and size of muskox groups observed during the aerial survey … Page 23
9. Qoororsuaq valley mouth, 16 August 2010: Green vegetated slopes … Page 35
10. Qoororsuaq valley, 03 July 2011: Green vegetated slopes … Page 35
11. Qoororsuaq valley mouth, 02 July 2011: Green vegetated slopes … Page 36
12. Qoororsuaq valley mouth, 24 July 2017: Green vegetated slopes … Page 36
13. Aerial view of Qoororsuaq valley, 14 Sept 2017: Vegetated slopes under … Page 37
14. Aerial view of Qoororsuaq valley, 14 Sept 2017, inner valley view to NNE. Page 37
15. Aerial view of inner west side of the Qoororsuaq valley, 14 Sept 2017 … Page 38
16. Satellite image of Qoororsuaq valley system, May 2010: Downloaded … Page 38
17. Outer Qoororsuaq valley (above) and closeup Paakitsoq shore cliff (below) Page 39
18. Further photos of Qoororsuaq valley mouth with closeup, taken 24 July Page 40
19. Christine Cuyler and Kasim S. Virk, background shows interior of … Page 42
20. Kasim S. Virk beside the Cessna 172 ready for aerial count 14 September... Page 42
21. Christine Cuyler steadying the telescope while viewing muskoxen. Page 43
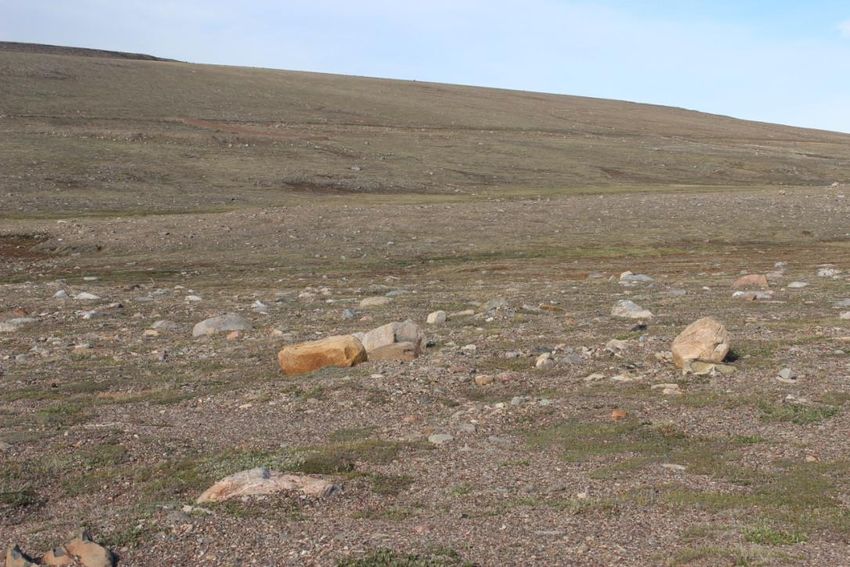
22. Low elevation terrain (< 100m) near the Thule Air Base was typically … Page 43
23. Thule Air Base, illustrating minimal vegetation and red brown mud/clay Page 44
24. The iconic flat-topped Dundas Mountain, just NW of the Thule Air Base Page 44
25. Terrain and vegetation typical for around the Thule Air Base. Page 45
26. Terrain and vegetation typical for just east of the Thule Air Base. Page 46
27. A bull muskox grazing among boulders near Thule Air Base. Page 47
28. Terrain and sparce vegetation typical to around the Thule Air Base. … Page 47
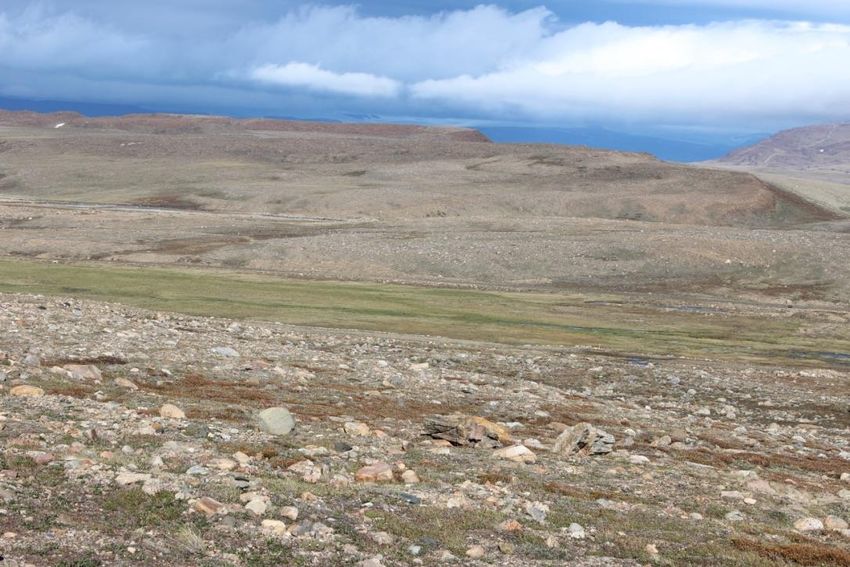
29. Landscapes and sparse vegetation typical of the interior and river valleys. Page 48
30. Terrain and sparse vegetation typical at the edge of the Greenland Ice Cap. Page 49
5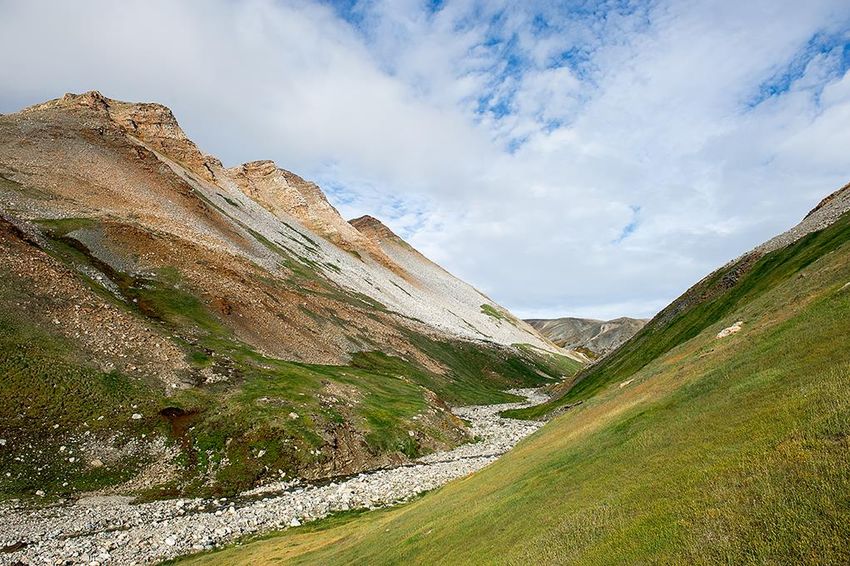
31.   Typical open vista (view to NE on road east from Thule Air Base) with …       Page 49
    32.   Group of four muskoxen grazing on sparse vegetation typical ...               Page 50
    33.   Rocky shore at Amitsuarsuk, Uummannap Kangerlua (Wolstenholme …               Page 50
    34.   Contrast between the green vegetation on the rocky scree slopes …             Page 51
    35.   Contrast between the slim horns and slight boss of cows (above) and …         Page 52
    36.   Natural mortality of an old bull muskox. Thule Air Base pipeline in …         Page 55
    37.   Polar bear scavenging the ca. three-week old carcass of adult bull …          Page 55
    38.   Young mature bull aged 5-6 years shot by Lemme Svensson, August 2017.         Page 56
    39.   White fuzz hair, typical of young bulls, behind (and between) horn boss ...   Page 57
    40.   Hyperplasia of the right front hoof from mature bull muskox, age 5-6 …        Page 57

Tables
1.        Muskox observations in Cape Atholl since 1986 re-introduction ...             Page 12
2.        Harvest quotas and seasons for muskoxen of Cape Atholl. Reported …            Page 15
3.        Muskox demographics from ground (road and sea) minimum count ...              Page 21
4.        Aerial minimum count results for muskoxen of Cape Atholl, 14 Sept 2017.       Page 24
5.        Raw data: Ground (road and sea) minimum count, 24 July – 06 August …          Page 53
6.        Raw data from aerial minimum count of muskoxen in Cape Atholl ….              Page 54

Appendices
1.        Qoororsuaq Valley, south coast Cape Atholl area                               Page 35
2.        Brief description methods: 2013 aerial polar bear survey                      Page 41
3.        Field work photos (taken 24-31 July, unless otherwise indicated)              Page 42
4.        Raw Data: Ground (road and sea) minimum count                                 Page 53
5.        Raw Data: Aerial minimum count, 14 September 2017                             Page 54
6.        Natural mortality, mature old bull                                            Page 55
7.        One observation of hoof hyperplasia in 2017                                   Page 56
8.        Data sheet for ground (road and sea) minimum count                            Page 58
9.        Data sheet for aerial minimum count                                           Page 59

6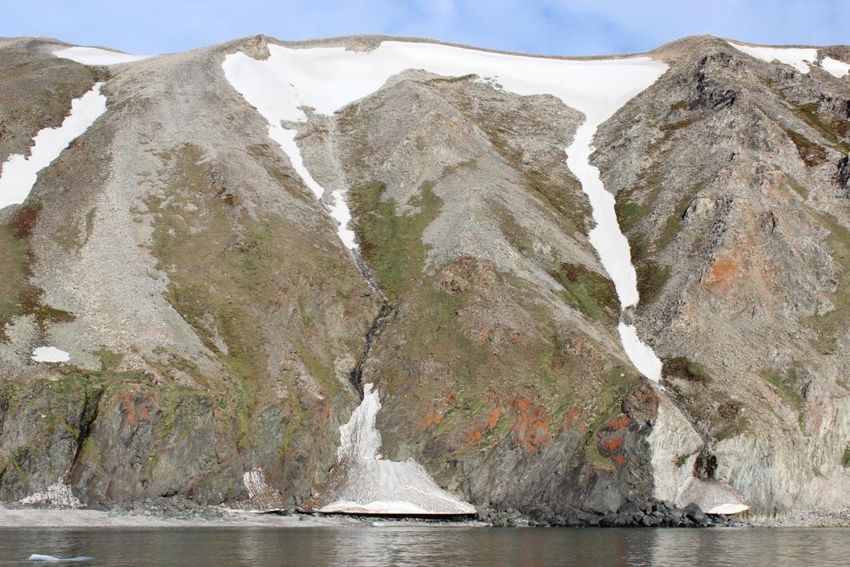
Summary (English)

Muskoxen (Ovibos moschatus) once inhabited the Cape Atholl area
(Kangaarsuk) between ca. 76o 14 ́ N and ca. 76o 35 ́ N in NW Greenland. In the
1800s, however, the muskox population in this area extirpated. In 1986, seven
juvenile muskoxen were translocated from the Kangerlussuaq/Søndre
Strømfjord region and re-introduced to the Cape Atholl area. The first
systematic survey (September 2015) dedicated to muskoxen and covering
almost half of the Cape Atholl area, resulted in a minimum count of 276
muskoxen. This report describes the second similar aerial minimum count
(September 2017) and additionally a ground (road and sea) count of July-
September 2017. The latter covered a smaller portion (14%) of the area than
the aerial count (34%). Despite recent range expansion, the 2017 study
indicated that most of the muskox population continued to remain
concentrated in valleys and lowlands in the southern half of the Cape Atholl
area. The ground count was 109 muskoxen, which included 8.3% calves (age <
1-year). The aerial minimum count was 212 muskoxen, which included
roughly 10% calves. The aerial count was superior to the ground count in both
area coverage and numbers of muskoxen observed.

At ca. 76°N, the Cape Atholl area is high Arctic and elevations above 200 m
are sparsely vegetated. Despite this, the muskoxen have thrived since their re-
introduction to the area. This appears related to the presence of huge seabird
breeding colonies of little auks (Alle alle), whose annual guano deposition
causes vegetation hot spots. In 2017, given minimum count of 212 muskoxen,
density was ca. 1/km2 for all areas with elevation
Eqikkaaneq (kalaallisut)

Avanersuarmi Kangaarsummi timmisartumik, Kangaarsuup affaata missaa,
kisitsivigineqarmat ikinnerpaamik 276-inik umimmaqarnissaa
missiliorneqarpoq. Kangaarsummi umimmaat ikinnerpaaffilerniarlugit
september 2017-imi kisitsineq, kingullermik 2015-imi kisitsinermut
sanilliunneqarsinnaavoq. Nalunaarusiami aamma ilanngullugu Kangaarsuup
sineriaa atuarlugu umimmannik nunamiittuniik aammalu Pituffimmi biilimiit
umimmaat takusat ikinnerpaaffilerniarlugit juli-september tungaanut 2017-
imi kisitsivigineqarnerat ilanngullugit allaaserineqarput. Umiatsiamik
taamatut Kangaarsummi kisitsinermi tamatuma nunataata 14 %-iata missaa
kisitsiviuvoq, timmisartumilli kisitsinerup nunataata 34 %-iata missaanik
kisitsiviulluni. Naak umimmaat siaruarfigisimasartik
annertuseriarsimagaluaraat, taamaattoq Kangaarsuup kujataani
qooqquniinniarnerusimapput atsissuniinniarnerusimallutillu. Umiatsiamit
aqqusinermilu biilimiit kisitat 109-usimapput, taakkkunannga 8,3 %-ii
piaraallutik suli ukiisimanngitsulluunniit. Timmisartumik kisitsinerup
inerneraa Kangaarsummi ikinnerpaamik umimmaat 212 takuneqarsimasut,
taakkua ilaat tassa 10 %-iisa missaat piaraallutik ukioq ataaserluunniit suli
angusimanngikkaat. Ataatsimut naliliissagaanni timmisartumik kisitsineq
umiatsiamiit aqqusinermiillu kisitsinerniit pitsaanerusutut nalilerneqarpoq,
tassa kisitsiviup nunap annertussusia aammalu umimmaat takusat
amerlassusiat eqqarsaatigalugit. Kanngaarsuup nalaata, avannarpasissuseq
76o N, silaannaa issittup silaannaa nillertuuvoq, immamiilllu qatsissuseq 200
meterit missaanniittoq nuna naggorluttuulluni. Pissutsilli taamaakkaluartut
umimmaat taavungarsuaq nuussaallutik nunaligussat
ajoriinnagassaanngitsumik aniguisarsimapput. Taama ajunngiusattumik
atugaqarnerinut peqqutaavoq appaliarsuit ineqarfii, appaliarsuimmi anaat
(guano) kuullutik nunamut eqqaamiorisaminnik naggoritsilluinnartarmata.
Aallaavigigutsigu umimmaat ikinnerpaamik 212-iusut, taava km2-mut
eqimassusiat umimmaap ataatsip missaanniissaaq, naggorissoqarfimmilu
km2-mut sisamat tallimallu missaanniissaaq. Naak 2017-imi
piaqqiarineqarsimasut ikiginakulukkaluartut, Pituffimmi sulisut 2021-mi
oqaatigaat umimmaat eqqaminniittut ikiliartortutut isikkoqanngitsut.
Kangaarsummilu umimmannut tunngatillugu pissutsit malinnaaffiginiarlugit
innnersuussutigineqarpoq, aaqqissuulluakkamik timmisartumik kisitsinerit
siunissami aggersumi ingerlateqqinneqartariaqaraluartut.

8
Resumé (dansk)

Moskusokser (Ovibos moschatus) forekom tidligere i Kap Atholl-området
(Kangaarsuk) mellem ca. 76o 14 ́ N and ca. 76o 35 ́ N i Nordvestgrønland.
Imidlertid forsvandt disse fra området engang i 1800-tallet. I 1986 blev
moskusokser re-introduceret til Kap Atholl-området, da syv unge individer
blev flyttet dertil fra Kangerlussuaq/Søndre Strømfjord. I september 2015
gennemførtes en første systematisk optælling, med det formål at optælle
moskusokser i Kap Atholl-området. Denne flyoptælling, der dækkede
halvdelen af Kap Atholl-området, resulterede i et minimumtal på 276 dyr.
Denne rapport beskriver den anden - og med 2015-optællingen
sammenlignelige - flyoptælling foretaget i september 2017 med det formål at
få et estimat af minimumsantallet af moskusokser ved Kap Atholl. Rapporten
beskriver også en optælling foretaget fra båd langs kysten og fra bil (vejnettet
omkring Pituffik/Thule Air Base) i juli-september 2017. Sidstnævnte
optælling dækkede ca. 14% af Kap Atholl-området, mens flyoptællingen
dækkede ca. 34%. Til trods for at moskusokserne har udvidet deres generelle
udbredelses-område, viste 2017-studiet at de stadig især var koncentreret i
dale og de lavereliggende egne i den sydlige halvdel af Kap Atholl-området.
Optællingen fra båd og vejnet gav et samlet tal på 109 moskusokser, hvoraf
8,3% var ”under 1-år-gamle” kalve. Flyoptællingen resulterede i et
minimumstal på 212 dyr, hvilket inkluderede 10% ”under 1-år-gamle”. kalve.
Flyoptællingen var generelt bedre end båd- og vejnetoptællingen både hvad
angår omfang af område, der blev dækket, og antal moskusokser set.

Omkring 76o N er klimaet i Kap Atholl-området højarktisk og områderne over
200 m over havets overflade (o.h.o.) har sparsom vegetation. Ikke desto
mindre synes bestanden af re-introducerede moskusokserne at have klaret sig
godt. Det skyldes især forekomsten i området af store fuglefjelde med
søkonger (Alle alle), hvis afføring (guano) giver gødning til frodige
vegetations ”hot spots”. Med udgangspunkt i minimumstallet på 212 moskus
i 2017 var tætheden (densiteten) af dyr ca. 1 pr. km2 i alle områder under 200
m o.h.o., mens den var 4-5 moskusokser pr. km2 i disse ”hot spots”. Selv om
procentdelen af nye kalve var forholdsvis lav i 2017, har observationer
foretaget i 2021 af personale fra Pituffik ikke antydet en nedgang i antallet af
moskusokser i området. For at følge udviklingen i bestanden i Kap Atholl-
området anbefales det fremover at foretage systematiske flyoptællinger
(minimumsantal samt andel af kalve).

                                                                               9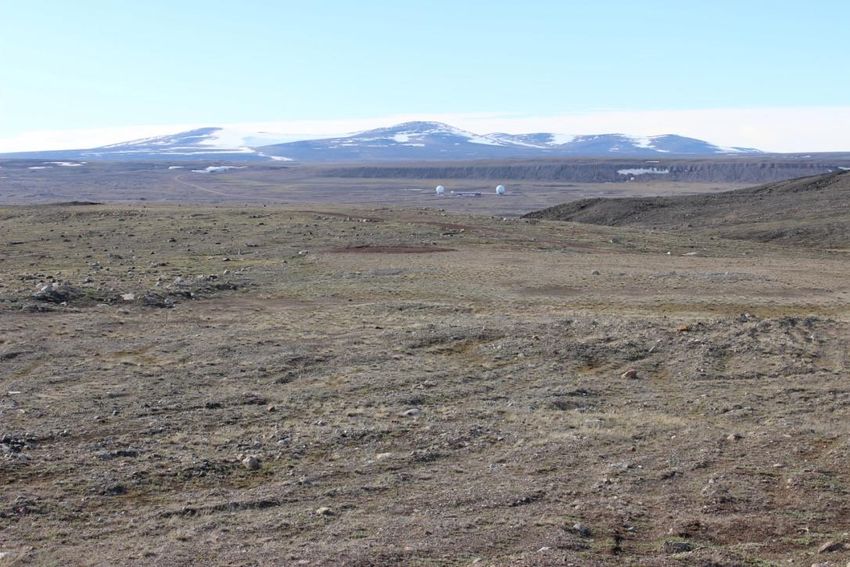
Introduction

 Cape Atholl is a sub-area (ca. 76° 30’ N; 69° W) within the Thule region of
northwest Greenland (Fig. 1). The muskoxen inhabiting this sub-area were
extirpated by harvest in the 1800’s (Vibe 1986). About a century later,
muskoxen were re-introduced and established a small population.

 Figure 1. Map of the Cape Atholl area, which totals ca. 880 km2, showing Pituffik – Thule Air Base,
place names and the highest elevation, Pingorsuit (P-mountain) at 810 m.

Muskox translocation / re-introduction in 1986
In 1986, in the period 02–06 July, 27 ca. 14-month-old muskoxen were live
captured at Kangerlussuaq (Søndre Strømfjord) (ca. 67° N, 51° W), using dogs,
helicopters, and immobilising drug darts (Vibe 1986). Only seven of these
yearling muskoxen, five females and two males, were destined for
translocation to Cape Atholl. The remaining 20 yearlings were released
further north in the Thule region, i.e., six in Mac Cormick Fjord and 14 in
Inglefield Land. All the yearlings were ear tagged, packed into individual
plywood crates, and flown by USA Air Force C141 freight airplane to the
Pituffik – Thule Air Base. The 27 yearlings arrived at Thule on 11 July 1986
(details in Christiansen & Lacoppidan (1986)). Over the subsequent two
weeks the muskox yearlings were transported to their final locations in the
Thule region. The release locations, Cape Atholl, Mac Cormick Fjord, and
Inglefield Land were decided by the local Thule member of the Greenland
Home-rule parliament, Ûssarqaq Qujaukitsoq, in collaboration with the Thule
Municipal Council (Cuyler et al. 2016). The seven Cape Atholl yearlings were
airlifted, while inside their crates, by Air Greenland Bell 212 helicopter, to the

10
Maniiseqqat (Green Valley), on the south coast of Cape Atholl area. Some
plywood crates can still be seen at the release site. The Maniiseqqat (Green
Valley) release site was aptly named for its lush green vegetation, which is
owing to the large annual deposition of seabird guano, specifically from the
little auk (Alle alle) (Mosbech et al. 2018). Little auk breeding colonies are huge
and numerous in the Thule region and create extensive thick plant cover on
many slopes and valleys, specifically along the ca. 25 km long southern coast
of the Cape Atholl area, e.g., from Kangaarsuk to the Pituffik Glacier (Fig. 1)
(Boertmann & Mosbech 1998, Mosbech et al. 2018). Maniiseqqat translates to
“the place with lots of [little auk] eggs”. Near little auk colonies along the
southern coast, polar foxtail grass (Alopecurus alpinus) is abundant and
supports muskox densities 10 times higher than elsewhere in the Cape Atholl
area (Mosbech et al. 2018). Further details regarding the muskoxen and the
Cape Atholl area are described in Cuyler & Mølgaard (2002), and Cuyler et al.
(2016). Green vegetation at little auk colonies is shown in Appendix 1.

Muskox population size and distribution
Incidental observations indicated that following re-introduction, muskoxen
abundance increased slowly and that generally calf percentages were high
(Table 1). Most of the population, and highest densities, have been in the
southern portion of the Cape Atholl area, and usually near little auk colonies
(Cuyler et al. 2016, Mosbech et al. 2018). In 2012 and 2013 (4-11 September and
7-17 September, respectively) systematic observations of muskoxen were
made during aerial searches for polar bears (Ursus maritimus) (Born et al. 2012,
2013, Born, Laidre & Wiig unpublished), brief methods provided in Appendix
2. The polar bear search path did not cover the entire Cape Atholl area but
followed the seacoast with one exception. On return from the Thule Air Base
to the south of Melville Bay on 10 September, a diagonal path across the Cape
Atholl area was included (Fig. 2). The polar bear search encompassed the
shorelines of Cape Atholl and the entire Melville Bay. Despite this, no
muskoxen were observed south of the Cape Atholl area i.e., east, or south of
the Pituffik Glacier. 39 muskoxen were observed in 2012, and in 2013
observations indicated 155 to 196 muskoxen (Fig. 3). Since the maximum, 196,
may include double counting of animals present in the Maniiseqqat (Green
Valley), we assume 155 muskoxen as the minimum count for 2013. These
recent sightings suggested that muskoxen remained numerous in the valleys
along the southern coast of the Cape Atholl area, specifically in the
Maniiseqqat and Qoororsuaq valleys, and that none were present east or
south of the Cape Atholl area.

                                                                                11
Table 1. Muskox observations in Cape Atholl since 1986 re-introduction indicating group size and calf
percentages. Excepting 1986 re-introduction and 2015 minimum count of entire Cape Atholl area, all
observations were opportunistic and cannot indicate abundance. Blank cells indicate absence of data.
Muskox Calf Calf
Year Location Composition
number1 number2 %
1986 a Maniiseqqat 7 0 0 Mixed
1990 b Maniiseqqat 7 0 0 Mixed
1991 b Maniiseqqat 7 2 28.6 Mixed
1993 b Inner Narsaarsuk (Pingorsuit) 6 Mixed
1994 a Maniiseqqat 19 7 35.0 Mixed
1994 a Maniiseqqat 1 0 0 Solitary bull
1995 a Maniiseqqat 24 7 26.9 Mixed
1995 a Maniiseqqat 1 0 0 Solitary bull
1995 a Maniiseqqat 1 0 0 Solitary bull
1996 a Maniiseqqat 33 8 24.2 Mixed
1997 c Maniiseqqat + Narsaarsuk d 32 7 21.9 Mixed
1997 c Maniiseqqat + Narsaarsuk d 12 5 41.7 Mixed
1997 c Maniiseqqat + Narsaarsuk d 1 0 0 Solitary bull
1997 c Maniiseqqat + Narsaarsuk d 1 0 0 Solitary bull
1997 c Maniiseqqat + Narsaarsuk d 1 0 0 Solitary bull
1998 e Maniiseqqat 10 1 7.1 Mixed
1998 e Maniiseqqat 1 0 0 Solitary bull
1998 e Maniiseqqat 1 0 0 Solitary bull
1998 e Maniiseqqat 1 0 0 Solitary bull
1998 e Maniiseqqat 1 0 0 Solitary bull
2001 e Maniiseqqat 18 5 23.8 Mixed
2001 e Maniiseqqat 1 0 0 Solitary bull
2001 e Maniiseqqat 1 0 0 Solitary bull
2001 e Maniiseqqat 1 0 0 Solitary bull
2002 e Unspecified 30-35 Mixed
2002 e Unspecified 51 14 27.5 Mixed
2003 e Maniiseqqat 40 5 12.5 Mixed
2003 e Maniiseqqat 12 2 16.2 Mixed
2003 e Maniiseqqat 1 0 0 Solitary bull
2003 e Maniiseqqat 1 0 0 Solitary bull
2003 e Maniiseqqat 1 0 0 Solitary bull
2003 e Maniiseqqat 1 0 0 Solitary bull
2003 e Maniiseqqat 1 0 0 Solitary bull
2012 f South coast Cape Atholl area 39 Mixed
2013 f South coast Cape Atholl area 155 Mixed
2015 g Entire Cape Atholl area 276 48 17.4 Mixed
1
These are the group size (1986 – 2003) or total number (2012, 2013, 2015) of muskoxen observed.
1
These are the number of calves already included in the previous column for group size or total number muskoxen observed.
a
Burnham 1997
b
Peter Nielsen pers. comm.
c
Local Knowledge provided to the Government of Greenland, Ministry for Environment & Nature
d
Previously one cohesive group, now appears to have separated into at least two groups and several lone bulls. Hoof hyperplasia
on muskoxen observed in both valleys.
e
Cuyler & Mølgaard (2002).
f
Aerial count in conjunction with polar bear survey, September (Born et al. 2012, 2013 and Born, Laidre & Wiig, unpublished).
g
Aerial minimum count for muskoxen of Cape Atholl, September (Cuyler et al. 2016).
12Figure. 2. Flight paths during survey for polar bears between Kullorsuaq and the Pituffik – Thule Air
Base, 4-11 September 2012 (Born et al. 2012). Only the upper northwest portion involved the Cape
Atholl area. The flight path during 7-17 September 2013 was similar.
After the 1986 re-introduction muskox distribution was concentrated in the
Maniiseqqat (Green Valley) (Burham 1996). Nevertheless, muskoxen slowly
expanded their range use to include the entire southern coast (Pituffik glacier
to Kangaarsuk (Fig. 1), and finally moved northward toward the Pituffik –
Thule Air Base (Cuyler et al. 2016). In 2015 an aerial minimum count,
specifically for muskoxen, was flown by fixed-wing Cessna 172 and covered
46% of the Cape Atholl area. A minimum of 276 muskoxen were observed
and revealed a calf percentage of 17.4% (Cuyler et al. 2016), which is relatively
low compared to values prior to 2003. The 2015 count indicated muskoxen
were still concentrated in the valleys and lowlands of the southern portion of
the Cape Atholl area, but also observed 41 near the Pituffik – Thule Air Base
in the north. In fact, by spring 2015 sightings of muskoxen in the northern
portion of the Cape Atholl area near the Pituffik – Thule Air Base were
becoming common. By spring 2017 there was an increase in the number of
groups sighted and group sizes. Also, that spring, a local hunter, Olennguaq
Kristensen, observed a lone muskox near the village of Savissivik. At least one
muskox had moved east and south of the Pituffik glacier/Cape Atholl area.
13A: 2012
B: 2013
Figure. 3. Incidental observations of muskoxen made during flights searching for polar bears (Born et
al. 2012, 2013, Born, Laidre & Wiig unpublished), (A) 7 September 2012, (B) 9 and 10 September
2013 (blue and brown respectively).
Harvest
Hunting of the re-introduced muskoxen on Cape Atholl was prohibited for
the first 15 years (Table 2), although in the 1990’s two culls occurred to
examine severe hoof hyperplasia (overgrown hooves). The first cull, in 1996,
involved just one bull muskox. The second, in 1998, culled 14 muskoxen of
mixed sex and age (Cuyler & Mølgaard 2002). Hunting began in 2001 with a
quota of five muskoxen. From autumn 2007 to spring 2016, the hunting season
was nine months long (August to April inclusive) with a quota of 15
14muskoxen annually. Reported harvests seldom utilized the entire quota.
Given the 2015 count observed 276 muskoxen, which included 17.5% calves
combined with Pituffik – Thule Air Base staff reporting vegetation damaged
by muskoxen in lowlands (elevations < 200 m), Cuyler et al. (2016)
recommended preventing population growth. The annual harvest quota rose
from 5% (n=15) of the observed 2015 minimum count to 14.5% (n=40). The
length of the hunting season remained at nine months. An additional five
trophy bulls were permitted, but as of the time of this study none were
reported taken. Meanwhile, incidental muskox sightings in spring 2017
suggested continued range expansion and similar calf production as in 2015.
Table 2. Harvest quotas and seasons for muskoxen of Cape Atholl. Reported shot is incomplete
following 2000, and five years completely lack hunter reporting. Blank cells indicate absence of data.
Quota Reported
Year Season
Commercial / Sport shot
1986 Hunting prohibited 0 0
1990 Hunting prohibited 0 0
1991 Hunting prohibited 0 0
1993 Hunting prohibited 0 0
1994 Hunting prohibited 0 0
1995 Hunting prohibited 0 0
1996a Autumn cull 1 bull: examined hooves 0 1
1997 Hunting prohibited 0 0
1998b April cull of 14: overgrown hooves study 0 14
1999 Hunting prohibited 0 0
2000 Hunting prohibited 0 0
2001c 5 3
2002c 5
2003c 5
2004/2005c 1 Aug – 30 Sept 2004, 1-31 March 2005 7
2005/2006 1 Aug – 15 Nov 2005, 1 Jan – 30 Apr 2006 2
2006/2007
2007/2008c 1 Aug 2007 – 30 Apr 2008 15 11
2008/2009c 1 Aug 2008 – 30 Apr 2009 15 2
2009/2010c 1 Aug 2009 – 30 Apr 2010 15
2010/2011c 1 Aug 2010 – 30 Apr 2011 15 15
2011/2012c 1 Aug 2011 – 30 Apr 2012 15 3
2012/2013 1 Aug 2012 – 30 Apr 2013 15 10
2013/2014c 1 Aug 2013 – 30 Apr 2014 15 7
2014/2015 1 Aug 2014 – 30 Apr 2015 15 8
2015/2016d 1 Aug 2015 – 30 Apr 2016 15 3
2016/2017d 1 Aug 2016 – 30 Apr 2017 40 27*
2017/2018d 1 Aug 2017 – 30 Apr 2018 40
Trophy Quota
2015/2016c 1 July – 31 Oct 2015; 15 Feb – 30 Apr 2016 5 0
2016/2017c 1 July – 31 Oct 2016; 15 Feb – 30 Apr 2017 5 0
2017/2018c 1 July – 31 Oct 2017; 15 Feb – 30 Apr 2018 5
a
Burnham 1997
b
Cuyler & Mølgaard 2002
c
Ministry for Hunting and Fishing (APN), unpublished data.
d
Individual hunter reports/licenses filled in by hunters.
* Two muskoxen were reported shot close to the remains of turf houses at Dundas, which is immediately across the small bay at
the Thule Air Base. This location is outside of the designated Cape Atholl hunting area.
15Present Study We examined the 2017 muskox distribution and abundance in the Cape Atholl area by completing both ground and aerial minimum counts. We began with the ground minimum count, which was conducted by boat, truck, and all-terrain vehicle (ATV) from 24 July to 06 August. When possible, a detailed demographics (sex and age composition) of each group was obtained. On 14 September 2017, we completed an aerial fixed-wing minimum count of the Cape Atholl area. This report presents the results from these counts of muskoxen on Cape Atholl, which include the observed autumn distribution, total counts, calf percentage and demographics. Methods Study area At ca. 76°N, the Cape Atholl area’s location is approximately halfway between the Arctic Circle and the North Pole. Total area is ca. 880 km2, of which only 202 km2 are under 200 m elevation. The Cape Atholl area has a somewhat rectangular shape, which is bounded to the North, West, and South by the sea and to the East by the Greenland Ice Cap, of which the southeast glacial tongue is known as the Pituffik Glacier. To the north is Uummannap Kangerlua (Wolstenholme Fjord), which is thick with ice bergs originating from three glacial tongues of the Greenland Ice Cap. The area’s topography is characterised by open expanses that stretch west from the front of the Greenland Ice Cap, interrupted only by the Pingorsuit (P-mountain) massive and two long ridges named the North and South mountains. The Pingorsuit massive consists of five rounded peaks. The highest is 810 m. All five have gentle slopes. Two peaks are visible from the road network and share a permanent ice patch. With the notable exception of the Pituffik – Thule Air Base/Dundas area, the area’s coast lines are generally exposed steep slopes with narrow shoreline/beach below. Safe harbours are few to non-existent. The Cape Atholl area is high arctic with cool short summers and NDVI (Normalized Difference Vegetation Index) is generally low (Mosbech et al. 2018). Even in July, green is not a common colour in the typically light brown landscapes of the Cape Atholl area. The exceptions can include riverbanks, some valleys near the Thule Air Base, and most markedly, the steep slopes lining the south coast, which are also punctuated by several vivid green 16
vegetated ravine-like valleys. The presence of multiple little auk colonies is
responsible for the extent of lush green vegetation along the south coast’s
slopes and valleys (Mosbech et al. 2018). Elsewhere, vegetation is sparse and
low in stature. All willow (Salix spp.) and birch (Betula spp.) hug the ground,
with their flowering parts sticking straight up to only about 4-5 cm above the
soil. Grasses seldom reach more than a height of 10 cm.

In addition to muskoxen, other mammals present in the Cape Atholl area
include only the arctic hare (Lepus arcticus), arctic fox (Vulpes lagopus), and the
occasional polar bear (Ursus maritimus) or caribou/reindeer (Rangifer tarandus
spp.). Notable by their continued absence are lemmings (Dicrostonyx
groenlandicus) and polar wolves (Canis lupus arctos). Albeit regarding the
latter, in 2021 tracks of a single canid were observed near the Pituffik – Thule
Air Base. However, no animal was observed, and it was difficult to ascertain
whether the tracks were from a wolf, or a loose Greenland sled dog. Although
uncommon, in the past loose sled dogs have occurred near the Pituffik –
Thule Air Base. To date and for the past 30 years, polar wolves have never
been observed or shot near the Pituffik – Thule Air Base or elsewhere in the
Cape Atholl area (Kasim Virk pers. comm.).

For clarity, it is worth noting that the Cape Atholl area has two locations
sharing that name (Fig. 1). The first, Kangaarsuk (Cape Atholl), has both
Greenlandic and English names, and is the region’s southwest cape. The
second is a promontory known to Pituffik locals by the Danish name, Kap
Atholl, is midway on the southern coast of the region. For further description
of the study area see Cuyler et al. (2016), while Appendix three contains
several photos illustrating the Cape Atholl area.

Survey design
Ground count: road and sea
From 24 July to 06 August 2017, a muskox minimum count and demographics
was completed by the Greenland Institute of Natural Resources (GINR) in
collaboration with the Pituffik Municipal Council. Owing to either rain or
storm force winds, which forced closure of the road network and prohibited
sailing, this count took place on just 4 days (24, 26 & 29 July and 06 August).
Participants included Christine Cuyler (senior scientist, GN), Kasim S. Virk
(Chair, Municipal Council for Pituffik – Thule Air Base), and Inge Gottfredsen
(photographer). We sailed the coastline on the evening of 24 July. On 26 and
29 July we drove the principal roads near the Pituffik – Thule Air Base. On 06

                                                                                 17
August, ATVs were used to reach the far northeast portion of the Cape Atholl area. Observed muskoxen were assigned a grid-cell position (Fig. 4). Figure. 4. Map of the grid cells used during the 2017 muskox counts of Cape Atholl area. Each square measures 3x3 km Figure. 5. Ground: road and sea routes used for July 2017 minimum count of muskoxen in Cape Atholl: sailing (solid orange line), roads driven (solid brown lines) and ATV route (dashed brown line). Using Leica telescope or binoculars (32-x and 10-x magnification respectively), each muskox group was then examined for total number, and the sex and age 18
of the individuals (Appendix 4, 5). Calves were identified by their small body
size. Sex and age of older animals were determined by horn size/shape and
body size (Henrichsen & Grue 1980, Olesen & Thing 1989, Alaska Dept. of
Fish & Game 2010). To avoid double counting, once an area, valley or coast
had been counted it was considered ‘finished’ and never counted again. For
example, near the Pituffik – Thule Air Base, several groups and individuals
were assumed seen repeatedly in the same areas throughout the study period.
We sailed approximately 55 km of coastline and drove about 93 km of
roadway/track (Fig. 5). Strip width for the coastline was about 500 m, and
twice that for roadways driven. Therefore, the road and sea area surveyed
totalled about 120 km2, providing approximately 14% coverage of the Cape
Atholl area. We noted arctic fox, arctic hare, and ringed seal (Pusa hispida)
sightings.

Figure 6. Aerial route flown for 14 September 2017 minimum count. Total path length (including ferry
return to Thule Air Base) was 360 km, which included the ca. 300 km for actual muskox count. Orange
arrows near the Dundas start and end point indicate flight direction.

Aerial fixed-wing count
On 14 September, from 17:45 until 21:30, a muskox minimum count was
completed by the Pituffik Municipal Council. A Cessna, single engine, 4-seat,
high fixed-wing aircraft was used to fly over the Cape Atholl area. Observers,
Kasim S. Virk (Chair, Municipal Council for Pituffik – Thule Air Base) and
Thomas B. Clausen (Pituffik – Thule Air Base) sat on either side of the
airplane. Steen Svensson (Pituffik Flying Club) was the pilot. Muskox groups
observed were assigned a grid cell position and the total number of

                                                                                                 19
individuals were written onto the grid map (Fig. 4). When possible, the number of observed calves (age < 1-year) was included. Calves were identified by their small body size. Given the stationary nature and slow locomotion of muskoxen, double counting (counting the same group or individual twice) was avoided and assumed impossible by surveying the entire Cape Atholl area in under four hours. Cruising speed was 175 km per hour. Strip width varied but was about 500 m to either side of the line flown. Survey altitude was generally like the 2015 survey, i.e., about 400 m ±100 (1000 – 1500 feet). Flying time was 3 hours and 45 minutes. This is about 1½ hours more than flown in 2015. The greater time used in 2017 resulted from the combination of three things. First, the heavy winds and falling snow along the southern shoreline’s steep slopes created dangerous conditions, which required a greater altitude and made flying close to the steep coastal slopes impossible. The result was multiple time- consuming attempts to fly the assigned route. Secondly, was the aerial photography of the Qoororsuaq vegetation, which required additional circling with the aircraft. Finally, following completion of the Cape Atholl area, a side-trip was flown to south of the Pituffik Glacier for the purpose of photographing the vegetation there. The Cape Atholl portion of the route was about 360 km in length, of which ca. 300 km were for the actual muskox count, and the remaining for ferry return to the Pituffik – Thule Air Base (Fig. 6). Resulting area coverage was about 34% of the Cape Atholl area’s 880 km2. Figure 7. Location and size of muskox groups observed during the road and sea minimum count of the Cape Atholl area, July 2017 20
Results

Ground: Road and sea minimum count July-August 2017
We observed 35 groups of muskoxen, for a total of 109 animals (Fig. 7), which
included 9 calves (born spring 2017). Calves made up only 8.3% of all animals
observed on the road and sea count. Average group size was 3.1 ±3.7 StDev
(Standard Deviation). Maximum group size was 18 muskoxen.

The number of muskoxen in the north near the Pituffik – Thule Air Base
amounted to 37% (n= 40) of the total observed during the ground count.
These included just three groups of mixed sex and age, and four solitary bulls
(Fig. 7). Meanwhile, 63% of all the muskoxen observed were in the southern
half of the Cape Atholl area. For the first time, we observed muskoxen
foraging on the upper half of the extremely steep slopes of the south coast,
specifically from Kangaarsuk south to Cape Atholl. High above on the slopes,
several muskoxen were only detected once they stood up. Initially these were
hidden from our view because they were lying down in pits, which were
necessary to prevent inadvertently rolling down the steep incline.

Table 3. Muskox demographics from ground (road and sea) minimum count of Cape Atholl, July 2017.
                      Muskox demographics in Cape Atholl: Ground Count
     Classification                     Age                      Observed         Percentage
      Unknown                        1-2 years                       10             9.2 %
      Unknown                        ≥3-years                        15             13.8 %
         Calf                         < 1 year                       9              8.3 %
         Cow                           1-year                        2              1.8 %
         Cow                          2-years                        5              4.6 %
         Cow                          3-years                        3              2.8 %
         Cow                         ≥ 4-years                       19             17.4 %
         Bull                          1-year                        2              1.8 %
         Bull                         2-years                        8              7.3 %
         Bull                         3-years                        5              4.6 %
         Bull                         4-years                        5              4.6 %
         Bull                   ≥ 5-years (Trophy)                   26             23.8%
                                                  TOTAL             109             100 %
                                                                                    Ratio
                         Bull (≥ 5-yrs) / cow (age ≥ 3-yrs)   26 bulls: 22 cows     1.2: 1
  Recruitment (calves/100 cows (age ≥ 3-yrs)): Maximum        9 calves: 22 cows   40.9: 100
  Recruitment (calves/100 cows (age ≥ 3-yrs)): Minimum        9 calves: 29 cows   31.0: 100

                                                                                               21
77% (n = 84) of the muskoxen were successfully sexed and aged (Table 3). With age based on their body size, sex could not be determined for 15 animals (age ≥ 3 years) and 10 sub adults (age 1-2 years). Using only cows with known sex and age, the maximum mid-summer calf recruitment was roughly 41 calves per 100 cows. However, the bull to cow ratio suggests the possibility of seven cows among the 15 animals of unknown sex but age ≥ 3-years. This suggests a minimum calf recruitment of roughly 31 calves per 100 cows. Calf percentage was only 8.3% of the total number of observed muskoxen, while reproductively mature cows (i.e., age ≥ 3-years) were just 20.2%. Miscellaneous observations during ground count Observations of other species included 27 arctic hare, 8 arctic fox and 2 ringed seals (Pusa hispida). Mosquitoes were present, but the typically strong winds kept harassment level low. During the count period, weather conditions were generally unfavourable (storm force winds and rain) for travel, except for sunshine and light winds on 24 and 25 July. Regardless, the Cape Atholl area’s open vistas and low vegetation height aided sighting muskoxen over great distances. Generally, the muskoxen appeared somewhat disturbed by our presence, whether this was sailing by in a boat or driving past using a motorized vehicle. If on a slope, they moved up and away from their initial positions. If in open terrain near a road they moved away in the opposite direction. Distances moved ranged from only a few meters to ca. 0.5 km. On the extremely steep but vegetated slopes of the southern shoreline, one sub adult male (age 2-years) evidenced an injured right hind leg. No weight could be put on the limb, which made movement laborious on the steep incline. This sub-adult was closely accompanied by a cow. On the 26th of August 2017 the first incidence of natural mortality was observed. A muskox bull was found dead beside the road just east of North Mountain (Pituffik – Thule Air Base). The absence of any black colour at the horn tips, which were also blunt and rounded with wear, suggest that this animal was an old bull well past his prime. About three weeks later, a polar bear was scavenging the carcass (Appendix 6). 22
This 2017 study observed hoof hyperplasia (i.e., overgrown) on one muskox
(Appendix 7). The condition afflicted just one leg and hoof length was only
somewhat more than normal. Pituffik – Thule Air Base staff has reported few
if any observations of hoof hyperplasia in recent years.

Figure 8. Location and size of muskox groups observed during the aerial survey of Cape Atholl area, 14
September 2017. A total of 212 muskoxen were observed.

Aerial fixed-wing minimum count September 2017
From the fixed-wing aircraft we observed 41 groups of muskoxen, for a total
of 212 animals (Fig. 8, Table 4). This included 21 calves (born spring 2017, age
< 1-year). Calves made up ca. 10% of all animals, however, this rough value
may be low because the presence or absence of calves was not always possible
to ascertain. Average group size was 5.2 ± 5.2 StDev. Maximum group size
was 22 and occurred at the mouth of the Maniiseqqat (Green Valley).

The majority, 80% (n=169), of all the muskoxen observed were in the southern
half of the Cape Atholl area, albeit many were approaching the ½-way point
between the north and the south. The remaining 20% (n= 43) of all muskoxen
observed were in the northern portion of the area. These included the same
three mixed sex and age groups observed earlier in the ground (road and sea)
count (i.e., the groups containing 6, 12 and 18 muskoxen), while three of the
ground count’s lone bulls appeared to have become a group of three. For the
northern Cape Atholl area, the aerial count observed three more muskoxen
than the ground count, specifically a group of two and a lone adult.

                                                                                                   23
Table 4. Aerial minimum count results for muskoxen of Cape Atholl, 14 September 2017.
Parameter Muskoxen Survey of Cape Atholl
Continuous survey line distance 300 km
Survey line width 1 km (2x 500m)
Cape Atholl area 880 km2
Approximate surveyed area 300 km2
Survey coverage 34%
Aircraft altitude 300-500 m
Air Speed 175 km/hour
Number of muskox groups observed 41
Total muskoxen observed 212
Observed calves among total1 21
Rough calf percentage1 9.9 %
Average group size 5.17 ± 5.2 StDev
Median group size 3
Maximum group size 22
Minimum group size 1
1
Presence or absence of calves could not be ascertained with certainty for 12 of the 41 groups (Appendix 5, Table 6). Thus, the
calf percentage is approximate and may be lower than the true value.
Weather conditions deteriorated as the aerial survey progressed, specifically
while attempting to survey the ca. 25 km southern shoreline between
Kangaarsuk and the Pituffik Glacier. Specifically, strong gusting winds
prohibited flying low over the shore cliffs between Kangaarsuk and Cape
Atholl. Additionally, snow began to fall, which obscured visibility,
specifically when combined with the higher altitudes flown. The result was
reduced observer ability to detect muskoxen that may have been present on
the slopes of the southern shoreline.
Discussion
Muskox distribution and abundance
Although 43 muskoxen were observed in the northern half of the area, the
2017 results illustrate that most of the muskox population continue to remain
concentrated in the valleys and lowlands of the southern half of the Cape
Atholl area. Nevertheless, the 2017 count documented northward expansion
and hunter observation revealed at least one lone bull had managed to cross
the barrier that is the Pituffik glacier, since it was on the southeast side near
the village of Savissivik. This 2017 distribution suggests that even at this
study’s count of 212 muskoxen, the muskox population of Cape Atholl is
expanding its range. Range expansion can be a mechanism to counteract
overpopulation on initial range area.
24In 2017 we completed both an aerial and a ground (road and sea) count. The
ground count covered ca. 14% of the Cape Atholl area (total ca. 880 km2),
while the aerial coverage was more than double at 34%. This difference was
reflected in the number of muskoxen observed. The ground count observed
109 muskoxen, while the aerial count had almost double at 212. The aerial
results suggest a muskox density of 0.2/km2 for the entire Cape Atholl area.
On any count some animals are always overlooked. Muskox detectability at
the time an area is counted can be affected by several factors, including
weather. During the aerial count of 2017, sometimes blowing snow obscured
visibility while strong winds prevented low altitude flying over the best
muskox habitat (southern shore of Cape Atholl area. It is likely that some of
muskoxen were not detected. Thus, the 2017 aerial minimum count result, 212
muskoxen, likely missed animals present along the route flown. With its
lower total number of muskoxen observed relative to the aerial effort, the
ground (road and sea) count obviously missed muskoxen that were otherwise
present in the Cape Atholl area. During the sea count unusual circumstances
somewhat explain the fewer ground count observations. When we sailed the
coast on 24 July, the number of muskoxen observed (n=68) amongst the little
auk colonies of the southern shoreline was low. We sailed that coast in the
evening, unaware that earlier that same day two research ornithologists from
Aarhus University, Denmark, had sailed the same shoreline and gone ashore
into all the main valleys to complete field work. To protect themselves from
possible muskox attacks they had deliberately scared the muskoxen out of
those valleys (Mosbech pers. comm.). Understandably, few muskoxen
remained when we counted those valleys that evening. The above, however,
does not fully explain the 103 fewer muskoxen observed during ground
efforts. Clearly, owing to greater coverage and increased animal detections,
aerial counts are superior to ground counts.
Until 2012 there had been no specific effort to count muskoxen in the Cape
Atholl area. Any observations were anecdotal, often limited to just the
Maniiseqqat and/or Narsaarsuk valleys, and not unexpectedly muskox
numbers were modest (Table 1). Since re-introduction of muskoxen to the
area in 1986, there have been four aerial minimum counts. The first two, 2012
and 2013, were systematic observations of muskoxen made during aerial
survey dedicated to detecting land-locked polar bears. These, however, did
not cover the entire Cape Atholl area. The third and fourth, 2015 and 2017
(this study), were aerial counts specific for muskoxen, covered the Cape
25Atholl area, and document the minimum number of muskoxen in Cape Atholl. The 2015 aerial count observed 276 muskoxen, which was the largest observed number to date and documented population growth since release of seven muskoxen almost 30 years earlier. The 2017 aerial count observed 212, which is 64 fewer muskoxen than in 2015. Considering only the 25 km stretch of prime habitat on the southern coast, the 2017 result was 79 observed muskoxen, which contrasts sharply with the 118 muskoxen observed along the same shoreline in the 2015 aerial count. The adverse weather conditions, which created difficult conditions for detection of muskoxen during the 2017 aerial count, may have resulted in an artificially low number of muskoxen observed. Alternatively, perhaps the increased harvest quotas since 2015 (recommended by Cuyler et al. (2016)) had succeeded in halting population growth. Certainly, the 2017 count suggests possible decline in population size but with just two counts for comparison that conclusion is debatable. Calf production The calf percentage from the aerial count is acknowledged rough and likely lower than the actual value, since calves can easily remain undetected during such a survey. Regardless, even if a few percentage points are added the value would still be considered low relative to previous values. Further, the accurate ground count calf percentage, 8.3%, indicates the aerial value is reasonable. In 2017, we observed that 2-year-olds were ca. 16.5% of all muskoxen observed (Table 3), which is only marginally lower than the percentage observed for this cohort two years previous, i.e., 17.4% calves in 2015 (Cuyler et al. 2016) and indicates low mortality. In contrast, the percentages for yearlings (born 2016) and 2017 calves were exceptionally low, i.e., yearlings ca. 8.2% and calves 8-10% (Tables 3, 4). The poor values suggest either high natural calf mortality or low calf production. Regarding mortality, large predators are not assumed a major factor causing calf mortality because these are normally absent from the Cape Atholl area. In 2017, a polar bear was observed scavenging an adult muskox carcass (Appendix 6). Although polar bear predation of muskoxen is rare, predation events by adult bears on typically lone adult bulls have been recorded in North America (Tener 1965) and Greenland (Thing 1984). In 2015, a dead calf was found on the beach at Maniiseqqat (Green Valley) and predation by polar 26
bear was suggested since bears were regular visitors to the Maniiseqqat
(Torbjørn Jørgensen pers. comm.).

It is well known that occasional Greenland sled dogs occur running loose near
the Pituffik – Thule Air Base (Kasim Virk pers. comm.). Regarding wolves, for
the past 30 years, none have been observed or shot in the Cape Atholl area
(Kasim Virk pers. comm.). Of course, if wolves were present in the Cape
Atholl area that might help explain the low 2017 calf percentage. Regardless,
their presence has not yet been documented. Still, it is worth mentioning that
polar wolves inhabit Ellesmere Island (Canada) and Washington Land and
Hall Land (northwest Greenland) (Dalerum et al. 2018). Ellesmere Island is ca.
275 km west from Cape Atholl, and while both the latter are also in northwest
Greenland, they are about 400 and 600 km north of the Cape Atholl area.
Closer and in 2008, the Greenland Government received word from
Siorapaluk hunters that wolves were observed north of the village in
Inglefield Land (Charlotte Bülow pers. comm.), which is about 200 km north
of the Cape Atholl area. Further, in the recent past, at least two wolves have
been shot by local hunters in Prudhoe Land, just over 100 km north of the
Cape Atholl area. The first in May 2014 by a hunter from the hamlet, Qeqertat,
and the second in September 2015 by a hunter from the village, Qaanaaq
(Qillaq Danielsen pers. comm.). By 2015, Qaanaaq residents felt wolves were
becoming increasingly common in their area and assumed the wolves were
arriving from either Canada’s Ellesmere Island or moving south from
Washington Land (Paviaraq Jakobsen pers. comm.). With wolves present to
the north, there is clearly the potential for them to move south into the Cape
Atholl area in the future. Nevertheless, a substantial obstacle, to this potential
range expansion by polar wolves, is the Government of Greenland’s
Executive Order No. 33 of 11 September 2020 (Selvstyret 2020), which permits
commercial hunters unlimited hunting of polar wolves, year-round, in the
Qaanaaq wildlife management area (Inglefield- and Prudhoe Land). To date,
the presence of wolves has yet to be confirmed for the Cape Atholl area.

For the present, mortality causes also include weather events e.g., survival of
muskox calves in Alaska and Norway is negatively correlated with spring
snow depth (Reynolds 1998, Asbjørn et al. 2005). Observations by locals at
Pituffik – Thule Air Base indicate that the winter 2016/2017 included greater
than normal snow depth and that spring snowmelt arrived late in 2017.
During the ground count period, 24 July – 06 August, much snow remained in
patches even at sea level, although low elevation terrain was almost

                                                                               27
completely snow-free. Mortality due to weather may have affected the 2016 and 2017 cohorts. Additionally, low calf production may be responsible for the low percentages of calves and yearlings in 2017. Calf production and survival is highly correlated with cow body condition (Cuyler et al. 2022) and the hard winter and late spring of 2017 may have negatively affected cow body condition. Poor cow body condition negatively impacts pregnancy rate, calf birth weight, and milk production (Adamczewski & Flood 1997, White et al. 1997, Adamczewski et al. 1998). Overall calf production also depends on the number of sexually mature cows, and from the ground count mature cows only accounted for 20.2% of the observations. Regardless, given the number of cows observed, autumn calf recruitment was a poor 31-41 calves per 100 cows. There were just 8-10% calves in 2017. Regardless of what factors are responsible that value may be enough to support stability since the eastern Greenland muskox population was assumed stable in the period 1982-1994 and 10.5% calves were observed in 1994 (Born et al. 1995). 8-10% calves are, however, likely too low to support growth in the muskox population of Cape Atholl. Given large predators are generally absent from the Cape Atholl area, natural mortality (harvest not included) among muskox adults may be similar to North American caribou populations without predators, i.e., from 4 to 8% (Bergerud 1967, 1971, Skoog 1968, Kelsall 1968, Heard & Ouellet 1994). This suggests the 2017 calf percentage was roughly equivalent to adult mortality making population growth improbable. Additionally, and again regarding caribou, when calf percentages fall below ca. 14% then population decline is inevitable (Bergerud et al. 2008). Further, and for North American muskox populations, calf percentages of 17-24% may be necessary to facilitate population growth (Jingfors & Klein 1982, Gunn et al. 1984). If the low 2017 calf percentage continues unchanged then population decline is possible for muskoxen in Cape Atholl. Habitat and forage Muskoxen generally forage in low lying valleys and coastal areas (Nellemann & Reynolds 1997, Nellemann 2011, Anderson & Fergusen 2016). Optimal muskox habitat is generally below 200 m elevation, while below 100 m elevation supports the highest densities of muskoxen (Thomas et al. 1981). The Cape Atholl area is just 880 km2 and its high latitude at ca. 76°N, means 28
forage decreases rapidly with rising elevation (Körner 2007). Unfortunately,
regarding forage for muskoxen of Cape Atholl, 77% of the area is above 200 m
elevation, with just 202 km2 below 200 m. Compensating for lack of lowlands
is the presence of the little auk. The Thule district of Northwest Greenland is
this small seabird’s most important breeding area for the North Atlantic, with
ca. 33 million pairs that nest in huge colonies (Boertmann & Mosbech 1998;
Egevang et al. 2003). While most colonies are in scree slopes along the
seacoast, in some areas breeding colonies can extend up to 11 km inland
(Mosbech et al. 2018). Large colonies occur along the steep slopes and valleys
of the Cape Atholl area’s 25 km long southern coast (Boertmann & Mosbech
1998). The NDVI, which quantifies vegetation greenness, within 600 m of a
little auk colony is well above average owing to guano deposition, which
causes vegetation hotspots (Mosbech et al. 2018). Not unexpectedly since re-
introduction in 1986 most of the muskox population forages the slopes and
valleys close to little auk breeding colonies (Burnham 1996). The area that is
both below 200 m elevation and associated with little auk breeding colonies is,
however, only about 44 km2, or 5% of the Cape Atholl area.

Year-round grazing and trampling since 1986 combined with the 2015-2017
population size of a minimum 212–276 muskoxen suggest declining habitat
quality is possible, e.g., overall quantity of food available. Three observations
support the likelihood of reduced forage. First, the 2017 observations of
muskoxen for the first time grazing near the tops of extremely steep slopes on
the southern coast. Secondly, the 2017 numerous muskox groups located far
north of the little auk breeding colonies of the southern coast, despite
abundance not being greater than in 2015. Finally, the low percentage of
calves and yearlings in 2017. Already by 2015, Pituffik – Thule Air Base staff
reported lowland vegetation (willows) damaged by muskoxen, while visiting
raptor scientists noted muskoxen had torn-up the tundra alongside streams
and rivers (Cuyler et al. 2016). The latter may be what Mosbech et al. (2018)
documented, i.e., areas of exposed soil at the base of steep hillsides under
little auk colonies caused by muskoxen rubbing their bodies against the
incline. Given the Cape Atholl area’s otherwise low NDVI (Mosbech et al.
2018, Appendix 3), the 212 muskoxen observed in 2017 may be too many for
the limited area (44 km2) of good forage associated with little auk breeding
colonies. Albeit colonies are extensive on the southern coast, and guano is
deposited anew annually, the vegetation hot spots around little auk colonies
are not limitless.

                                                                               29
Movement is a fourth indicator of reduced food resources relative to the number of herbivores on a range, and often leads to greater movement in search of forage. The expanded muskox distribution observed in 2017 supports decreased food quantity. Recent increased muskox movement is also supported by the current lack of what was once almost universal hoof hyperplasia in the 1990’s. In the 1990’s the muskoxen were described as unmoving and feeding in the lush vegetation under little auk breeding colonies (Burnham 1996). At that time, hoof hyperplasia was endemic throughout the muskox population of Cape Atholl, with lack of movement and too rich a diet among the probable causes (Cuyler & Mølgaard 2002). In 2017, however, only one muskox, a bull, was observed with the condition, which involved a single hoof and overgrowth was slight (Appendix 7, Fig. 40) relative to the excessive hoof lengths observed in the 1990s (Cuyler & Mølgaard 2002). This indicates the cause of the single 2017 case was pathogenic rather than genetic, dietary, or owing to lack of movement. Today’s normal hoof lengths suggest greater muskox movement and a diet less rich than previously. The latter is supported by the hyperplastic bull’s advanced incisor tooth wear, despite being relatively young (age 5-6 years). This contrasts sharply with the 1998 total absence of incisor tooth wear regardless of age (maximum 13-years) in 14 sampled muskoxen (Cuyler & Mølgaard 2002). Thus, albeit just one animal, the bull’s worn-down incisors indicate a diet of poor browse, which may be affecting others in the population as well. Muskox density The 2015 and 2017 counts indicate presence of at least 212 to 276 muskoxen, which suggests a density range of 0.2-0.3 muskox/km2 for the entire 880 km2 Cape Atholl area. However, only 5% (44 km2) is lowlands associated with little auk colonies, which provide forage hot spots for muskoxen. Not surprisingly, below little auk colonies, group sizes are double that of elsewhere on Cape Atholl and adult muskox density may be as high as 3.9/km2 (Mosbech et al 2018). Indeed, given the 212 muskoxen observed in 2017, density at the hot spots might be ca. 4.8/km2. This exceeds best estimate for high Arctic muskox stocking density, i.e., 1-2 muskoxen/km2 for year- round foraging on good lowland habitat where winters are not too severe (Thomas et al. 1981); however, this was not referring to excellent habitat under bird colonies. Still, muskoxen prefer to forage anywhere that elevations are < 200 m, although for Cape Atholl green vegetation is sparce beyond the little auk breeding colonies (Appendix 1, 3). For Cape Atholl, elevations
You can also read