15E - Nevada Department of Wildlife
←
→
Page content transcription
If your browser does not render page correctly, please read the page content below
15E

NBWC November 2018   Page 1 of 2
NBWC November 2018 Page 2 of 2
Nevada Department of Wildlife
     Predation Management Status Report
                     Fiscal Year 2018

NBWC November 2018
State of Nevada
                                            Brian Sandoval, Governor

                                      Department of Wildlife
                                               Tony Wasley, Director

                                                Game Division
                                             Brian F. Wakeling, Chief

                                         Board of Wildlife Commissioners

           Brad Johnston, Chairman ................................................................Yerington
           Paul E. Valentine, Vice Chairman ................................................ Henderson
           Jon Almberg ................................................................................. Ely
           Tom Barnes ......................................................................................Elko
           Tiffany East......................................................................................Reno
           Kerstan Hubbs ..................................................................................Henderson
           David McNinch ................................................................................Reno
           Tommy Caviglia ..............................................................................Henderson
           Casey D. Kiel ...................................................................................Lovelock

 Persons are free to use material in this report for educational or informational purposes. However, since most reports are
 part of continuing studies, persons intending to use this material in scientific publications should obtain prior permission from
 the Department of Wildlife. In all cases, tentative conclusions should be identified as such in quotation, and due credit would
 be appreciated. This publication will be made available in an alternative format upon request.

 The Nevada Department of Wildlife receives funds from Federal Aid in Fish and Wildlife Restoration Acts. Federal laws
 prohibit discrimination on the basis of race, color, national origin, age, disability and sex. Individuals with hearing
 impairments may contact the Department at (775) 688-1500 via a text telephone (TTY) telecommunications device by first
 calling the State of Nevada Relay Operator at 1-800-326-6868. If you believe you’ve been discriminated against in any NDOW
 program, activity, or facility, please write to the following:

               Diversity Program Manager                           Director
               U.S. Fish and Wildlife Service                      Nevada Department of Wildlife
               4401 N. Fairfax Drive, MS: 7072-43                  6980 Sierra Parkway, Suite 120
               Arlington, Virginia 22203                           Reno, Nevada 89511

NBWC November 2018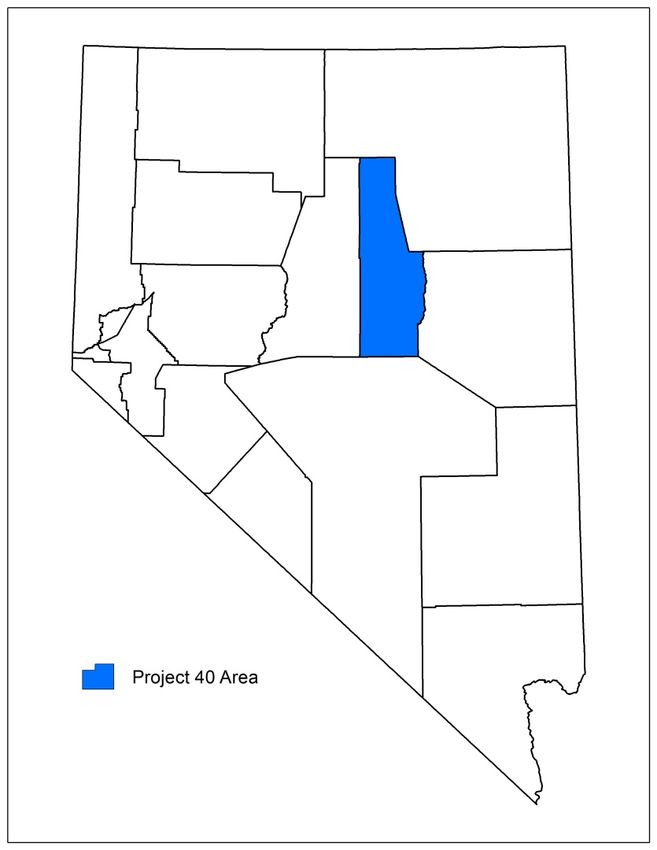
Table of Contents

Executive Summary........................................................................................................................ 2
Project 21: Greater Sage-grouse Protection (Common Raven Removal)....................................... 3
Project 21-02: Common Raven Removal to Enhance Greater Sage-grouse Nest Success ............ 5
Project 22-01: Mountain Lion Removal to Protect California Bighorn Sheep............................... 7
Project 22-074: Monitor Rocky Mountain Bighorn Sheep for Mountain Lion Predation.............. 8
Project 32: Mountain Lion, Black Bear and Mule Deer Interactions ............................................. 9
Project 37: Big Game Protection-Mountain Lions ....................................................................... 10
Project 38: Big Game Protection-Coyotes .................................................................................... 11
Project 40: Coyote Removal to Complement Multi-faceted Management in Eureka County ..... 12
Project 41: Increasing Understanding of Common Raven Densities and Space Use in Nevada.. 17
Project 42: Assessing Mountain Lion Harvest in Nevada ............................................................ 22
Project 43: Mesopredator Removal to Protect Waterfowl, Turkeys, and Pheasants on Wildlife
Management Areas ....................................................................................................................... 23
Overall Budget and Expenditures for FY 2018 ............................................................................ 24
Literature Cited ............................................................................................................................. 25
Appendix ....................................................................................................................................... 26

NBWC November 2018
Executive Summary
The goal of the Nevada Department of Wildlife’s (NDOW’s) Predator Management Program is to
conduct projects consistent with the terrestrial portion of NDOW’s Mission “to preserve, protect,
manage, and restore wildlife and its habitat for the aesthetic, scientific, educational, recreational,
and economic benefits to citizens of Nevada and the United States.” Provisions outlined in NRS
502.253 authorize the collection of a $3 fee for each big game tag application, deposition of the
revenue from such a fee collection into the Wildlife Fund Account, and use by NDOW to 1)
develop and implement an annual program for the management and control of predatory wildlife,
2) conduct wildlife management activities relating to the protection of nonpredatory game animals
and sensitive wildlife species, and 3) conduct research necessary to determine successful
techniques for managing and controlling predatory wildlife. This statute also allows for: the
expenditure of a portion of the money collected to enable the State Department of Agriculture and
other contractors and grantees to develop and carry out programs designed as described above;
developing and conducting predator management activities under the guidance of the Nevada
Board of Wildlife Commissioners; and provide that unspent monies remain in the Wildlife Fund
Account and do not revert to State General Funds at the end of any fiscal year.
NDOW maintains a philosophy that predator management is a tool to be applied deliberately and
strategically. Predator management may include lethal removal of predators or corvids, non-lethal
management of predator or corvid populations, habitat management to promote more robust prey
populations which are better able to sustain predation, monitoring and modeling select predator
populations, managing for healthy predator populations, and public education, although not all of
these aspects are currently eligible for funding through predator fee dollars. NDOW intends to use
predator management on a case-by-case basis, with clear goals, and based on an objective scientific
analysis of available data. To be effective, predator management should be applied with proper
intensity and at a focused scale. Equally important, when possible projects should be monitored to
determine whether desired results are achieved. This approach is supported by the scientific
literature on predation management. NDOW is committed to using all available tools and the most
up-to-date science, including strategic use of predator management, to preserve our wildlife
heritage for the long term.
In FY 2018, 11 projects were included in the planned activities, with each project having
committed funding. Included in NDOW’s ongoing work is Greater sage-grouse protection (Project
21 and Project 21-02), bighorn sheep protection (Project 22-01, Project 22-074, and Project 37),
pronghorn protection (Project 38), mule deer protection (Project 40) and waterfowl, turkey,
and pheasant protection (Project 43).
Nevada Department of Wildlife spent $641,331 on lethal predator removal during FY 2018. This
accounted for 108% of FY 2016 revenues.
2
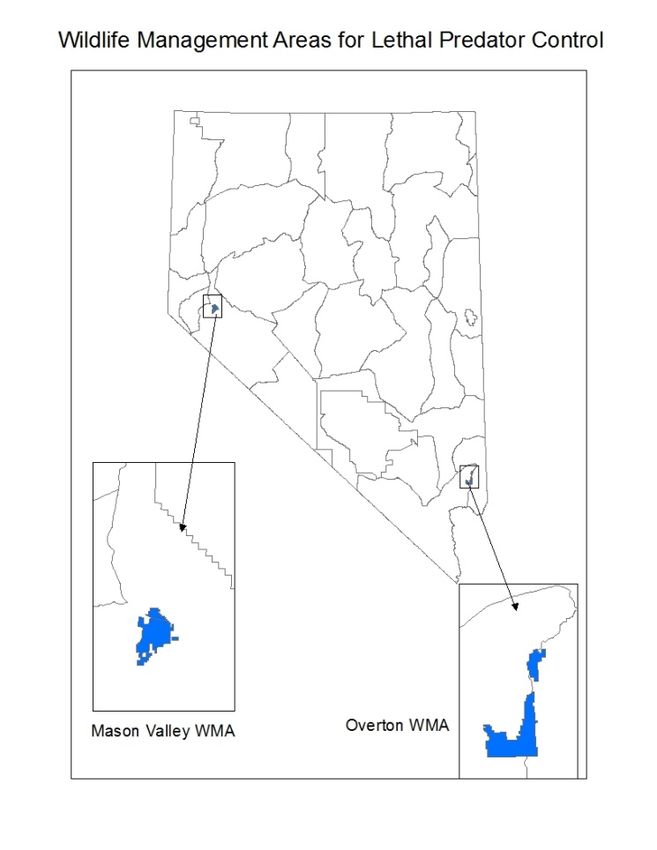
NBWC November 2018Project 21: Greater Sage-grouse Protection (Common Raven Removal)
Common raven (thereafter raven) control efforts to conserve Greater sage-grouse commenced in
early March and extended throughout June 2018. The objective of this project is to increase
Greater sage-grouse nest success and recruitment. USDA Wildlife Services (WS) performed
raven control work through the placement of corvicide (DCR-1339) injected chicken eggs within
occupied Greater sage-grouse habitats. The main treatment areas consisted of eastern and
northeastern Nevada in situations where concentrations of ravens have been noted and where
habitat has been compromised, potentially by wildfire or anthropogenic subsidies (e.g. landfills
and transfer stations). Another treatment area, the Virginia Mountains in western Nevada, is
being used as an experimental area and details of that project are reported below (Project 21-
02).
Through the efforts of USDA WS personnel, an estimated 2,381 ravens were removed during
spring 2018. The total number of ravens taken for Project 21, and Project 21-02 was 2,500,
which is the maximum that NDOW can remove under the current USFWS depredation permit
(#MB37116A-0). Ravens were removed in 11 game management areas during the spring of 2018
under Project 21 and Project 21-02.
Raven take by Management Area (MA) FY 2018.
Area Ravens Removed
MA 3 585
MA 6 101
MA 7 217
MA 8 86
MA 10 29
MA 11 39
MA 14 214
MA 15 354
MA 20 93
MA 22 291
MA 23 372
Total Ravens 2,381
3
NBWC November 2018Department Comments on Project
Raven management, including lethal removal, is imperative to maintain and improve Greater sage-
grouse and the ecosystems they depend on. NDOW recommends continuing Project 21 while
common ravens are believed to be a limiting factor for Greater sage-grouse.
$3 Planned P-R Planned Wildlife Services NDOW Lethal NDOW Non-Lethal NDOW Salary, Travel, and Total
Expenditures Expenditures Expenditures Expenditures Expenditures Office
$100,000 N/A $39,151 $0 $5,848 $12,816 $57,815
4
NBWC November 2018Project 21-02: Common Raven Removal to Enhance Greater Sage-grouse Nest Success
Work was initiated during March and extended throughout May 2018 to monitor the efficacy of
raven control on the resident Greater sage-grouse population within the Virginia Mountains,
located in southern Washoe County. Over a 2.5-month period, USDA WS deployed corvicide-
treated eggs within previously identified Greater sage-grouse nesting habitats located around
Sheep Springs, Spanish Flat, and lower Cottonwood Creek. An estimated 108 ravens were
removed during the spring months.
Greater sage-grouse monitoring work is being conducted by the USGS Western Ecological
Research Center. Seven years of baseline monitoring work have been conducted on this population
to determine various vital rates and vegetative parameters in used versus random sites across
multiple life phases. The information presented below provides summaries of the USGS field crew
efforts from March through July 2018.
USGS Report
RAVEN MONITORING AT VIRGINIA MOUNTAINS
Methods
- Raven point count surveys were performed at Virginia Mountains in association with sage-
grouse locations, nests, broods, and random locations
Results
- 176 surveys were conducted overall. 86 of these were independent random (IR) surveys
(49%) and 51 were sage-grouse nest surveys (29%).
- 62 ravens were visually observed at distances < 2000 m
- 48 ravens were visually observed at distances < 1125 m
- 5 double-blind surveys were conducted with 12 total ravens observed; double-blind surveys
count as 2 in the calculation below
- Raven index for density = # ravens/survey = 0.27 (overall)
o 0.36 (at independent random surveys)
o 0.16 (at nests)
Synthesis
- Raven density appeared to remain relatively low at this site, compared to some previous
years (0.5–0.96 ravens/survey; 2009–2011). Numbers are more similar compared to recent
years, though raven density may have increased slightly (0.15–0.20 ravens/survey; 2013–
2016).
- Raven numbers appeared to be higher at random locations (0.36) than nest locations (0.16)
Department Comments on Project
The area experienced an unplanned, large scale fire in 2017. To better understand the effects of
the fire and raven removal on sage-grouse populations, NDOW supports continuing this project
through FY 2020.
5
NBWC November 2018$3 Planned P-R Planned Wildlife Services NDOW Lethal NDOW Non-Lethal NDOW Salary, Travel, and Total
Expenditures Expenditures Expenditures Expenditures Expenditures Office
$25,000 N/A $16,695 $0 $0 $12,816 $29,511
6
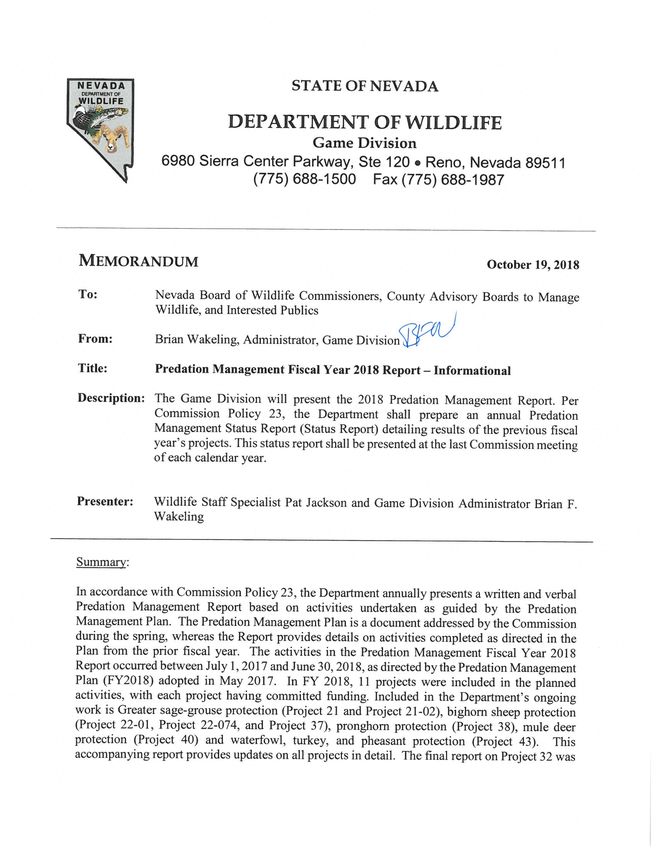
NBWC November 2018Project 22-01: Mountain Lion Removal to Protect California Bighorn Sheep
Attempts have been made to establish a California bighorn sheep population in Area 01.
Substantial mountain lion-induced mortality has been observed. California bighorn sheep
populations may require a reduction in mountain lion densities to reach population viability.
Between July 1, 2017 and June 30, 2018, 7 mountain lions were removed by USDA WS in Unit
011 and 3 mountain lions were removed in Unit 013. Mountain lion removal efforts were made by
a private contractor in Unit 011, 3 mountain lions were removed. The private contractor submitted
the Annual Predator Management Project Reporting Form (Appendix).
Five GPS collars were deployed ion bighorn sheep in Unit 011, and other 5 in Unit 013 during FY
2018.
Department Comments on Project
NDOW supports continuing Project 22-01 until the local bighorn sheep populations reach viability
as defined in the annual Predator Plan.
$3 Planned P-R Planned Wildlife Services NDOW Lethal NDOW Non-Lethal NDOW Salary, Travel, and Total
Expenditures Expenditures Expenditures Expenditures Expenditures Office
$90,000 N/A $95,341 $27,800 $0 $12,816 $135,957
7
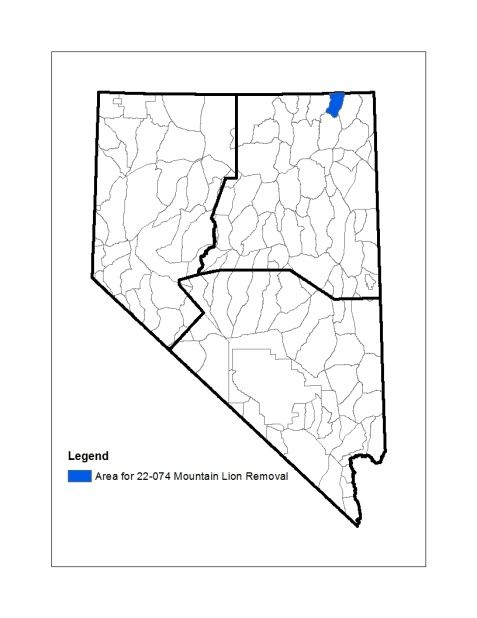
NBWC November 2018Project 22-074: Monitor Rocky Mountain Bighorn Sheep for Mountain Lion Predation
Unit 074 Rocky Mountain bighorn sheep herd experienced a die-off in 1999. Two years following
the die-off, the lamb recruitment was low, remaining consistent with typical bighorn sheep die-
offs. Since then the average lamb recruitment has been 48 lambs:100 ewes. This level of
recruitment should have resulted in an increasing bighorn sheep herd; however the population
rebound has not occurred.
The Contact Area is a major deer winter range. It is possible that mountain lions following the deer
herd from summer range in the Jarbidge Mountains to winter range switch their diet to bighorn
sheep when deer return to their summer range. Some mountain lions may be staying in the area on
a yearlong basis with their primary food source being Rocky Mountain bighorn sheep.
No mountain lion removal efforts were conducted during FY 2018.
Bighorn Sheep Herd Health (Biologist III Kari Huebner)
On October 17, 2017 26 bighorn were classified in the Contact herd. Observations included 12
ewes (3 yearlings), 3 lambs, and 11 rams (3 yearlings). On October 26, 2017, five additional
bighorn (4 ewes and 1 ram) were collared to determine if there are any mountain lion related
predation events. The population is most likely between 25-30 sheep. Recruitment remains low,
but improving. No known mountain lion mortalities have been observed since FY 2016.
Department Comments on Project
NDOW supports continuing Project 22-074 until the local bighorn sheep reaches population
viability as defined in the annual Predator Plan.
$3 Planned P-R Planned Wildlife Services NDOW Lethal NDOW Non-Lethal NDOW Salary, Travel, and Total
Expenditures Expenditures Expenditures Expenditures Expenditures Office
$90,000 N/A $0 $0 $4,900 $12,816 $17,716
8
NBWC November 2018Project 32: Mountain Lion, Black Bear and Mule Deer Interactions
NDOW technicians collected kill site data on 6 mountain lions, and visited 126 kill sites. The
Wildlife Conservation Society (WCS) did not provide an annual report by the date of this report
preparation as the contractor on the project, but WCS will provide a final report for FY 2018
because the project is being discontinued. Peer-reviewed publications are expected.
$3 Planned P-R Planned Wildlife Services NDOW Lethal NDOW Non-Lethal NDOW Salary, Travel, and Total
Expenditures Expenditures Expenditures Expenditures Expenditures Office
$40,000 $120,000 $0 $0 $80,274 $12,816 $93,090
Department Comments on Project
End Project 32. Begin a project, passive in nature, to estimate the black bear population throughout
the inhabited portions of Nevada.
9
NBWC November 2018Project 37: Big Game Protection-Mountain Lions
In some circumstances, culling of top predators is beneficial for protection of newly translocated
big-game populations, small and isolated big-game populations, or big-game populations held
below carrying capacity by predation (Hayes et al. 2003, Rominger et al. 2004, McKinney et al.
2006). The geographic range of mountain lions is larger than any big-game mammal in North and
South America (Logan and Sweanor 2000), and specific areas may benefit from removal efforts
that may target more than a single mountain lion.
USDA Wildlife services removed 4 mountain lions under this project, 3 in Unit 252 and 1 in Unit
041. A private contractor lethally removed 1 mountain lion from the Jackson Mountains and
another 2 mountain lions in the Delamar Mountains. Another private contractor removed 5 in the
Snowstorm Mountains. The Annual Predator Management Project Reporting Forms for Project 37
may be found in the Appendix of this document.
Five GPS collars were purchased to deploy on mountain lions in areas surrounding the Delamar
Range. 6 GPS collars were deployed by a private contractor. These data will increase
understanding of mountain lion space use and prey selection, allowing for more efficient future
lethal removal.
Department Comments on Project
NDOW supports continuing Project 37 until local bighorn sheep populations become viable as
defined in the annual Predator Report. NDOW supports the ability to remove mountain lions
quickly.
$3 Planned P-R Planned Wildlife Services NDOW Lethal NDOW Non-Lethal NDOW Salary, Travel, and Total
Expenditures Expenditures Expenditures Expenditures Expenditures Office
$175,000 N/A $40,932 $134,285 $21,627 $12,816 $209,660
10
NBWC November 2018Project 38: Big Game Protection-Coyotes
Coyotes face an increase in caloric need when raising pups, both through an increase in parent
energetic output and feeding growing pups (Till and Knowlton 1983, Sacks et al. 1999, Seidler et
al. 2014). Parent coyotes and their pups may consume a drastically different diet than their non-
parent counterparts at the same time of year; this difference in diet likely requires larger prey,
including mule deer fawns. Removing coyotes may increase mule deer fawn and other wildlife
species reproductive output.
Upon approval of Project 38, game biologists with pronghorn management responsibilities were
asked whether or not their pronghorn herds may be underperforming due to coyote predation.
Areas where predation by coyotes could be a factor limiting pronghorn populations received
removal efforts from USDA WS. From March through June USDA WS conducted coyote removal,
primarily with helicopter for the benefit of pronghorn. Two hundred thirty-nine coyotes were
removed.
Area Coyotes Removed
MA 7 74
MA 10 18
MA 16 54
MA 20 17
MA 22 5
MA 23 71
Total 239
Department Comments on Project
NDOW supports continuing Project 38 pending available funding.
$3 Planned P-R Planned Wildlife Services NDOW Lethal NDOW Non-Lethal NDOW Salary, Travel, and Total
Expenditures Expenditures Expenditures Expenditures Expenditures Office
$125,000 N/A $133,720 $0 $0 $12,816 $146,536
11
NBWC November 2018Project 40: Coyote Removal to Complement Multi-faceted Management in Eureka County
Mule deer populations in Diamond Mountains in Eureka County are believed to be
underperforming due to competition with feral equids, pinyon-juniper expansion, and predation.
To alleviate pressure on resources, the BLM conducted a feral horse round-up in the Diamond
Mountains in January 2013, removing 792 horses. Eureka County and the Eureka County Advisory
Board to Manage Wildlife directed the removal of pinyon and juniper trees on private range lands
in the Diamonds and Roberts Mountains in 2008, 2009, and 2011. USDA WS removed coyotes in
the area in 2011 and 2012. A private contractor removed coyotes in 2014. On-going removal of
coyotes may assist mule deer population recovery.
From July 2017 until June 2018 USDA WS conducted aerial gunning and trapping of coyotes in
Area 14, removing 319 coyotes and 5 mountain lions.
NDOW had a contractor conduct 3 Forward Looking Infrared (FLIR) surveys (1 in FY 2017, 2 in
FY 2018). The purpose of these surveys was to located collared mule deer does, and determine
the presence/absence of fawns. Preliminary results suggest this is a viable method to accurately
and quickly monitor and estimate mule deer fawn survival during the first 3 months of a mule deer
fawn’s life.
144 Deer Herd Health (Biologist III Clint Garrett)
This project takes place mainly in the Diamond Range (hunt unit 144) within
management area 14 (MA14: 141–145) and contains the majority of the mule deer for this hunt
unit grouping. The project focus is on deer wintering and fawning grounds to reduce the effects
of potentially high concentrations of coyotes that may be suppressing mule deer below carrying
capacity. The project response variable stated within the NDOW predator plan uses spring
fawn:adult ratios of 50:100 or higher for 3 consecutive years in hunt unit 144 before the project
will be altered or discontinued. Other potentially affected game species within the project area
include sage grouse and although no response variable is identified within the predator plan for
sage grouse, the table below lists peak male attendance for the Diamond population management
unit (PMU). Along with coyote removal Wildlife Services also actively pursues and removes
mountain lions from the project area.
Deer were collared in January 2017 (10 collars) and 2018 (3 collars) to help understand
the connectivity between the 144 hunt unit and surrounding hunt units. This collaring effort has
given us a better understanding of limiting factors and seasonal use patterns of the deer herd
within the Diamond Range. To date there have been 7 of the 13 collared does killed by mountain
lions within the Diamond’s which have occurred in varied locations and times of the year.
Current deer modeling is done for MA14 as a whole. For MA14: The September
populations levels where at a high in 1985 (9,300) and a low in 1976 (3,100). The 2018 spring
survey of 39 fawns:100 adults is slightly above the previous 5-year average of 38 fawns:100
adults. The previous 5-year population estimate (2013–2017) is 4,100 deer with the 2017 and
2018 estimates being 4,400 and 4,500 respectively showing an increase in population and a slight
12
NBWC November 2018increase in fawn recruitment. The tables and charts below give numbers for MA14, Unit 144 and
the Diamond PMU.
% Fawn Loss WS Total Removed
Deer HU HU HU June Removal
Survey Year 144 144 144 Thru Season
Fawns Adults Fawn/Adult Spring Sept.
HU MA Coyotes Mt.
Ratio Precip.
144 14 Lions
Lowest Ratio 109 621 18/100 4.4 41% 43% - - ?
Spring 2008
Highest Ratio 375 544 69/100 6.2 18% 12% - - -
Spring 1978
+
Spring 2011 291 861 34/100 1.7 NFS 23% 189 0 FY11
Spring 2012 255 574 44/100 2.6 0% 11% *203 0 FY12
Spring 2013 217 652 33/100 3.4 21% 18% 0 0 No NDOW/WS Removal
Spring 2014 333 877 38/100 3.1 1% 3% 0 0 No NDOW/WS Removal
+
Spring 2015 369 876 42/100 3.8 NFS 14% 0 0 No NDOW/WS Removal
+
Spring 2016 384 1,050 37/100 2.8 NFS 23% 516 0 FY16
Spring 2017 435 1,086 40/100 2.9 0% 10% 528 1 FY17
Spring 2018 422 1,111 38/100 3.7 0% 7% 319 5 FY18
+
No fall surveys (NFS) were conducted in 2014 or 2015 for MA14. Fawn loss could not be calculated for hunt unit 144 individually.
Survey/model information goes back to 1974 for MA14 but 1977 – 1978 was the first year a representative survey size was observed.
* Coyote removal was conducted prior to Project 40 implementation – NA4W 10-26: Eureka County and Project 22 Unit 144.
Coyote and Lion removal information is obtained from Nevada USDA-APHIS-WS
Precipitation information is obtained from https://wrcc.dri.edu Eureka, NV
13
NBWC November 2018FY 2011 to FY 2018 Coyote Removal MA14
80 600
Total Coyotes Removed
70
500
Fawn:100 Adults
60
400
50
40 300
30
200
20
100
10
6.2 4.4 1.7 2.6 3.4 3.1 3.8 2.8 2.9 3.7
0 0
1978 2008 2011 2012 2013 2014 2015 2016 2017 2018
High Low
Prior Yr. June - Sept Precip " Spring Fawn:Adult Ratio
Coyote Removal Linear (Prior Yr. June - Sept Precip ")
Linear (Spring Fawn:Adult Ratio)
Diamond PMU - Individual Complex
Sage Grouse West East PMU Total
Survey year Diamond Diamond South Newark Antelope Newark Totals Sites
Valley Valley Eureka Summit Valley Valley Visited
Low 0 10 0 6 0 0 0 0
Spring Count (1967)-4 (2002)-2 (00/01)-2 (2001)-1 (9 yrs.)-1 (1957)-4 (1967)-4 (6 yrs.)-0
(yr)-# Sites
1955-2018
High 21 102 28 61 23 104 156 132
Spring Count (2012)-1 (1979)-1 (2015)-2 (2015)-4 (1985)-1 (2000)-6 (2015)-12 (2018)-27
(yr)-# Sites
1955-2018
Spring 2011 11 15 NS NS 0 32 58 10
Spring 2012 21 15 1 28 NS 32 96 12
Spring 2013 11 19 0 38 0 26 94 18
Spring 2014 3 46 18 NS NS 25 92 8
Spring 2015 12 35 28 61 NS 20 156 12
Spring 2016 7 42 NS NS 0 16 65 6
Spring 2017 5 *54 19 *32 0 27 137 26
Spring 2018 3 *29 21 *50 0 *29 132 27
*Includes recently added and pending active lek sites.
14
NBWC November 20182011 to 2018 Coyote Removal - Diamond
PMU
200 600
Total Coyotes Removed
Male Sage Grouse
500
150
400
100 300
200
50
100
12 4 10 12 18 8 12 6 26 27
0 0
2015 1967 2011 2012 2013 2014 2015 2016 2017 2018
High Low
Total Sites Visited PMU Lek Survey Total
Coyote Removal Linear (Total Sites Visited)
Linear (PMU Lek Survey Total)
Department Comments on Project
NDOW supports continuing Project 40 until mule deer populations reach levels defined in the
annual Predator Plan.
$3 Planned P-R Planned Wildlife Services NDOW Lethal NDOW Non-Lethal NDOW Salary, Travel, and Total
Expenditures Expenditures Expenditures Expenditures Expenditures Office
$100,000 N/A $110,960 $0 $20,343 $12,816 $121,430
15
NBWC November 201816 NBWC November 2018
Project 41: Increasing Understanding of Common Raven Densities and Space Use in
Nevada

The common raven (Corvus corax) has been identified as the most common nest predator of
Greater sage-grouse (Centrocercus urophasianus) (Coates et al. 2008, Lockyer et al. 2013).
Although the raven is a natural predator of Greater sage-grouse nests (Schroeder and Baydack
2001), human subsidies, including food sources (e.g., roadkill (Kristan III et al. 2004, Coates et
al. 2014a, b), landfills (William III and Boarman 2007, Peebles 2015) and artificial nesting
structures (e.g., power and utility lines (Knight et al. 1995, Coates et al. 2014a, b, Howe et al.
2014), dramatically increased raven abundance as much as 1600% in some areas (Boarman
1993, Sauer et al. 2017). Increased raven abundance coupled with Greater sage-grouse habitat
loss (Schroeder et al. 2004) and degradation (e.g., invasive species invasion (Commons et al.
1999, Baruch-Mordo et al. 2013, Coates et al. 2016), wildfire (Crawford et al. 2004, Lockyer et
al. 2015) resulted in reduced or decreased Greater sage-grouse population growth in portions of
its range (Klebenow 2001, Stiver 2011).

Raven Transmitters
Between October 2017 and September 2018 we captured and radio-tagged 36 ravens: 1 hatch
year, 4 adults and 31 juveniles. We started the season tracking 14 ravens radio-tagged during
previous capture efforts resulting in a total of 50 birds tracked during the season. At the end of
the season, 15 ravens were still alive with active transmitters (4 juveniles and 11 adults). One
raven slipped its transmitter, 5 devices stopped transmitting, 28 ravens died (24 juveniles and 4
adults) and 1 raven had an unknown fate. We could not find any remains near the transmitter of
the last raven but it’s possible it was scavenged. Two recovered transmitters were covered in a
pink residue; it’s unclear whether the substance was related to the cause of death.

Raven Nest Monitoring
We actively monitored 63 nests to capture juveniles as they fledged. While monitoring, we
confirmed 20 mortalities of unmarked fledglings, generally found under or near the nests. We saw
3 of these fledglings electrocuted on utility lines as they fell from the nest. Of the 24 radio-tagged
juvenile mortalities, 8 appeared depredated or scavenged and 13 carcasses were intact. Five intact
carcasses were on train tracks near their nest.

Point Count Surveys
NDOW technicians conducted 978 raven and raptor point count surveys. These data will be part
of the USGS’ statewide population estimate.

Transmission Line Surveys
NDOW technicians collected data on 390 miles of transmission lines and located a total of 25
nests.

                                                 17
NBWC November 2018
USGS Report
MODELING COMMON RAVEN OCCURRENCE ACROSS SAGEBRUSH
ECOSYSTEMS IN THE GREAT BASIN, USA
Background
- Raven populations across the Great Basin have been increasing during the last several
decades, However, methodology and resolution of data are inadequate for estimating
abundance, density, and true occurrence of ravens.
- Spatially explicit information on raven density and occurrence is also needed at regional
and local levels in order to guide management, especially where high raven prevalence
overlaps sage-grouse breeding habitats.
Methods
- We used hierarchical occupancy models to estimate and predict probability of raven
occurrence across the Great Basin, using data from >15,000 point count survey.
- We related raven occurrence to a large suite of natural and landscape predictors, which
were then used to predict spatial variation in raven occurrence across regions where
surveys did not occur.
- We generated model predictions of areas where raven occupancy was likely driven by
anthropogenic as opposed to natural factors; these products were overlapped with sage-
grouse concentration areas to identify areas where spatial prioritization can either target
habitat improvements or reduction of subsidies on the landscape.
Results
- Results indicated high raven occurrence (>0.8) across much of the study area
- Many of the drivers of raven occurrence were anthropogenic (road density, landfills,
transmission lines, agriculture).
Synthesis
- Findings will be used to help provide science-driven solutions for management of ravens
and sensitive prey species across the semi-arid ecosystems of the Great Basin
- Specifically, spatial products from this project help to identify regions where ravens
likely have strong top-down impacts on breeding sage-grouse and also provide guidance
on what category of management action will likely be most effective in these areas.
Products
O’Neil et al. (2018) Broad-scale occurrence of a subsidized avian predator: reducing impacts of
ravens on sage-grouse and other sensitive prey. Journal of Applied Ecology:
https://doi.org/10.1111/1365-2664.13249
O’Neil et al. (2018) Data from broad-scale occurrence of a subsidized avian predator: reducing
impacts of ravens on sage-grouse and other sensitive prey. U.S. Geological Survey data
release: https://doi.org/10.5066/p93oniqt
O’Neil et al. (2018; presentation) Broad-scale occurrence of a subsidized avian predator:
implications for reducing impacts of ravens on sage-grouse. Western Association of Fish
and Wildlife Agencies Sage and Columbian Sharp-Tailed Grouse Workshop, June 18–21,
2018, Billings, MT, USA.
18
NBWC November 2018ESTIMATING COMMON RAVEN DENSITIES IN A SEMI-ARID ECOSYSTEM:
IMPLICATIONS FOR CONSERVATION OF SAGE-GROUSE AND OTHER
SENSITIVE PREY SPECIES
Background
- Raven populations across the Great Basin have been increasing during the last several
decades. Methodology and resolution of data are inadequate for estimating abundance,
density, and true occurrence of ravens.
- Effects of ravens on sage-grouse reproductive success are largely unknown at broad
spatial scales.
- A method for rapid assessment of raven densities is needed to guide and evaluate the
effectiveness of raven management actions.
Methods
- We used distance sampling to estimate site-level densities of ravens across 41 field sites
in the Great Basin region, 2007 – 2016.
- We related raven density to sage-grouse nest survival at the site level to evaluate possible
effects of elevated raven density on reproduction.
- We explored the validity of using an index for rapid evaluation of raven density (# of
ravens / # of surveys).
Results
- Raven densities commonly exceeded ~ 0.4 ravens km-2 across the Great Basin. Several
sites had raven densities > 0.6 ravens km-2, and raven density appeared to be increasing at
some sites.
- At the site level, there was evidence of a raven density effect on sage-grouse nest
survival, where greater raven densities (e.g. > 0.48) corresponded with below-average
nest survival.
- Comparisons of model-based raven density estimates to the index of raven density
indicated a strong relationship between estimated raven density and # of ravens/survey.
Synthesis
- Findings will be used to help provide science-driven solutions for management of ravens
and sensitive prey species across the semi-arid ecosystems of the Great Basin.
- Negative effects of raven density on sage-grouse nest survival are likely at raven
densities > 0.5.
- In the absence of large sample sizes, an index can be rapidly applied with reasonable
accuracy to evaluate the effects of management actions.
Products
Coates et al. (Submitted to Condor: Ornithological Applications) Estimating Common Raven
densities in a semi-arid ecosystem: implications for conservation of sage-grouse and
other sensitive prey species.
O’Neil et al. (2018; presentation) Spatially explicit modeling of common raven density and
occurrence in sagebrush ecosystems. The Wildlife Society-Western Section Annual
Meeting, Feb. 5–9, 2018, Santa Rosa, CA, USA.
19
NBWC November 2018RELATING RAVEN DENSITY TO SAGE-GROUSE NEST SUCCESS AT THE NEST
LEVEL IN CALIFORNIA AND NEVADA
Background
- Effects of ravens on sage-grouse reproductive success are largely unknown at broad
spatial scales.
- Raven density likely varies within sites depending on local environmental drivers
- Raven effects on sage-grouse nests success are likely to be more precise when accounting
for local variation.
Methods
- We applied distance sampling procedures (Project # 2) combined with spatial kriging
models to estimate local raven density at distances < 3.5 km of individual sage-grouse
nests (n = 984) during years 2009–2017.
- Using a Bayesian frailty model for sage-grouse nest survival, we included the local
estimator for raven density as a covariate while also including relevant landscape
predictors (% sagebrush, elevation, etc.).
Results
- While greater elevations and sagebrush cover had positive influences on sage-grouse nest
survival, local raven density had a strong negative effect (effect on hazard: β = 0.151, p(β
> 0) = 0.999).
Synthesis
- Negative effects of raven density on sage-grouse nest survival are likely at raven
densities > 0.5; probability of nest success is greatest at low raven density.
- Local variation in raven density is likely driven by site-specific environmental drivers,
with consequences for sage-grouse nesting in the same areas.
Products
O’Neil et al. (2018; presentation) Reduced nest success in greater sage-grouse associated with
common raven density in Nevada & California, USA. International Grouse Symposium,
Sep. 24–28, Logan, UT, USA.
O’Neil et al. (In prep) Spatially-explicit estimation of Common Raven density within Great
Basin sagebrush ecosystems.
RAVEN AND SAGE-GROUSE INTERACTIONS AND BEHAVIORAL ECOLOGY
Background
- Behavioral ecology is important in understanding the impacts that breeding & territorial
ravens might have on sage-grouse, as well as how predator control techniques such as
egg oiling might affect ravens.
Methods
- Raven eggs were oiled on Alcatraz Island, CA and the nest was video-recorded.
- A raven nest was also video-recorded without egg oiling at Virginia Mountains (VM),
NV.
- Raven and sage-grouse behaviors were observed and harassment behavior was
documented at ~ 200 lek counts in NV and CA.
20
NBWC November 2018Results
- Ravens exhibited cannibalism in two circumstances. It was suspected that raven parents
consumed their own eggs after egg oiling occurred. Secondly, ravens attacked and killed
conspecific chicks in Virginia Mountains.
- Observations of sage-grouse flushing and ceasing to display were documented when
ravens were present.
- Chi-squared tests indicated that ravens were more likely to flush or cease displaying
when ravens were present as opposed to absent.
Synthesis
- Egg oiling may alter raven behavior in unanticipated ways.
- It is suspected that competing or transient ravens were responsible for killing the chicks
of resident ravens at VM.
- Sage-grouse reproductive activity may be impacted by avian predators indirectly (e.g.
altering behavior at leks) as well as directly (e.g. nest depredation).
Products
Atkinson et al. (Submitted to Journal of Ornithology). Conspecific egg and nestling consumption
in Northern Raven (Corvus corax).
Atkinson et al. (In prep) Novel reactions to Common Ravens from lekking Greater Sage-Grouse.
Department Comments on Project
NDOW supports continuing Project 41.
$3 Planned P-R Planned Wildlife Services NDOW Lethal NDOW Non-Lethal NDOW Salary, Travel, and Total
Expenditures Expenditures Expenditures Expenditures Expenditures Office
$100,000 $300,000 $0 $0 $351,417 $12,816 $364,233
21
NBWC November 2018Project 42: Assessing Mountain Lion Harvest in Nevada
No work was performed on Project 42 during FY 2018.
$3 Planned P-R Planned Wildlife Services NDOW Lethal NDOW Non-Lethal NDOW Salary, Travel, and Total
Expenditures Expenditures Expenditures Expenditures Expenditures Office
$0 $0 $0 $0 $0 $0 $0
22
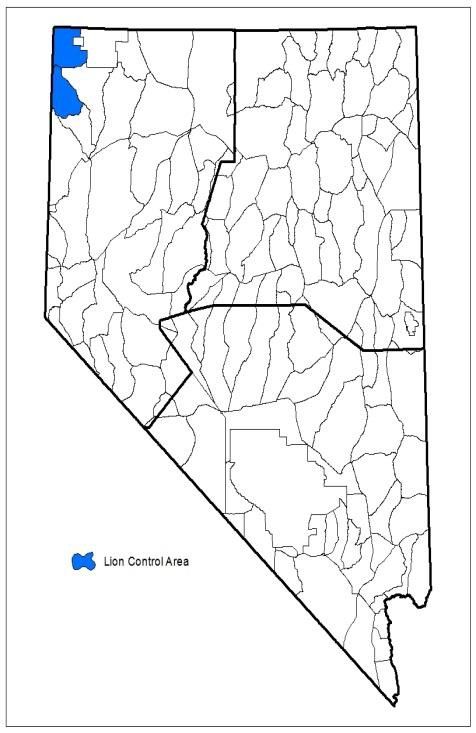
NBWC November 2018Project 43: Mesopredator Removal to Protect Waterfowl, Turkeys, and Pheasants on
Wildlife Management Areas
USDA WS conducted mesopredator removal for the benefit of primarily waterfowl and turkeys
in Mason Valley and Overton Wildlife Management Areas in FY 2018.
Species Mason Valley Overton
Badger 0 1
Coyote 23 19
Feral Cat 0 2
Mink 1 0
Kit Fox 0 1
Raccoon 4 5
Spotted Stunk 0 1
Department Comments on Project
NDOW recommends continuing project 43 pending funding availability.
$3 Planned P-R Planned Wildlife Services NDOW Lethal NDOW Non-Lethal NDOW Salary, Travel, and Total
Expenditures Expenditures Expenditures Expenditures Expenditures Office
$50,000 $N/A $28,447 $0 $0 $12,816 $41,263
23
NBWC November 2018Overall Budget and Expenditures for FY 2018
Project $3 Planned P-R Planned Wildlife NDOW NDOW Non- NDOW Salary, Total
Expenditures Expenditures Services Lethal Lethal Travel, and
Expenditures Expenditures Expenditures Officeb
Department of Ag $14,000 N/A $14,000 $0 $0 $0 $14,000
a
Transfer
Project 21 $100,000 N/A $39,151 $0 $5,848 $12,816 $57,815
Project 21-02 $25,000 N/A $16,695 $0 $0 $12,816 $29,511
Project 22-01 $90,000 N/A $95,341 $27,800 $0 $12,816 $135,957
Project 22-074 $90,000 N/A $0 $0 $4,900 $12,816 $17,716
Project 32 $40,000 $120,000 $0 $0 $80,274 $12,816 $93,090
Project 37 $175,000 N/A $40,932 $134,285 $21,627 $12,816 $209,660
Project 38 $175,000 N/A $133,720 $0 $0 $12,816 $146,536
Project 40 $100,000 N/A $110,960 $0 $20,343 $12,816 $144,119
Project 41 $100,000 $300,000 $0 $0 $351,417 $12,816 $364,233
Project 42 $2,500 $7,500 $0 $0 $0 $0 $0
Project 43 $50,000 N/A $28,447 $0 $0 $12,816 $41,263
Totalc $961,500 $427,500 $479,246 $162,085 $484,409 $128,160 $1,253,900
a
This transfer of $3 predator fees for administrative support to the Department of Agriculture partially funds state personnel that conduct
work for the benefit of wildlife at the direction of USDA WS (e.g., mountain lion removal to benefit wildlife).
b
Incorporates both $3 and P-R expenditures
c
Nevada Department of Wildlife spent $641,331 on lethal predator removal during FY 2018. This accounted for 108% of FY 2016
revenues.
Expected Revenues and Beginning Balance of $3 Predator Fee
FY 2016 Actual FY 2017 Actual FY 2018 Actual FY 2019 Projected
Beginning balance $544,631 $591,382 $404,660 $412,581
Revenues $595,107 $635,835 $677,189 $677,189
Plan Budget $556,000 $839,500 $961,500 $691,500
Expenditures $548,356 $840,557 $856,726 $691,500
Ending balance $591,382 $404,660 $412,581 $398,270
24
NBWC November 2018Literature Cited
Baruch-Mordo, S., J. S. Evans, J. P. Severson, D. E. Naugle, J. D. Maestas, J. M. Kiesecker, M.
J. Falkowski, C. A. Hagen, and K. P. Reese. 2013. Saving sage-grouse from the trees: A
proactive solution to reducing a key threat to a candidate species. Biological
Conservation 167:233–241.
Boarman, W. I. 1993. When a native predator becomes a pest: a case study. Pages 191–206 in S.
K. Majumdar, E. W. Miller, K. Brown, J. R. Pratt, and R. F. Schmalz, editors.
Conservation and Resource Management. Academy of Natural Sciences, Philadelphia,
Pennsylvania, USA.
Coates, P. S., B. E. Brussee, K. B. Howe, K. B. Gustafson, M. L. Casazza, and D. J. Delehanty.
2016. Landscape characteristics and livestock presence influence common ravens:
relevance to greater sage-grouse conservation. Ecosphere 7:1–20.
Coates, P. S., J. W. Connelly, and D. J. Delehanty. 2008. Predators of Greater sage-grouse nests
identified by video monitoring. Journal of Field Ornithology 79:421–428.
Coates, P. S., K. B. Howe, M. L. Casazza, and D. J. Delehanty. 2014a. Common raven
occurrence in relation to energy transmission line corridors transiting human-altered
sagebrush steppe. Journal of Arid Environments 111:68–78.
Coates, P. S., K. B. Howe, M. L. Casazza, and D. J. Delehanty. 2014b. Landscape alterations
influence differential habitat use of nesting buteos and ravens within sagebrush
ecosystem: Implications for transmission line development. The Condor 116:341–356.
Commons, M. L., R. K. Baydack, and C. E. Braun. 1999. Sage grouse response to pinyon-juniper
management. Pages 238–239 in S. B. Monsen and R. Stevens, editors. Ecology and
management of pinyon-juniper communities within the Interior West. Volume 3. USDA
Forest Service Proceedings, Provo, UT, USA.
Crawford, J. A., R. A. Olson, N. E. West, J. C. Mosley, M. A. Schroeder, T. D. Whitson, R. F.
Miller, M. A. Gregg, and C. S. Boyd. 2004. Ecology and management of sage-grouse and
sage-grouse habitat. Rangeland Ecology & Management 57:2–19.
Hayes, R. D., R. Farnell, R. M. P. Ward, J. Carey, M. Dehn, G. W. Kuzyk, A. M. Baer, C. L.
Gardner, and M. O’Donoghue. 2003. Experimental reduction of wolves in the Yukon:
ungulate responses and management implications. Wildlife Monographs 152:1–35.
Howe, K. B., P. S. Coates, and D. J. Delehanty. 2014. Selection of anthropogenic features and
vegetation characteristics by nesting Common Ravens in the sagebrush ecosystem. The
Condor 116:35–49.
Klebenow, D. A. 2001. Enhancing sage grouse habitat: a Nevada landowner’s guide. A
northwest Nevada sage grouse working group publication. Nevada Wildlife Federation,
Inc.
Knight, R. L., H. A. Knight, and R. J. Camp. 1995. Common ravens and number and type of
linear rights-of-way. Biological Conservation 74:65–67.
Kristan III, W. B., W. I. Boarman, and J. J. Crayon. 2004. Diet composition of common ravens
across the urban-wildland interface of the West Mojave Desert. Wildlife Society Bulletin
32:244–253.
Lockyer, Z. B., P. S. Coates, M. L. Casazza, S. Espinosa, and D. J. Delehanty. 2013. Greater
Sage-Grouse nest predators in the Virginia Mountains of northwestern Nevada. Journal of
Fish and Wildlife Management 4:242–255.
Lockyer, Z. B., P. S. Coates, M. L. Casazza, S. Espinosa, and D. J. Delehanty. 2015. Nest-site
selection and reproductive success of greater sage-grouse in a fire-affected habitat of
25
NBWC November 2018northwestern Nevada: Sage-Grouse nest selection and survival. Journal of Wildlife
Management 79:785–797.
Logan, K. A., and L. L. Sweanor. 2000. Puma. Pages 347–377 in S. Demarais and P. R.
Krausman, editors. Ecology and management of large mammals in North America.
Prentice Hall, Upper Saddle, New Jersey, USA.
McKinney, T., J. C. Devos Jr, W. B. Ballard, and S. R. Boe. 2006. Mountain lion predation of
translocated desert bighorn sheep in Arizona. Wildlife Society Bulletin 34:1255–1263.
Peebles, L. W. 2015. Winter ecology of common ravens in southern Wyoming and the effects of
raven removal on greater sage-grouse populations.
Rominger, E. M., H. A. Whitlaw, D. L. Weybright, W. C. Dunn, and W. B. Ballard. 2004. The
influence of mountain lion predation on bighorn sheep translocations. Journal of Wildlife
Management 68:993–999.
Sacks, B. N., M. M. Jaeger, J. C. Neale, and D. R. McCullough. 1999. Territoriality and breeding
status of coyotes relative to sheep predation. Journal of Wildlife Management 63:593–
605.
Sauer, J. R., D. K. Niven, J. E. Hines, D. J. Ziolkowski Jr, K. L. Pardieck, J. E. Fallon, and W. A.
Link. 2017. The North American breeding bird survey, results and analysis 1966 - 2015.
Version 12.23.2015, Laurel, Maryland, USA.
Schroeder, M. A., C. L. Aldridge, A. D. Apa, J. R. Bohne, C. E. Braun, S. D. Bunnell, J. W.
Connelly, P. A. Deibert, S. C. Gardner, M. A. Hilliard, and others. 2004. Distribution of
sage-grouse in North America. The Condor 106:363–376.
Schroeder, M. A., and R. K. Baydack. 2001. Predation and the management of prairie grouse.
Wildlife Society Bulletin 29:24–32.
Seidler, R. G., E. M. Gese, and M. M. Conner. 2014. Using sterilization to change predation
rates of wild coyotes: A test case involving pronghorn fawns. Applied Animal Behaviour
Science 154:83–92.
Stiver, S. J. 2011. The legal status of greater sage-grouse: organizational structure of planning
efforts. Pages 33–49 in S. T. Knick and J. W. Connelly, editors. Studies in Avian
Biology. Volume 38.
Till, J. A., and F. F. Knowlton. 1983. Efficacy of denning in alleviating coyote depredations
upon domestic sheep. Journal of Wildlife Management.
William III, B. K., and W. I. Boarman. 2007. Effects of anthropogenic developments on common
raven nesting biology in the west Mojave Desert. Ecological Applications 17:1703–1713.
Appendix
http://www.ndow.org/Nevada_Wildlife/Conservation/Nevada_Predator_Management/
26
NBWC November 2018You can also read