Panoramic tongue imaging and deep convolutional machine learning model for diabetes diagnosis in humans
←
→
Page content transcription
If your browser does not render page correctly, please read the page content below
www.nature.com/scientificreports
OPEN Panoramic tongue imaging
and deep convolutional machine
learning model for diabetes
diagnosis in humans
Saritha Balasubramaniyan1, Vijay Jeyakumar2 & Deepa Subramaniam Nachimuthu3*
Diabetes is a serious metabolic disorder with high rate of prevalence worldwide; the disease has
the characteristics of improper secretion of insulin in pancreas that results in high glucose level
in blood. The disease is also associated with other complications such as cardiovascular disease,
retinopathy, neuropathy and nephropathy. The development of computer aided decision support
system is inevitable field of research for disease diagnosis that will assist clinicians for the early
prognosis of diabetes and to facilitate necessary treatment at the earliest. In this research study, a
Traditional Chinese Medicine based diabetes diagnosis is presented based on analyzing the extracted
features of panoramic tongue images such as color, texture, shape, tooth markings and fur. The
feature extraction is done by Convolutional Neural Network (CNN)—ResNet 50 architecture, and the
classification is performed by the proposed Deep Radial Basis Function Neural Network (RBFNN)
algorithm based on auto encoder learning mechanism. The proposed model is simulated in MATLAB
environment and evaluated with performance metrics—accuracy, precision, sensitivity, specificity, F1
score, error rate, and receiver operating characteristics (ROC). On comparing with existing models,
the proposed CNN based Deep RBFNN machine learning classifier model outperformed with better
classification performance and proving its effectiveness.
Diabetes is a worldwide serious metabolic disease that affects well-being of humans by increasing glucose level in
blood and it is one of leading causes of death throughout the world. According to the study made by Saeedi et al.,
it is estimated about 463 million peoples are affected by diabetes in 2019 and the study is extended to identify
the possible number of cases that may get affected in 2030 is to be 578 million and by 2045 this may even rise
to 700 million1. The inability of the body to completely utilize the glucose produced by cells due to improper
secretion of insulin in pancreas is diabetes; if the produced insulin is not sufficient to convert the entire glucose
into energy then the disease is characterized as Type 2 diabetes. This type of disease commonly prevails among
majority of peoples of age group above 40 years but in some cases the beta cells of the pancreas are completely
damaged so that the insulin is not produced at all, this type is termed as Type 1 diabetes. The complications of
the disease include neuropathy, nephropathy, retinopathy and cardio vascular diseases, Ljubic et al. Therefore,
the early diagnosis of the disease and treatment is always a challenging task for Diabetologists c oncerned2.
For the past few years, the Chinese medicine has got great attention towards early prognosis and treatment
of diabetes. The diagnosis strategy followed by the Western Medicine (WM) and Traditional Chinese Medicine
(TCM) is different from each other, Dong 3. TCM follows two basic theories to study the human body, for a
healthy wellbeing there should be a perfect balance between five basic elements of universe such as earth, fire,
water, metal and wood. All the natural phenomena is categorized into Yin-Yang function, where both Yin and
Yang are opposite to each other and they cannot exist without one another as shown in Fig. 1. In TCM the dia-
betes is caused due to ‘Yin’ deficiency that resulted in frequent drinking and urination, the category of ‘Xiao-Ke
disease’. The tongue diagnosis is the main strategy employed in TCM to identify the Yin-Yang disorders, based on
which numerous diseases can be diagnosed at its early stage such as breast cancer (Lo et al.), rhumatoid arthiritis
(Xie et al.), chronic disease (Sang et al.), lung disease syndrome (Buditjahjanto et al.), liver disease (Cao et al.),
spleen and stomach (Bai et al.) and so on4–9. The development of high accuracy automatic tongue diagnosis
1
Department of Electronics and Communication Engineering, Jai Shriram Engineering College, Tiruppur, Tamil
Nadu 638 660, India. 2Department of Biomedical Engineering, Sri Sivasubramaniya Nadar College of Engineering,
Chennai, Tamil Nadu 603 110, India. 3Department of Electrical Engineering, National Institute of Technology
Arunachal Pradesh, Yupia, Papum Pare District, Arunachal Pradesh 791112, India. *email: deepapsg@gmail.com
Scientific Reports | (2022) 12:186 | https://doi.org/10.1038/s41598-021-03879-4 1
Vol.:(0123456789)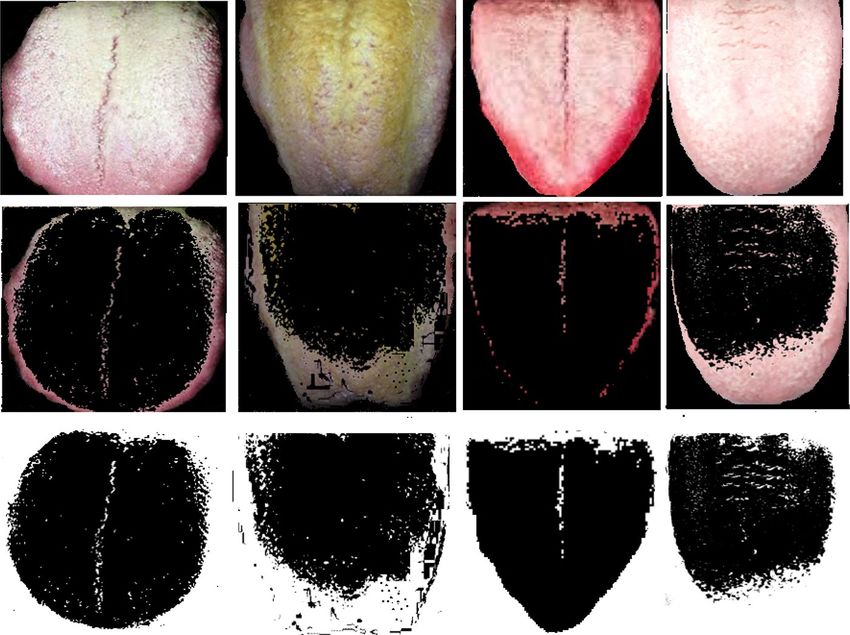
www.nature.com/scientificreports/
Figure 1. Five elements and Yin-Yang theory.
system is always an open field of study, since the human based analysis requires high degree of experience and
knowledge for feature interpretation in TCM.
Existing works of literature
Over the past few years, works have been carried out for various diagnoses employing the features extracted
from the tongue images of humans. Few literature works on research of tongue image based diagnosis strategies
are presented in this section as follows:
Zhang et al. presented a non-invasive strategy to diagnose non-proliferative diabetic retinopathy (NPDR)
based on the tongue features such as colour, texture and geometry with small number of d ataset10. The tooth
marking is the index of Qi deficiency syndrome diagnosis, the convex hull of tongue is constructed by Graham
Algorithm to perform effective tooth marking identification in the work of Li et al.11. The statistical distribu-
tion characteristics of tongue color and the tongue color gamut was established to identify red spots petechial
point for tongue diagnosis p urposes12. Wang et al. performed tooth marking identification in tongue images by
computing the slope of the margin, length and degree of concave regions of t ongue13.
Shao et al. concentrated on feature of convex region to predict the tooth marking of tongue images14. Preshiya
presented a diabetes diagnosis based on color image segmentation method. The color of tongue represents the
n15. Kawanabe et al. employed
effective working of internal organs such as pancreas, liver, intestines, liver and so o
machine learning strategies to perform tongue color based diagnosis strategy based on Japanese Traditional
Medicine16. For early prognosis of diabetes disease support vector machines (SVM) based strategy was designed
with 296 diabetic and 531 non-diabetic patient tongue images and the model reported 83.06% of classification
accuracy on employing PCA for feature selection and GA for parameter optimization17. The SVM is simple and
better classifier model, whereas it has the limitation of large dataset handling issue.
Huo et al. proposed a tongue shape classification model and here the image quality was enhanced by employ-
ing Gabor filter, the feature extraction and classification was made by AlexNet CNN t echnique18. The surface
of tongue color is an essential feature defining the syndrome and the tongue color extraction was employed for
various disease diagnoses including d iabetes19,20.
Tania et al. studied the research gap in the current works of Automatic Tongue Diagnosis systems21. Joshi
and Chawan employed machine learning strategies for diabetes diagnosis by using SVM, Logistic regression
and artificial neural network methods22. The concave regions of tongue was used to perform tooth making
identification in most of literatures but in case of perfect dimension the result was inconsistent, Li et al.23. So,
CNN was employed to identify the deep features then multi-intense classifier was employed over the features
to take final decision.
Srividhya and Muthukumaravel performed tongue shape, colour, size and texture based disease classification
based on self-organizing map Kohonen Classifier technique24. Shen et al. developed a tongue–machine–interface
based on passive magnetic localization strategy25. Thirunavukkarasu et al. made diabetes classification based on
the thermal variations of tongue, the RGB color histogram was employed to extract the features, and the clas-
sification was made based on convolutional neural network (CNN) t echnique26. The tooth marking was one of
the features associated with diabetes disease, Wang et al. developed a ResNet 34 CNN strategy for tooth marking
identification in tongue i mages27.
Scientific Reports | (2022) 12:186 | https://doi.org/10.1038/s41598-021-03879-4 2
Vol:.(1234567890)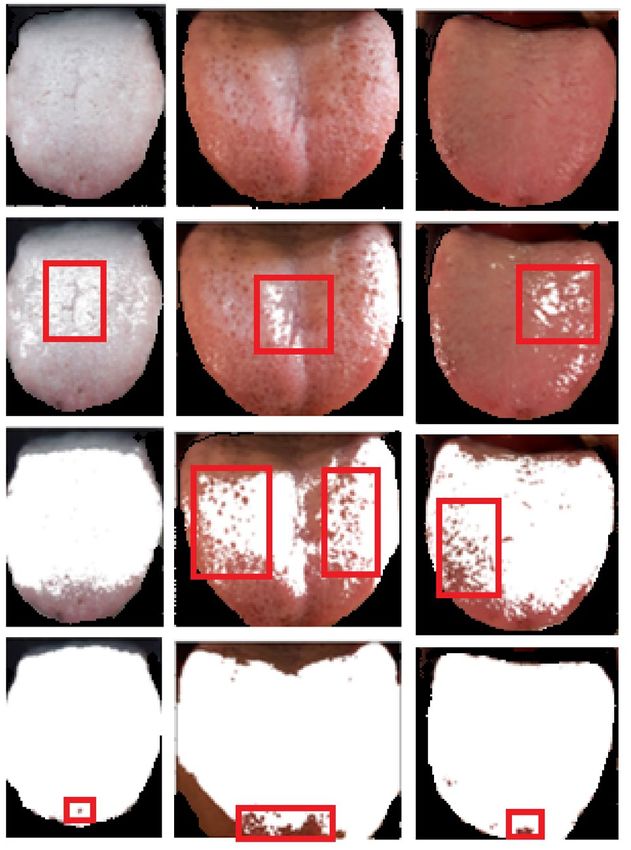
www.nature.com/scientificreports/
Naveed employed fractional order Darwinian particle swarm optimization algorithm to classify diabetes
based on tongue features such as color and texture28. Wu et al. proposed a CNN based diabetes diagnosis strat-
egy to perform image classification, small number of training data was utilized with a kind of transfer learning
strategy adopted to improve the learning speed29. The background of diabetes and the disease complication was
reviewed, the overview of decision support models based on machine learning strategies was presented in Lim
et al.30.
Vijayalakshmi et al. utilized features such as color, texture, geometry of tongue for diabetes diagnosis based
on SVM-CNN s trategy31. To perform an effective tongue diagnosis, a combination of histogram of oriented
gradients (HOG) and the support vector machine (SVM) was developed in the study made by Yuan and Liao,
where the tongue coating was extracted by k-means segmentation strategy32. A Multi-Task Joint learning (MTL)
for tongue segmentation and classification based on deep learning technique (Xu et al.), here the UNET and
Discriminative Filter Learning DFL was fused with MTL to improve the classification a ccuracy33.
Tang et al. presented a tooth marked tongue regions based on deep learning strategy, here a two-stage meth-
odology based on cascaded CNN to identify the tongue region and tongue land m arks34. The tongue color and
texture was employed to perform diabetes classification by Kernel Ensemble Classification (KEC) by Selvarani
and Suresh 35.
Zou et al. has elucidated the various machine learning techniques employed for detecting diabetes mellitus36.
Mujumdar and Vaidehi employed pipeline based AdaBoost classifier, Gradient Boost classifier and Random
atasets37. Peng et al. demonstrated the clini-
forest classifier for predicting diabetes mellitus with the considered d
cal utilities to rapidly stratify diabetes subjects based on their oxidative status in conjunction to the traditional
glycemic level to improve the patient stratification and thus the overall outcome of clinical diabetes care and
management38. Pen et al. developed a new methodology for rapid, label-free molecular phenotyping of biological
fluids (e.g., blood) by exploiting the recent advances in fast and highly efficient multidimensional inverse Laplace
decomposition technique. Machine learning techniques were introduced to transform the NMR correlational
map into user-friendly information for point-of-care disease diagnostic and m onitoring39.
On investigating the existing works of literatures, numerous models were proposed in general for disease
diagnosis and only few are available in the field of diabetes diagnosis. The studies mostly employed few dataset
for training the model that affects the model performance and also they highly concentrated on tongue colour
and tooth markings as significant features. Based on the review made on all the existing works of this application
area, the various limitations inferred includes:
– Few methods are not applicable for large volumes of data15–20.
– Difficult to handle increased data d imension24.
– Inappropriate extraction of prominent features12,13
– Increased computational c omplexity22
– Delayed convergence26–30
– Minimal features are employed and hence classification accuracy was not g uaranteed31.
– Premature convergence with the occurrences of global and local minima p roblems14
– Inconsistent attainment of r esults23
To address the above said limitation the proposed model investigated on various features such as colour,
texture, tooth markings, fur colour, fur thickness and so on and developed appropriate hybrid neural network
models to diagnose diabetic. The hybrid approach in this research study employs convolutional neural network
model for effective feature extraction and a novel deep learning based radial basis function neural model for
better classification of diagnosing diabetics with tongue image features.
The novelty in the paper includes the development of new deep radial basis function neural network model
with the Gaussian activation function and enabling in the diagnosis of diabetes mellitus. The developed deep
convolutional based radial basis function is modelled in the ResNet 50 being the feature extractor and the new
deep RBFNN to be the classifier. Originally, the deep convolutional models themselves modelled to be feature
extractor and classifier and in this paper, the effective features of the radial basis function to act as a normal den-
sity function is brought out and led in the development of the deep radial basis function neural network model.
Additionally, the modelled deep RBFNN is optimized for its deep radial basis layers with 6 layers as shown in
Fig. 3 and the deep hidden neurons equal to the number of input neurons in the input layer. Generally, TCM
was operated for its prediction applications with simple neural models, but in this paper the novelty is depicted
by the utilization of deep convolutional feature extractor and deep radial basis classifier along with the TCM for
the most effective detection and classification of diabetes mellitus.
The rest of the article is framed as follows: An overview of Xiao-Ke disease is presented in “Xiao-Ke disease
(diabetes mellitus)—an overview”, the novel methodology for better classification is discussed in “Methods
and materials”, the proposed Deep RBFNN model is elucidated in “TCM based diabetes diagnosis in humans
with proposed technique”, results and discussion made to prove validity of proposed technique is provided in
“Results and discussions”, and finally “Conclusion” presents the conclusion of this research study based on the
investigations done.
Xiao‑Ke disease (diabetes mellitus)—an overview
In Traditional Chinese Medicine (TCM), a disease is diagnosed based on the harmony that exist between five
basic elements such as wood, fire, earth, metal and water, where each element are connected with specific organ
of the human body. The functions of the organs, the emotional states, and symptoms of disease can be analyzed
based on Yin-Yang theory. The ‘Yin’ is the dark portion of Yin-Yang that shows the cold, negativity, illness,
Scientific Reports | (2022) 12:186 | https://doi.org/10.1038/s41598-021-03879-4 3
Vol.:(0123456789)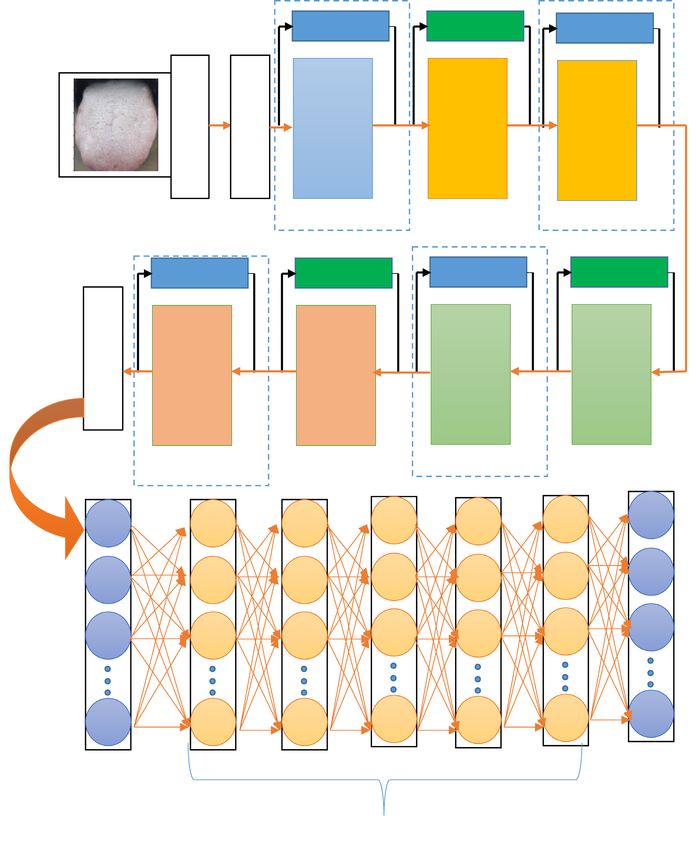
www.nature.com/scientificreports/
Data acquisition
Preprocessing
ResNet 50
Tongue Color Fissure Fur color & Tooth Red dot
& Shape identification fur thickness Markings
Feature Extraction
Deep RBFNN
DM Non-DM
Figure 2. Block diagram of the proposed diabetes diagnosis research study with panoramic tongue imaging
technology.
slow, inward, and passive. The ‘Yang’ is the bright portion that shows brightness, high strength, positivity, heat,
excitement and so on. In ‘Yin’ there is always small portion of ‘Yang’ and ‘Yang’ is always associated with small
portion of ‘Yin’.
The diabetes is categorized as Xiao-Ke syndrome in TCM, which means “Wasting” and “Thirsting”, the disease
gets associated with the organs of lungs, stomach and the kidneys. Traditionally the Xiao-Ke is classified as three
types—the lower, middle and the upper which are characterized by the symptoms of excessive urination, exces-
sive hunger and excessive thirst respectively. If a patient has symptom of excessive urination, it can be described
as the ‘Yin’ deficiency of lung and kidney that produces high internal heat and utilizes high body fluids so the
patient is reported with excess thirsting.
In TCM the tongue is considered as index of all organs, it is connected through meridians to the internal
organs of the body. The tongue is the visual indicator of the body functions (Gabhale et al.) and its appearance
reflect the balance that exist between the five elements, so the one who perform diagnosis can understand the
physical and mental health of the patient based on the tongue features such as color, shape, coating, texture,
tooth markings, and so on40. Numerous studies has been carried out on identifying the features for tongue based
diabetes diagnosis41, Hsu et al. detailed that the yellow fur, thick fur and the bluish tongue are the features associ-
ated with high prevalence of diabetes and tooth marked tongue identification by employing deep CNN model
was done by Wang et al., tongue thermography as diagnosing tool for type 2 diabetes, works concentrated on
tooth marking and color identification process as w ell26,27.
In this research study, the tongue features such as tooth mark, fur color, fur thickness, tongue shape, saliva,
tongue color and red dot are extracted by employing deep convolutional neural network, and the extracted fea-
tures are fed into deep Radial Basis Neural model to flag the tongue as belonging to normal class or affected class
(diabetes mellitus (DM) or non-diabetes mellitus (non-DM)). Figure 2 presents the block diagram representation
of the proposed diabetes diagnosis research study.
Methods and materials
In this research study, a novel hybrid convolutional neural network framework with deep radial basis function
neural network model is developed with the prominent features from the tongue images collected from hospitals.
This section details the methods employed and data used for performing effective diabetic diagnosis by extracting
the most significant features from the considered image datasets.
Scientific Reports | (2022) 12:186 | https://doi.org/10.1038/s41598-021-03879-4 4
Vol:.(1234567890)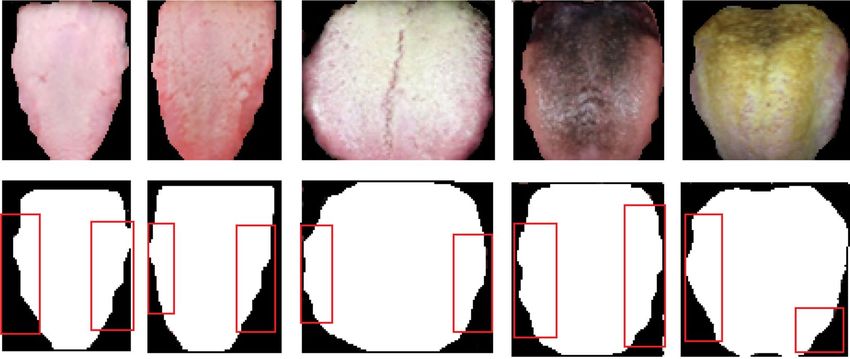
www.nature.com/scientificreports/
Panoramic tongue image acquisition. The collected tongue image datasets reflects the actual body con-
dition and it does not get altered by other external factors, the color of the tongue, the thickness, and the surface
of the tongue can be altered by certain food beverages such as coffee, tea, and ice cream, chocolate and so on. The
tongue color is considered as one of the main feature for disease diagnosis, if the participant consumes fruit like
blue berries the tongue color will turn blue, consuming spicy food will change the color to bright red, which will
affect the diagnosis result. Also, the brushing process removes the coating of tongue and it will appear to be thin,
which will affect the diagnosing accuracy, moreover the thickness of the tongue gets thinner as the day elapses.
So, considering these factors the participants are requested not to brush or consume any food before their tongue
image is captured and the image is captured early in the morning before the participant have their breakfast.
Mild red color, considerably wet, covered with thin white layer are the nature of normal tongue, whereas it
changes for various seasons. The white coating slightly becomes yellow due to hot climatic condition in summer
and the coating becomes thin and dry during autumn, becomes highly moist during winter season. The yellow
coating and dryness are the features representing the disease, so there is possibility to label the normal patient
as a diabetic patient which is highly dangerous. In the existing works of literature there is no study available on
accounting the seasonal changes affecting the tongue features.
On accounting the above mentioned significance; in the proposed research study one year dataset is collected
in the diabetic care unit of Kalpana Hospitals, Coimbatore, India, using a high quality panoramic image acquisi-
tion module. The data collection is made in four phases, in the month of December—January the first phase of
data collection is made and about 530 participants are participated among them 272 are diabetic patients and
258 were non-diabetic patients. The second phase of data collection made in the month of March–May about 750
patient images were collected and among them 483 patients were diabetic and 267 were non-diabetic patients.
In the month of June–September the third phase of data collection is made with 723 of diabetic patient record
and 339 of non-diabetic patient images. The final phase of data collection is made in the month of October with
180 images of diabetic record and 153 of non-diabetic patient images.
The proposed research study aims to diagnose type 2 diabetes so the patients of type 1, Gestational diabetes are
not included in the study. The database of 1658 diabetic patient images with 1017 non-diabetic patients records
are segregated onto 70% (1161-DM and 712 of non DM) for training the model and 30% (497-DM and 305 non
DM) as independent dataset to evaluate the performance of the proposed diagnosis model.
Developed ResNet‑50 machine learning architecture for diagnostic study. Basically, the deep
learning network is difficult to train because of vanishing gradient issues, when the network grows deeper the
accuracy gets saturated. On considering this limitation a residual network is employed in this proposed research
study. The residual network employs a concept of skip connection strategy; where the original input is added
to the loss function at output through skip connection so that the vanishing gradient issue gets addressed. The
shortcut connections optimize the ResNets by reducing the training error of the conventional stacked connec-
tions by the formulation of Y = F(X) + X at the output side. The basic objective of residual network is making
the residue F(X) tend to zero, so that the output will be equal to the input at the output end.
The architecture of the ResNet-50 employed in this research study is presented in Fig. 3. The input image is
fed into the first layer where the filter size is 7 × 7 and number of filters is 64 with stride value of 2 and padding
of 3, the max pool is employed for down sampling with the stride of 2. Each of Relu block in ResNet-50 has three
feature layers, the skip connection is employed by two ways based on the size of F(X) and X. The input is directly
connected to the output if the size of F(X) and X are same else a convolution is made in the skip connection to
match the size of the input and the functional output if they are varied. The fully connected layer retains the
complete feature of the image without any loss, this feature vector is seeded as input for deep radial basis func-
tion network to classify the vectors as a diseased one or not.
Multilayer RBFNN Architecture for panoramic tongue image classification. Neural network
forms the base of deep learning where the algorithms are based on the learning behaviour of human brain. The
network is trained with set of input–output patterns and the model is tested with new pattern of input and the
corresponding response is evaluated. The framework of a neural network model has input and output layer with
one or more hidden layers based the network architecture and based on the problem requirement. Deep learning
architecture mimics the structure of human brain where numerous neurons are interconnected together to take
a specific decision. In this research work, a multilayer Radial Basis Function Neural Network (RBFNN) model
with auto-encoder learning mechanism is implemented to learn the features with better generalization ability.
The RBFNN is a single layer feed forward neural network like multilayer perceptron and was initially developed
by Craddock and Warwick (1996)42.
The centre identification in multilayer RBFNN model is not an easy task during learning process, so the
k-means clustering algorithm is employed to identify the center. The functional connection between the layers
are represented as,
N
2
f (x) = ci ϕ(
xj w − ri
) (1)
i=1
Equation (1) is similar to that of traditional RBFNN model whereas, in multilayer RBFNN a norm function
is introduced to locate the position of data points in the high dimensional space.
Deep auto-encoder based learning mechanism is implemented over layer by layer of hidden neurons, and the
data is decoded so that the underlying significant features are reflected at output layer to present specific classes
with better and effective accuracy rate. The conventional gradient decent learning rule is employed to update
Scientific Reports | (2022) 12:186 | https://doi.org/10.1038/s41598-021-03879-4 5
Vol.:(0123456789)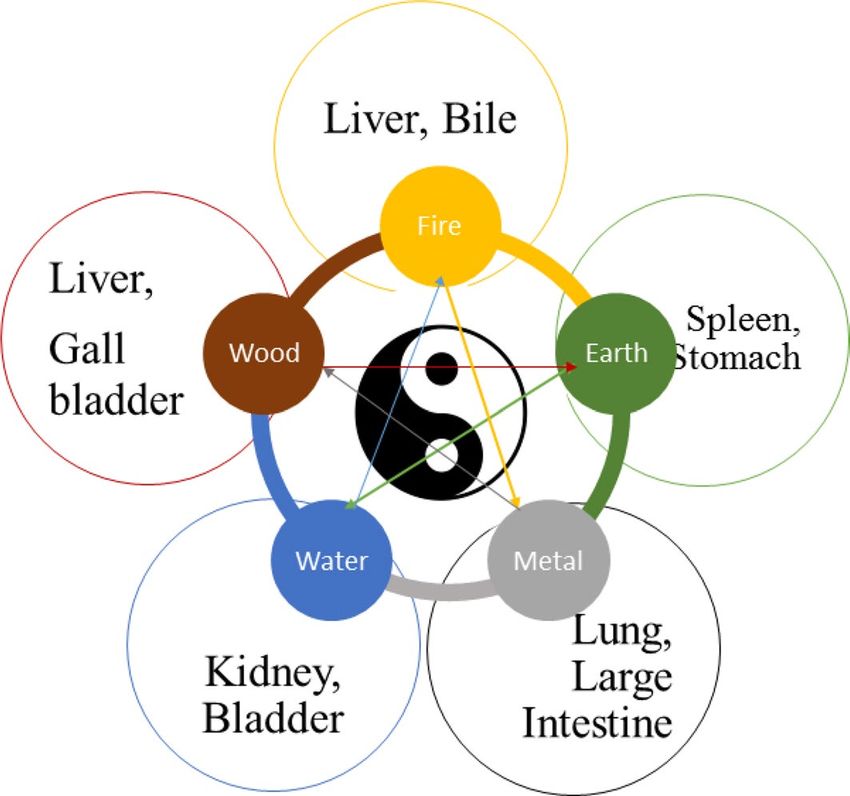
www.nature.com/scientificreports/

                                                                                                         Identity                    conv            Identity

                                                                                    3*3 Max Pool/2

                                                                                                                               1x1 conv, 128/2
                                                             7x7 conv, 64/2

                                                                                                     1x1 conv, 256

                                                                                                                                3x3 conv, 128
                                                                                                                                1x1 conv, 512

                                                                                                                                                 1x1 conv, 128
                                                                                                                                                 3x3 conv, 128
                                                                                                                                                 1x1 conv, 512
                                                                                                      1x1 conv, 64
                                                                                                      3x3 conv, 64
                                                                                                         3 layers                                    3 layers

                                                            Identity                                      Conv                     Identity               Conv
                                     Avg Pool/2

                                                                                                                                                     1x1 conv, 256/2
                                                                                                     1x1 conv, 512/2

                                                                                                                               1x1 conv, 1024

                                                                                                                                                     1x1 conv, 1024
                                                         1x1 conv, 2048

                                                                                                     1x1 conv, 2048

                                                                                                                                1x1 conv, 256
                                                                                                                                3x3 conv, 256

                                                                                                                                                      3x3 conv, 256
                                                          1x1 conv, 512
                                                          3x3 conv, 512

                                                                                                      3x3 conv, 512

                                                                                                                                   5 layers
                      Fully connected                       2 layers
                           layer
                                                                                                     Ω                 Ω                Ω        Ω                     Y1
                                         X1                                   Ω

                                                                              Ω                      Ω                 Ω                Ω        Ω                     Y2
                                         X2

                                                                              Ω                      Ω                 Ω                Ω        Ω                     Y3
                                         X3

                                                                              Ω                      Ω                 Ω                Ω        Ω                     Yn
                                         Xn

                                 Input layer                                                                                                              Output layer

                                                                                                                Hidden layer

                                                  Figure 3.  Machine learning architecture of deep CNN-RBFNN for tongue diagnosis.

                                                  the weight vectors, the objective of the algorithm is to reduce the reconstruction error between the encoded and
                                                  decoded data. The derivative of error function is back propagated from output layer to the hidden layer based
                                                  on the error function and then the weight vectors are updated.

          Scientific Reports |   (2022) 12:186 |                                  https://doi.org/10.1038/s41598-021-03879-4                                                6

Vol:.(1234567890)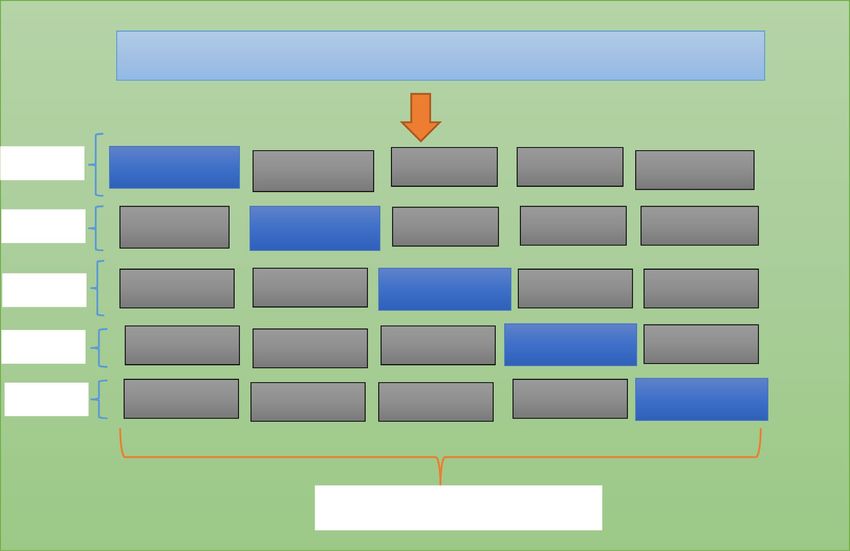
www.nature.com/scientificreports/
The weight vectors between the input and the hidden layers are depicted as wij and the weight vectors between
the hidden and the output layers are presented as vjk , the error gradient between the input and the hidden layer is
presented as δi and δk ; these indicates the error gradient between the hidden and the output layer. The net input
is calculated between the input and hidden layer as,
n
z−inj = xi wij + b (2)
i=1
The net input between the hidden and the output layer is presented as
n
y−ink = zj vjk + b (3)
j=1
The error between the actual and the network output is represented as E, the error gradient and is estimated as,
n
2
1
E= yt arg et − ypredicted (4)
2
i=1
� �2
n
∂E ∂ 1 �
= ytarget − ypredicted (5)
∂vjk ∂vjk 2
i=1
1 ∂
= (yt arg et − f (y−ink ))2 (6)
2 ∂vjk
∂
= −[yt arg et − ypredicted ]f ′ (y−ink ) (y−ink ) (7)
∂vjk
= −[yt arg et − ypredicted ]f ′ (y−ink )zj (8)
δk = −[yt arg et − yprediced ]f ′ (y−ink ) (9)
∂E ∂
=− [yt arg et − ypredicted ] (yk ) (10)
∂wij ∂wij
k
∂
=− [yt arg et − ypredicted ]f ′ (y−ink ) (y−ink ) (11)
∂vjk
k
∂
=− δk vjk (zj ) (12)
∂vjk
k
′
=− δk vjk f (zinj )(xi ) (13)
k
′
δj = δk vjk f (zinj ) (14)
k
The change in weight vectors are presented as,
∂E
�wij = −α (15)
∂wij
�wij = αδk xi (16)
∂E
�vjk = −α
∂vjk (17)
�vij = αδj zj (18)
Scientific Reports | (2022) 12:186 | https://doi.org/10.1038/s41598-021-03879-4 7
Vol.:(0123456789)www.nature.com/scientificreports/
In Eqs. (15) through (18), ‘α’ denotes the learning rate , ‘ w ’ is the change in weight vector between input
and hidden layers and ‘ v ’ is the change in weight value between the hidden and the output layers, the new
weight vectors are updated as,
wij (t + 1) = wij (t) + �wij (19)
vjk (t + 1) = vjk (t) + �vjk (20)
The nonlinear transformation within deep layers is made by encoder and decoder based pre- training tech-
nique, and the output of one layer forms the input for the next layer. The encoder employs encoding function
over the incoming dataset and converts that into coded form, whereas the decoder at output side decodes the data
into its original form on utilizing decoding function. On fine-tuning the reconstruction error, the ‘loss function’
is estimated to handle the variation between the decoded and the encoded data. The encoding and decoding
function for the given dataset is presented as,
encoded_data = fϕ (x) (21)
The reconstructed dataset is presented as,
x̂ = gϕ (encoded_data) (22)
‘ fϕ ’ is the encoding function and ‘ gϕ ’ is the decoding function.
The encoding is made layer by layer, the encoded data of first layer is fed as input for second layer and likewise
the data which is encoded at last hidden layer is employed to find output at output layer. The error between the
encoded and decoded data is given by,
2
(23)
Eerror = x − x̂
Deep learning neural model in this research study is trained to minimize the loss function, which is the
objective function and is presented as,
N
1
δerror (x, x̂) = Eerror x i , gϕ ′ fϕ x i (24)
N
i=1
The next step of pre-training is the fine tuning by error back propagation, for the given input data the output
at output layer is given by,
youtput = fϕN+1 (enocoded_dataN ), (25)
where, the Nth encode vector at the last hidden layer is employed to present the final output of the trained
network model.
Radial basis functions that are employed as activation function in the designed new deep radial basis func-
tion neural network model are radially symmetric functions that get shifted by points in multidimensional
Euclidean space and then are linearly combined so that they result in data-dependent approximation spaces. The
applicability of the RBFNN with varied design of deep learning architecture increased the classification results
by decreasing the error rate with its best generalization ability, strong tolerance to the input signals and better
learning ability for image based data input signals presented to the network. The architecture of the deep learn-
ing model with the encoding and decoding with the fault tolerant radial basis function tends to make the neural
network converge with better classification results. The generalization and learning capability of the radially
symmetric radial basis function being used as the activation function in the deep learning model evolves better
output from each of the deep learning layers compared to other activation functions like tangential functions,
sigmoid functions, and other exponential functions. Hence this RBFNN with its radially symmetric activation
function has attained better classification results for the detection of tongue image datasets.
TCM based diabetes diagnosis in humans with proposed technique
In tongue image based diagnosing procedure the color of tongue should not be affected by image capturing sys-
tem, it should reflect all colours without any change from the actual image. The collected image is preprocessed
to balance the light illumination and the brightness of each image by means of image enhancement and noise
removal techniques. The image quality is enhanced by employing Gabor filter algorithm. All the images are
calibrated for color correction by histogram equalization technique and the tongue portion is alone segmented,
further the motion blur is avoided to improve the texture quality of the images.
The feature extraction is the next step to image pre-processing, numerous feature extraction strategies are
available in literatures, but in this research study convolutional neural network (CNN) is considered because dur-
ing image flattening the information may get lost in conventional techniques whereas the convolutional network
model retains the actual information without any loss, and it learn the features by itself. The 2D image is pro-
cessed as 3D matrix with RGB color channel as depth as shown in Fig. 4. The collected data samples are labeled
by TCM experts based on tongue color, texture, tooth markings, fur color and thickness, the features associated
with the patient records and are presented in Table 1. The extracted features of the tongue data samples such as
tongue color, red spots, black spots, Fissure, dry tongue, tooth markings, saliva, size, and fur are shown in Fig. 5.
Scientific Reports | (2022) 12:186 | https://doi.org/10.1038/s41598-021-03879-4 8
Vol:.(1234567890)www.nature.com/scientificreports/
Figure 4. RGB channels for few sample of panoramic tongue images.
Features Types Number of data samples Features Types Number of data samples
Medium 1332 Yes 1662
Teeth markings
Tongue body Enlarged 915 No 1013
Small 428 White 1203
Mild red 1400 Fur color Black 201
Red 677 Yellow 996
Tongue color
Pale 375 Normal 1884
Bluish 223 Saliva Dry 518
Red spots 1489 Wet 273
Black spots 1044 Thin 852
Tongue surface
Fissures 1038 Fur thickness Thick 1606
Petechiae 205 No fur 217
Table 1. Features associated with patient records.
Metrics employed for diabetic diagnosis model. To evaluate the effectiveness of the proposed diag-
nosis model, the performance metrics -accuracy, precision, sensitivity, specificity, F1 score and error rate are
evaluated. The accuracy represents how closely the true predictions are made by the proposed classifier, whereas
in medical decision making models in addition to accuracy, it is necessary to analyse how accurately the true
positive and true negative predictions are made. Because, the false prediction is highly dangerous in the field of
diagnosis, so in addition to accuracy, True Positive Rate and False Positive Rate are employed to illustrate the
effectiveness of the proposed diagnosis strategy.
Accuracy. Accuracy highlights the true positive and negative predictions of the model, the ratio between num-
ber of true positive and negative prediction to the total number of all samples is the accuracy.
TP + TN
Accuracy = (26)
TP + TN + FP + FN
Scientific Reports | (2022) 12:186 | https://doi.org/10.1038/s41598-021-03879-4 9
Vol.:(0123456789)www.nature.com/scientificreports/
Original
Tongue Image
Fissure
Red Spot
Black spot
Pale with Puffy with Thin with
fissure fissure & red fissured &
spots red spots
Figure 5. Extracted features of tongue image samples.
Precision. Precision is a measure of how accurate the model performs positive prediction, the ratio between the
correct positive predictions and the total number of positive prediction is the precision.
TP
Pr ecision = (27)
TP + FP
Recall or sensitivity. Sensitivity reflects what percent of true positive is presented as positive; mathematically it
is expressed as the ratio between the correct positive predictions and the sum of correct positive and false nega-
tive predictions. The higher the recall the higher the performance of the model.
TP
Sensitivity = (28)
TP + FN
Specificity. The measure that demonstrates what percent of true negative is identified as negative class by the
classification module, the higher the specificity higher the model performance.
TN
Specificity = (29)
TN + FP
F1 score. It ranges from 0 to 1, when F1 score increases the performance became better. The harmony between
the precision and recall is represented by the F1 score.
Scientific Reports | (2022) 12:186 | https://doi.org/10.1038/s41598-021-03879-4 10
Vol:.(1234567890)www.nature.com/scientificreports/
Predicted class
True outcome: diabetes identified
Actual class P (diabetes) N (non-diabetes)
P (diabetes) TP (diabetes patients identified as diabetes) FP (diabetes patients identified as non diabetes)
N (non-diabetes) FN (non-patients identified as diabetes) TN (non-diabetes patients identified as non-diabetes)
Table 2. Confusion matrix framework for diabetes diagnosis.
Parameters Parametric values
Learning rate 0.2
Number of epochs Until the network settles at convergence criterion
Convergence criterion 10–6
n
2
Loss function (mean square error)
yt − Ot
t=1
Learning rule Gradient Descent learning rule
Optimizer Ant colony optimizer
Activation function Gaussian function
Number of deep radial basis layers 5
Batch size 40 samples
Table 3. Parameters of the proposed deep neural model.
precision ∗ recall
F1 = 2 ∗ (30)
precision + recall
Error rate. Error rate is defined as ratio between the number of all the false predictions and the total number of
samples used in the model. The higher the error rate, then lower is the performance of the model.
FN + FP
Error rate = (31)
TP + TN + FP + FN
where, TP represents the True Positive, FP—False Positive, TN—True Negative, and FN—False Negative. The
metric results are evaluated based on the confusion matrix framed in Table 2.
Ethics approval and consent to participate. Necessary ethical standard was maintained in this research
study. All methods were carried out in accordance with relevant guidelines and regulations of Medical Council
of India.
All experimental protocols were approved by a Kalpana Hospitals, Coimbatore. Consent was obtained from
all subjects with the approval from Kalpana Hospital Authorities. “Written Informed Consent” has been obtained
from participants for whom tongue image datasets were attained. The methods were carried out based on the
norms and guidelines of Medical Council of India (MCI). Board of Council members (BCM) of the Kalpana
Hospital is the ethics committee that approved the study.
Results and discussions
Hybrid convolutional neural network with Deep RBFNN model is designed and simulated in this research
study for effective diabetes diagnosis and is performed in MATLAB R2019a environment in a Intel Quad Core
i7 processor with 3.9 GHz processor speed, 16 GB RAM on 64 bit operating system and with NVIDIA MX250
2 GB Graphics features. The input dataset is preprocessed by employing Gabor filter, the color calibration is done
with histogram equalization algorithm. The tongue segment is extracted from the original images and fed into
ResNet-50 for feature extraction. The features such as the tongue size, shape, fissure, saliva, red spots and black
spots are extracted and presented in Fig. 5. Table 3 lists the parametric values of the proposed deep RBFNN
model designed for classifying diabetes mellitus.
The color of the tongue indicates the blood and Qi (Energy) flow through the body, if the tongue appears to
be red then it indicates excess flow of heat, when it is pale then it represents deficiency of heat and deficiency
of blood, hence this imbalance of energy causes problems in intestine and pancreas. The shape of the tongue
also reflects the working of digestive and pancreas, normally the shape will neither be thin nor be thick, and the
characteristics such as swollen (larger and thicker) or puffy tongue indicates the Qi and excess fluid accumula-
tion. The swollen tongue are usually associated with tooth markings that shows the Yang deficiency, the tooth
markings for sample of dataset is presented in Fig. 6.
Scientific Reports | (2022) 12:186 | https://doi.org/10.1038/s41598-021-03879-4 11
Vol.:(0123456789)www.nature.com/scientificreports/
Figure 6. Tooth markings of tongue images.
Figure 7. Fur layer extraction of the considered tongue images.
The longitudinal and transverse cracks that groves into the surface of tongue is fissures, if the tongue is fissured
and red in color that shows high accumulation of heat, the light fissured tongue indicates the Yin deficiency and
the location of the fissure represents an affected organ. If the fissure gets developed in the middle of the tongue,
it shows the stomach Yin deficiency; if the sides of the tongue have fissures then the spleen Yin deficiency is
reported. The fur is the another feature that has great impact on diabetes, the surface of normal tongue is nor-
mally covered with thin white layer, but because of imbalance between Yin-Yang, the layer of tongue appears to
be thick fine hair like structure. In Fig. 7, the fur layer is extracted and shown, fur may be white, yellow, black,
brown or black, the thickness of fur and color of the fur is considered to be major factor for diabetes diagnosis.
In this research paper, fivefold cross-validation is conducted and once 25% data are used for testing, the
remaining 25% is equally divided into five equal parts. Hence, the training and validation process are performed
in 5 iterations and in each iteration 4 parts are employed for training and 1 part is employed for validation. Fig-
ure 8 presents the fivefold cross validation employed for diagnosis of diabetes mellitus.
In the proposed study of 2675 participants, 49.80% of peoples have medium sized tongue, 34.21% peoples
have enlarged tongue and 15.98% peoples have small sized tongue. The color of the tongue represents the ‘Qi’
and blood flow in the body, about 52.34% of peoples shows mild red color tongue, 25.30% reported red color,
14.00% have pale colored tongue and 8.30% shows bluish tongue. On investigating the tongue surface, about
55.66% peoples have red spots, 39.02% peoples have black spots, 38.80% peoples shown fissures, and 7.66% of
Scientific Reports | (2022) 12:186 | https://doi.org/10.1038/s41598-021-03879-4 12
Vol:.(1234567890)www.nature.com/scientificreports/
Tongue image datasets
Fold 1 Validation Training Training Training Training
Fold 2 Training Validation Training Training Training
Fold 3 Training Training Validation Training Training
Fold 4 Training Training Training Validation Training
Fold 5 Training Training Training Training Validation
Data Split into five partitions
Figure 8. Fivefold cross validation for diagnosis of diabetes mellitus.
Model Accuracy Precision Sensitivity Specificity F1Score Error rate
ResNet50 0.929 0.961 0.956 0.776 0.958 0.071
ResNet50-RBFNN 0.944 0.968 0.965 0.819 0.967 0.056
ResNet50-DeepRBFNN 0.984 0.989 0.991 0.943 0.990 0.016
Table 4. Classification performance of the proposed model.
peoples shown petechiae. About 62.14% of participants have tooth markings. About 44.97% of peoples shown
white color fur, 7.50% participants have black colored fur, 37.24% peoples have yellow fur. The fur thickness is
one of main feature employed for diabetes diagnosis, about 31.85% of participants had thin fur, 60.04% had thick
fur and 8.11% had no fur. On analyzing the dryness of the tongue, 72.59% peoples have normal tongue, 19.35%
reported dry tongue and 8.05% of peoples reported wet tongue.
The features selected and extracted by the ResNet-50 is passed into the developed Deep RBFNN model
for performing classification; the deep RBFNN model is designed with 8 input neurons corresponding to the
features such as tongue color, shape, fur color, fur thickness, tongue spots, saliva, fissures, and teeth markings.
The hidden layer fixation and hidden neuron fixation is inevitable and significant step in framing of network
architecture. The inadequate number of hidden layers and hidden neurons affects the training accuracy, whereas
higher their number increase the complexity of the network and cause over-fitting issue so it is necessary to fix
optimal number of hidden layers and hidden neurons. Based on trial and error method the hidden layers are
fixed to 7 with neurons of 3–5–7–5-3–4–3 in each layer. The output layer has neurons of 2 units that demonstrate
whether the input image falls in diabetes class or non-diabetes class. The classification performance is evaluated
by the metrics given through Eq. (26) through (31). Table 4 shows the performance metric values of the proposed
hybrid CNN—Deep RBFNN learning diabetes classification module.
The training and testing performance is presented in Table 5, the performance of the proposed model is
investigated by employing ResNet-50 for classifying the dataset and it reported classification accuracy of 0.885 for
training and 0.929 for testing. To improve the classification performance, the last layer of ‘soft-max’ is removed,
the flattened data is fed into the RBFNN model with traditional learning strategy and the classification metric
results are reported. Table 6 presents the training and testing mean square error elapsed with respect to the
number of epochs.
On comparing with conventional CNN model, the RBFNN incorporated strategy improved accuracy, true
positive prediction rate, true negative prediction rate whereas the error rate is significantly reduced than the
Scientific Reports | (2022) 12:186 | https://doi.org/10.1038/s41598-021-03879-4 13
Vol.:(0123456789)www.nature.com/scientificreports/
Model Training accuracy (%) Testing accuracy (%)
ResNet50 0.885 0.929
ResNet50-RBFNN 0.923 0.944
ResNet50-Deep RBFNN 0.989 0.984
Table 5. Training and Testing Performance of the model.
Training variations Testing variations
Number of epochs Mean square error Number of epochs Mean square error
10 2.1629 10 3.0128
20 1.4127 20 2.7219
30 1.0054 30 2.2209
40 0.0061 40 1.7286
50 0.00175 50 0.09963
56 0.00034 60 0.01692
73 0.00721
The neural model got converged at 56th epoch in the training process
The trained neural model got converged at 73rd epoch in the testing process
Table 6. Error variations based on number of epochs evolved.
1.2
1
0.8
0.6
0.4
0.2
0
Accuracy Precision Sensitivity Specificity F1Score Error rate
ResNet50-DeepRBFNN ResNet50-RBFNN ResNet50
Figure 9. Performance analysis of the proposed diabetes diagnosis in humans.
strategy when ResNet-50 alone is employed for diabetes diagnosis as depicted in Fig. 9. The training accuracy of
ResNet50-RBFNN model is 92.3% and the testing accuracy is 94.4%. To further enhance the model performance
deep learning strategy has been employed, here the training is preformed based on auto-encoder based learn-
ing algorithm and the model reports significant improvement in diagnosis performance with training accuracy
of 98.9% and testing accuracy of 98.4%, the error rate has been reduced with the value of 0.071. The ROC plot
depicting the behaviour of the proposed model is shown in Fig. 10.
The performance of the proposed ResNet50-Deep RBFNN for diabetes classification is compared with existing
works of literature17,18,27,29,43–48, such as ResNet34, AlexNet, SqueezeNet and SVM based strategy and obtained
metric results are presented in Table 7. The performance of proposed Deep RBFNN with ResNet50 architecture
significantly improved the performance than that of the other deep networks such as AlexNet, SqueezeNet, and
Scientific Reports | (2022) 12:186 | https://doi.org/10.1038/s41598-021-03879-4 14
Vol:.(1234567890)www.nature.com/scientificreports/
Figure 10. ROC plot for the deep RBFNN diabetes diagnosis model.
Classification models Accuracy Precision Sensitivity Specificity F1 Score Error rate Computational time (min)
PCA- GA-SVM—Zhang
0.670 0.669 0.769 0.555 0.715 0.329 2.01
et al.17
Non-invasive approach—
0.763 0.691 0.728 0.607 0.774 0.317 3.46
Zhang 43
Greedy Snake Algorithm—
0.801 0.760 0.803 0.669 0.792 0.258 3.19
Naveed and Geetha 44
ResNet 34—Wang et al. [27] 0.875 0.890 0.907 0.826 0.898 0.125 3.24
SqueezeNet—Wu et al.29 0.856 0.865 0.899 0.793 0.882 0.143 3.31
AlexNet—Huo et al.18 0.863 0.870 0.905 0.801 0.887 0.137 3.27
Random forest algorithm—
0.877 0.881 0.893 0.829 0.890 0.133 3.07
Xiang et al.45
46
Stacking model—Li et al. 0.892 0.894 0.912 0.850 0. 917 0.119 3.61
GA_XGBT approach—Li
0.906 0.911 0.899 0.872 0.934 0.103 3.57
et al.47
SVM classifiers—Sagayaraj
0.927 0.932 0.945 0.917 0.955 0.085 3.41
et al.48
Proposed ResNet50-Deep
0.984 0.989 0.991 0.943 0.990 0.016 3.50
RBFNN model
Table 7. Comparative analysis with previous works.
ResNet34 models employed for diabetes classification. It is noted that the accuracy of the proposed model is better
than that of ResNet 34 with 10.9%, 12.8% than the SqueezeNet and 12.1% than that of AlexNet. The precision
of the deep proposed RBFNN model is significantly improved with the value of 9.9% than the ResNet 34, 12.4%
than the SqueezeNet and 11.9% than the AlexNet.
The sensitivity employing the proposed ResNet50-Deep RBFNN model is higher than that of ResNet-34 by
8.4%, SqueezeNet by 9.2% and AlexNet by 8.6%. The specificity of the proposed model is better than that of other
deep networks with the rate of 11.7% than the ResNet, 15% than the SqueezeNet and 14.2% than of AlexNet.
The F1 Score of the Deep RBFNN with Resnet 50 framework is 9.2% better than that of ResNet 34, 10.8% than
the SqueezeNet and 10.3% than the AlexNet. The error rate of the proposed model is greatly reduced than the
other deep neural nets and the performance is significantly higher than that of SVM based strategy17. The com-
putational time of SVM is better than that of deep neural networks, but the classification performance is not to
the desired level. So, on considering the deep neural networks the proposed Deep RBFNN model has average
computational time of 23 s higher than that of other deep nets, but the metric values is significantly improved
than that of other deep networks.
Scientific Reports | (2022) 12:186 | https://doi.org/10.1038/s41598-021-03879-4 15
Vol.:(0123456789)www.nature.com/scientificreports/
Models under comparison p-value Statistical result
ResNet50- Deep RBFNN vs ResNet 50 0.0347 Null hypothesis rejection
ResNet50-Deep RBFNN vs ResNet50-RBFNN 0.0421 Null hypothesis rejection
Table 8. Significance test with level of significance 0.05.
The significance of the proposed diagnosis strategy over other previous models is demonstrated by performing
statistical analysis49,50. The significance analysis is presented based on 5 × 2 CV test, where the entire dataset is
segmented into 5 folds and iterated for five times. At each iteration, the training and testing datasets are rotated.
Considering two models the performance is compared by,
AccA = AccA,Model−1 − AccA,Model−2 (32)
AccB = AccB,Model−1 − AccB,Model−2 (33)
The mean and variance of difference is evaluated,
Accavg = (AccA + AccB )/2 (34)
σ 2 = (AccA − Accavg )2 + (AccB − Accavg )2 (35)
The ‘t’ statistics is evaluated after 5 iterations and is as follows:
AccA,1
t=
(36)
(1/5) 5i=1 σi2
where, ′ AccA,1
′ indicates the accuracy of first iteration of ‘A’ sample.
The ‘t’ distribution with 5 degrees of freedom is followed by ‘t’ statistics, the p-value is estimated and compared
with the level of significance α = 0.05 in order to illustrate the level of hypothesis and is presented in Table 8. The
proposed ResNet-50 Deep RBFNN model has null hypothesis rejection with ResNet50 and ResNet50-RBFNN
models proving its better classification performance.
Conclusion
In this research study, a non-invasive technique of diabetes diagnosis based on TCM was developed by employing
deep auto encoder learning algorithm with CNN networks. The tongue being the index of internal organs, its
characteristics such as texture, geometry, and color depicts the balance that exists between the five element theory
and Yin-Yang concept of TCM. The deep features of panoramic tongue images were extracted by CNN-ResNet
50 architecture and the extracted features are trained with Deep RBFNN classifier model. The performance of
the proposed model is compared with other existing works of literature such as ResNet 34, AlexNet, SqueezeNet
and it was investigated that the proposed deep RBFNN model has shown improved performance with better
classification accuracy and reduced error rate. The significance of the proposed model as well was analysed based
on 5 × 2 CV test and it was demonstrated that the proposed model statistically fits to perform diabetes diagnosis.
Received: 22 July 2021; Accepted: 6 December 2021
References
1. Saeedi, P. et al. Global and regional diabetes prevalence estimates for 2019 and projections for 2030 and 2045: Results from the
International Diabetes Federation Diabetes Atlas. Diabetes Res. Clin. Pract. 157, 107843 (2019).
2. Ljubic, B. et al. Predicting complications of diabetes mellitus using advanced machine learning algorithms. J. Am. Med. Inform.
Assoc. 27(9), 1343–1351 (2020).
3. Dong, J. The relationship between traditional Chinese medicine and modern medicine. Evid.-Based Complem. Altern. Med. (2013).
4. Lo, L. C., Cheng, T. L., Chen, Y. J., Natsagdorj, S. & Chiang, J. Y. TCM tongue diagnosis index of early-stage breast cancer. Complem.
Ther. Med. 23(5), 705–713 (2015).
5. Xie, J. et al. Feature selection and syndrome classification for rheumatoid arthritis patients with traditional Chinese medicine
treatment. Eur. J. Integr. Med. 34, 101059 (2020).
6. Sang, X., Wang, Z., Liu, S. & Wang, R. Relationship between traditional Chinese medicine (TCM) constitution and TCM syndrome
in the diagnosis and treatment of chronic diseases. Chin. Med. Sci. J. 33(2), 114–119 (2018).
7. Buditjahjanto, I. G. P., Rochmawati, N. & Peni, R. H. Classification of lung disease syndromes in traditional Chinese medicine
based on learning vector quantization. Adv. Sci. Lett. 23(12), 11879–11883 (2017).
8. Cao, M. et al. The advances of traditional Chinese medicine in the treatment of liver diseases in 2019. Tradition. Med. Res. 5(4),
261 (2020).
9. Bai, F. X. & Huang, Y. H. Research progress of TCM tongue diagnosis in spleen and stomach disease. Psychosom. Med. Res. 2(1),
19–24 (2020).
10. Zhang, B., Kumar, B. V. & Zhang, D. Detecting diabetes mellitus and nonproliferative diabetic retinopathy using tongue color,
texture, and geometry features. IEEE Trans. Biomed. Eng. 61(2), 491–501 (2013).
11. Li, H., Zhang, X., Hu, G. & Sun, Y. The improvement of the tooth-marked recognition method on the tongue images. in 2013 ICME
International Conference on Complex Medical Engineering. 412–415. (IEEE, 2013).
Scientific Reports | (2022) 12:186 | https://doi.org/10.1038/s41598-021-03879-4 16
Vol:.(1234567890)www.nature.com/scientificreports/
12. Wang, X., Zhang, B., Yang, Z., Wang, H. & Zhang, D. Statistical analysis of tongue images for feature extraction and diagnostics.
IEEE Trans. Image Process. 22(12), 5336–5347 (2013).
13. Wang, H., Zhang, X. & Cai, Y. Research on teeth marks recognition in tongue image. in 2014 International Conference on Medical
Biometrics. 80–84. (IEEE, 2014).
14. Shao, Q., Li, X. & Fu, Z. Recognition of teeth-marked tongue based on gradient of concave region. in 2014 International Conference
on Audio, Language and Image Processing. 968–972. (IEEE, 2014).
15. Preshiya, D. J. Diagnosing diabetics with reflex zones of the tongue using colour image segmentation. J. Chem. Pharm. Res. 7(2),
876–881 (2015).
16. Kawanabe, T. et al. Quantification of tongue colour using machine learning in Kampo medicine. Eur. J. Integr. Med. 8(6), 932–941
(2016).
17. Zhang, J. et al. Diagnostic method of diabetes based on support vector machine and tongue images. BioMed Res. Int. (2017).
18. Huo, C.M. et al. Tongue shape classification integrating image preprocessing and convolution neural network. in 2017 2nd Asia-
Pacific Conference on Intelligent Robot Systems (ACIRS). 42–46. (IEEE, 2017).
19. Zhang, B., Wang, X., You, J. & Zhang, D. Tongue color analysis for medical application. Evid.-Based Complem. Altern. Med. (2013).
20. Zhang, D., Zhang, H., & Zhang, B. Tongue Color Analysis for Medical Application. InTongue Image Analysis. 207–223. (Springer,
2017).
21. Tania, M. H., Lwin, K. & Hossain, M. A. Advances in automated tongue diagnosis techniques. Integr. Med. Res. 8(1), 42–56 (2019).
22. Joshi, T. N. & Chawan, P. P. M. Diabetes prediction using machine learning techniques. Ijera 8(1), 9–13 (2018).
23. Li, X., Zhang, Y., Cui, Q., Yi, X. & Zhang, Y. Tooth-marked tongue recognition using multiple instance learning and CNN features.
IEEE Trans. Cybern. 49(2), 380–387 (2018).
24. Srividhya, E. & Muthukumaravel, A. Diagnosis of diabetes by tongue analysis. in 2019 1st International Conference on Advances
in Information Technology (ICAIT). 217–222. (IEEE, 2019).
25. Shen, H. M., Ge, D., Lian, C. & Yue, Y. Passive magnetic localization based on connotative pre-calibration for tongue-machine-
interface. IEEE Access 8, 2382–2394 (2019).
26. Thirunavukkarasu, U., Umapathy, S., Krishnan, P.T. & Janardanan, K. Human tongue thermography could be a prognostic tool
for prescreening the type II diabetes mellitus. Evid.-Based Complem. Altern. Med. (2020).
27. Wang, X. et al. Artificial intelligence in tongue diagnosis: Using deep convolutional neural network for recognizing unhealthy
tongue with tooth-mark. Comput. Struct. Biotechnol. J. (2020).
28. Naveed, S. Early diabetes discovery from tongue images. Comput. J. (2020).
29. Wu, L., Luo, X. & Xu, Y. Using convolutional neural network for diabetes mellitus diagnosis based on tongue images. J. Eng.
2020(13), 635–638 (2020).
30. Lim, W.X., Chen, Z., Ahmed, A., Chandesa, T. & Liao, I. A Review of Machine Learning Techniques for Applied Eye Fundus and
Tongue Digital Image Processing with Diabetes Management System. arXiv preprint 2012.15025 (2020).
31. Vijayalakshmi, A., Shahaana, M., Nivetha, N.C.D. & Subramaniam, K. Development of prognosis tool for type-II diabetics using
tongue image analysis. in 2020 6th International Conference on Advanced Computing and Communication Systems (ICACCS).
617–619. (IEEE, 2020).
32. Yuan, Y. & Liao, W. Design and implementation of the traditional Chinese medicine constitution system based on the diagnosis
of tongue and consultation. IEEE Access (2020).
33. Xu, Q. et al. Multi-task joint learning model for segmenting and classifying tongue images using a deep neural network. IEEE J.
Biomed. Health Inform. 24(9), 2481–2489 (2020).
34. Tang, W. et al. An automatic recognition of tooth-marked tongue based on tongue region detection and tongue landmark detection
via deep learning. IEEE Access 8, 153470–153478 (2020).
35. Selvarani, A. & Suresh, G.R. Decision support system for diabetes using tongue images. in 2020 International Conference on Com-
munication and Signal Processing (ICCSP). 0012–0016. (IEEE, 2020).
36. Zou, Q. et al. Predicting diabetes mellitus with machine learning techniques. Front. Genet. 9, 515 (2018).
37. Mujumdar, A. & Vaidehi, V. Diabetes prediction using machine learning algorithms. Proc. Comput. Sci. 165, 292–299 (2019).
38. Peng, W. K., Chen, L., Boehm, B. O., Han, J. & Loh, T. P. Molecular phenotyping of oxidative stress in diabetes mellitus with point-
of-care NMR system. NPJ Aging Mech. Dis. 6(1), 1–12 (2020).
39. Peng, W. K., Ng, T. T. & Loh, T. P. Machine learning assistive rapid, label-free molecular phenotyping of blood with two-dimensional
NMR correlational spectroscopy. Commun. Biol. 3(1), 1–10 (2020).
40. Gabhale, B., Shinde, M., Kamble, A. & Kulloli, M. Tongue image analysis with color and gist features for diabetes diagnosis. Int.
Res. J. Eng. Technol. 4, 523–526 (2017).
41. Hsu, P. C. et al. The association between arterial stiffness and tongue manifestations of blood stasis in patients with type 2 diabetes.
BMC Complement. Altern. Med. 16(1), 324 (2016).
42. Craddock, R.J., & Warwick, K. Multi-layer radial basis function networks. An extension to the radial basis function. in Proceedings
of International Conference on Neural Networks (ICNN’96). Vol. 2. 700–705. (IEEE, 1996)
43. Zhang, B. Tongue pattern recognition to detect diabetes mellitus and non-proliferative diabetic retinopathy. in Pattern Recognition
and Big Data. 663–686. (2017).
44. Naveed, S. & Geetha, G. Intelligent diabetes detection system based on tongue datasets. Curr. Med. Imaging 15(7), 672–678 (2019).
45. Xiang, Y. et al. Artificial intelligence-based diagnosis of diabetes mellitus: Combining fundus photography with traditional Chinese
medicine diagnostic methodology. BioMed. Res. Int. (2021).
46. Li, J. et al. Establishment of noninvasive diabetes risk prediction model based on tongue features and machine learning techniques.
Int. J. Med. Inform. 149, 104429 (2021).
47. Li, J. et al. A tongue features fusion approach to predicting prediabetes and diabetes with machine learning. J. Biomed. Inform.
115, 103693 (2021).
48. Sagayaraj, A.S., Kabilesh, S.K., Kumar, A.A., Gokulnath, S., Mani, T. & Dinakaran, K. Diabetes mellitus and diabetic retinopathy
detection using tongue images. J. Phys. Conf. Ser. 1831(1), 012028 (2021). (IOP Publishing).
49. Deepa, S. N. & Devi, B. A. A survey on artificial intelligence approaches for medical image classification. Indian J. Sci. Technol.
4(11), 1583–1595 (2011).
50. Nachimuthu, D. S. & Baladhandapani, A. Multidimensional texture characterization: on analysis for brain tumor tissues using
MRS and MRI. J. Digit. Imaging 27(4), 496–506 (2014).
Acknowledgements
The authors thank the Chief Executive Officer of Kalpana Hospitals, Coimbatore, India for providing the tongue
image datasets for this research study.
Author contributions
S.B. collected the panoramic image datasets and removed noise and extracted the prominent features to feed
it into the classifier model. V.J. devised the classifier models and performed simulation to test the developed
Scientific Reports | (2022) 12:186 | https://doi.org/10.1038/s41598-021-03879-4 17
Vol.:(0123456789)You can also read