PILOT STUDY UPPER AUSTRIA - MODELING OF PLUVIAL FLOODS IN RESPONSE TO HEAVY PRECIPITATION EVENTS GUIDANCE FOR PRACTITIONERS - Interreg CENTRAL EUROPE
←
→
Page content transcription
If your browser does not render page correctly, please read the page content below
PILOT STUDY UPPER AUSTRIA
MODELING OF PLUVIAL FLOODS IN RESPONSE
TO HEAVY PRECIPITATION EVENTS
GUIDANCE FOR PRACTITIONERS
Stefan Achleitner1, Andreas Huber1, Simon Lumassegger1, Bernhard Kohl2,
Yvonne Spira3, Felix Weingraber4
1)
     Universität Innsbruck AB Wasserbau, 2) Institut für Naturgefahren, BFW - Bundesforschungs- und Ausbildungszentrum

für Wald, Naturgefahren und Landschaft, 3) Umweltbundesamt, 4) Land Oberösterreich Gruppe Schutzwasserwirtschaft

Our Project is funded by the Interreg CENTRAL EUROPE Programme that encourages
cooperation on shared challenges in central Europe and is supported under the
European Regional Development Fund.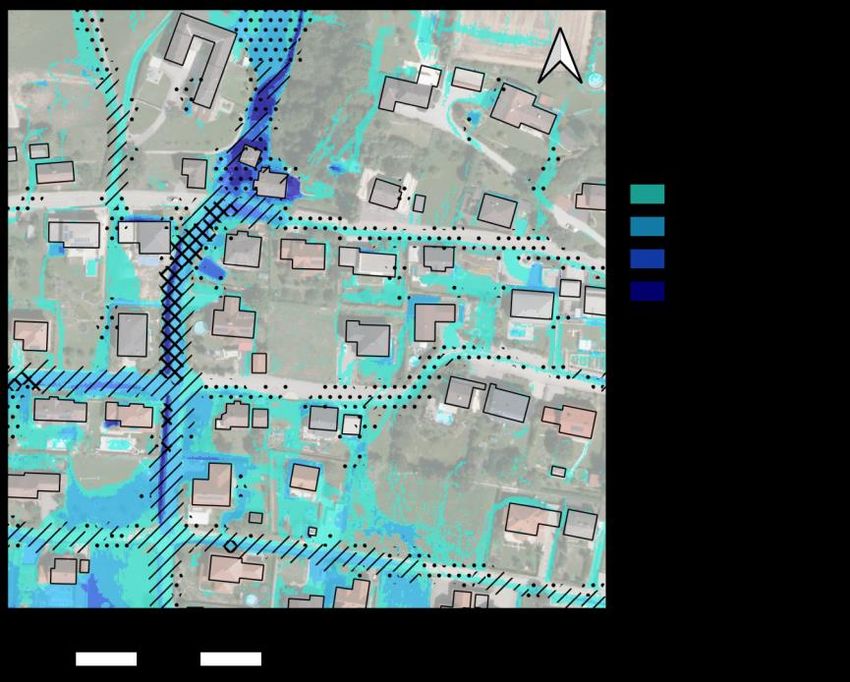
Modeling of surface runoff – Guidance for Practitioners

Pilot study Upper Austria
Modeling of pluvial floods in response to heavy precipitation
events
Guidance for practitioners

version 1              19.06.2020
                       Stefan Achleitner1, Andreas Huber1, Simon Lumassegger1, Bernhard Kohl2, Yvonne
authors
                       Spira3, Felix Weingraber4
                       1)
                           Universität Innsbruck AB Wasserbau, 2) Institut für Naturgefahren, BFW -
                       Bundesforschungs- und Ausbildungszentrum für Wald, Naturgefahren und Landschaft
                       3)
                          Umweltbundesamt, 4) Land Oberösterreich Gruppe Schutzwasserwirtschaft

Contractor

Contracting institutions

co-funded by

with contributions from

Simulations in this study were performed with different two-dimensional hydrodynamic software packages. Licenses for Hydro_AS-2D
and FloodArea were thankfully provided by Hydrotec and Geomer. Simulations with the software JFlow have been conducted by the
Brandverhütungsstelle Oberösterreich for selected scenarios; results of the model runs have been provided for analysis within the
pilot study.

This document and an extended technical report are also available in german language.

                                                                                                                          Seite 2
Modeling of surface runoff – Guidance for Practitioners

Table of Contents

1. GENERAL BACKGROUND AND AIM OF THIS DOCUMENT                                              4

2. TWO-DIMENSIONAL HYDRODYNAMIC MODELS                                                      5

3. DESIGN-PRECIPITATION AND CLIMATE-CHANGE ASPECTS                                          7

4. TOPOGRAPHY, COMPUATIONAL GRIDS/MESHES                                                    9
      4.1. Topography / Digital Terrain Model                                               9
      4.2. Raster                                                                         10
      4.3. Flexible Mesh                                                                  11

5. MODELING OF HYDRAULICALLY RELEVANT STRUCTURES                                          13
      5.1. Buildings                                                                      13
      5.2. Property fencing, walls                                                        13
      5.3. Culverts                                                                       14
      5.4. Urban drainage system, sewers                                                  15

6. SURFACE ROUGHNESS / FLOW RESISTANCE                                                    16

7. HYDROLOGICAL MODELING                                                                  20

8. CARTOGRAPHIC PRESENTATION OF RESULTS                                                   21
      8.1. Illustration of maximum water-depths hmax                                      21
      8.2. Illustration of maximum water-depths hmax and maximum flow velocities vmax     21
      8.3. Summary – cartographic presentation                                            23

9. PLAUSIBILITY CHECKS AND FINAL REMARKS                                                  24

10. REFERENCES                                                                            25

RAINMAN KEY FACTS                                                                         28

                                                                                        Seite 3
Modeling of surface runoff – Guidance for Practitioners

1. General Background and aim of this document
In recent years, floods caused by surface water runoff as a direct result of heavy rainfall events have
gained increasing attention from public, media and science in Austria and neighbouring countries (e.g.
Achleitner et al., 2020a; LUBW, 2016; Bernet et al., 2017; Lumassegger et al., 2016a, b; Zahnt et al.,
2018; Kipfer et al., 2018; Starl, 2020). Corresponding damage events have repeatedly been observed as a
result of small-scale heavy rainfall in the recent past. In contrast to floods along rivers (fluvial floods),
floods caused by surface runoff in response to heavy rainfall are not restricted to relatively well delimited
areas along existing watercourses. These so-called pluvial floods typically occur with short lead times and
in many cases far away from water bodies (Strehz et al. 2015). Potentially all regions of Austria are at
risk; the exact place and time of occurrence is difficult to predict. Current studies in the field of climate-
change research also suggest that the precipitation intensities of intense, short-duration heavy rainfall
events may further increase in the future (e.g. Formayer and Kromp-Kolb, 2009; Berg et al., 2013; Nissen
and Ulbrich, 2017; Giorgi et al., 2019; Becker, 2019). Information on potential hazards of pluvial floods is
accordingly of great interest for future construction projects and the implementation of protective and
precautionary measures for existing infrastructure (Humer, et al. 2015; Achleitner et al., 2020a).
Over the last years, various methods to assess the risk of flooding by surface runoff after heavy rainfall
events have been proposed and applied (e.g. Falconer et al., 2009; Fritsch et al., 2016; Humer et al.,
2015). An initial assessment of the hazard situation can often be based on local expertise and the analysis
of past events. Known and obvious problem areas can be identified with this method, but the informative
value with regard to possible future or previously unobserved hazard areas is limited. A topographic
analysis of digital terrain models with the help of geographic information systems can additionally provide
information on preferential flow paths and possible neuralgic points (e.g. terrain depressions,
underpasses, possible entry points of concentrated surface runoff into the settlement area) in the study
area. However, for a detailed analysis of the hazard of pluvial flooding, a computer-aided two-
dimensional hydrodynamic hazard analysis must now be regarded as state of the art.
Hazard assessment aided by two-dimensional hydrodynamic simulation models has some advantages over
purely topographical-based methods. The temporal evolution of water levels and flow velocities in
response to different precipitation events and other boundary conditions (antecedent soil moisture,
hydraulic structures, etc.) can be modeled; this is especially useful for analyses of different scenarios.
By now an increasing number of two-dimensional hydrodynamic models are available on the market. The
available software products are based on varying model-approaches and offer different functionalities.
Besides software choice, the quality and informative value of model results is also greatly influenced by
the available data, made assumptions and specific calculation methods employed.
Within the framework of the research project RAINMAN, different software packages for the modeling of
pluvial floods in rural areas were applied and investigated in Upper Austrian study areas. This document is
intended to provide practice-oriented assistance for the modeling of pluvial floods in rural areas using
two-dimensional hydrodynamic models. The recommendations given are based on the work conducted and
experiences gained within the RAINMAN pilot study Upper Austria.

                                                                                                        Seite 4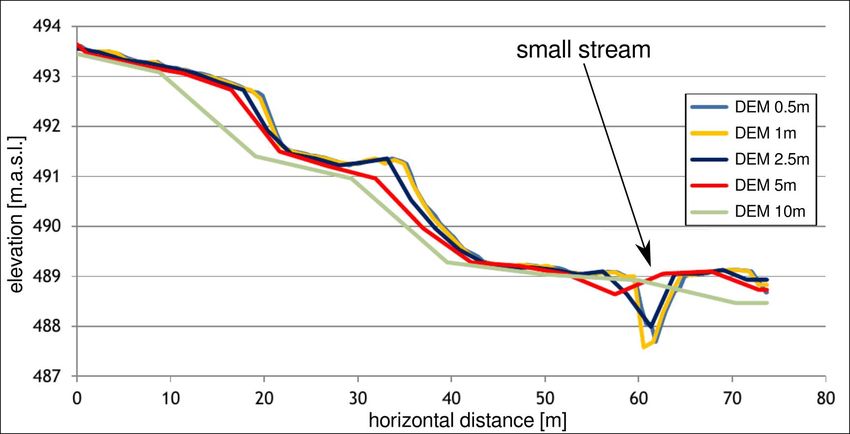
Modeling of surface runoff – Guidance for Practitioners
2. Two-dimensional hydrodynamic models
A growing number of software packages are now available for the two-dimensional hydrodynamic
numerical modeling of surface water flows. The available models differ with respect to the basic
hydrodynamic equations used (full shallow water equations, simplified hydraulic calculation approaches),
the geometry of the used computational mesh (e.g. unstructured meshes, grid-based) and their licensing
(open-source, freeware, commercial). With regard to hazard analysis for heavy rainfall events, the
different software products also offer a varying number of additional functionalities, such as the
possibility for considering precipitation as a boundary condition, coupling to urban drainage models or
functionalities for the modeling of runoff generation processes (i.e. hydrologic model approaches).
The suitability of models for a specific application can in principle be checked by means of so-called
benchmark tests. In these tests, the results of a model for standardized calculation examples are
compared with a-priori known results (either theoretically or analytically known results, or results of
comparable models). Within the framework of RAINMAN, selected benchmark examples (see Neelz and
Pender 2013) were recalculated with four software packages (Hydro_AS-2D, TELEMAC2D, HEC-RAS 2D,
FloodArea). For the software package JFlow the results of the benchmark tests were already available in
Neelz and Pender (2013). In a nutshell, differences between the results of different models can be
observed in the range of up to a few cm in modeled water levels under the same initial and boundary
conditions. This was also found by Broich et al. (2018) in similar investigations. The differences in results
between different models can, among others, be attributed to the following non-exhaustive points:
Model choice (the used hydrodynamic equations and their respective numerical implementation
can vary between different models)
Choice of numerical model parameters (e.g. the length of calculation time-steps, cfl-thresholds,
etc.) has an influence on model results.
Different types of computational meshes used by the models (flexible meshes, raster-grids) and
different methods for mesh generation can affect model results.
A sufficiently accurate representation of hydrodynamic processes can be evaluated by the application of a
selected model to existing benchmarks. However, with respect to practical model applicability also
additional criteria are important. Within the context of pluvial flood modeling in rural areas these further
criteria are decisive:
The possibility of the model to accept precipitation as boundary condition
o Can the model use precipitation with varying intensities over time as a boundary
condition?
o Is the model able to handle spatially non-uniform precipitation as an input?
Methods for modeling of vertical hydrologic processes
o Are calculation-methods for surface runoff generation implemented in the software? If
any, which method(s) are used in the model code?
o Are there alternative means to consider vertical hydrologic processes in the model (e.g.
node or cell-wise definition of net-precipitation as source terms, …)?
Implementation of hydraulically relevant structures
o Is it possible to consider walls, culverts or similar structures in the model software and
which methods are available?
Seite 5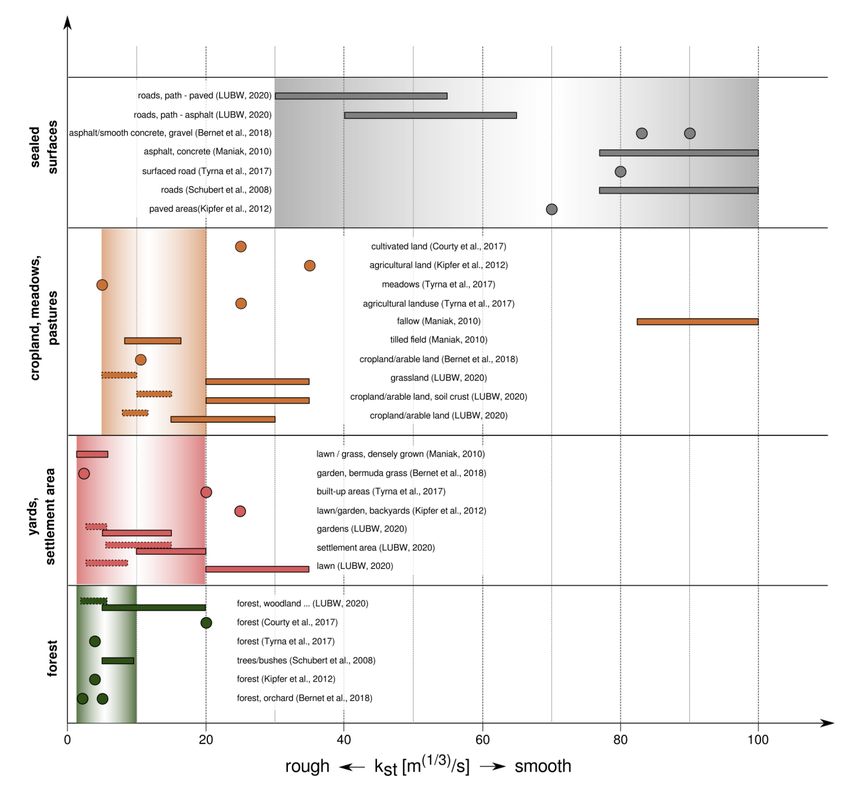
Modeling of surface runoff – Guidance for Practitioners

The choice of a suitable software package for heavy rainfall or pluvial flood hazard assessment depends,
of course, on the practical problem to be answered. Many raster-based models have the advantage of a
simpler preprocessing (mesh generation is straight forward in most cases), the usually shorter
computational times and, in many cases, the ability to handle larger model areas in a single model run. In
contrast, models working with unstructured meshes offer more flexibility with regard to mesh generation
and possibilities to implement hydraulically relevant structures in the model. Often this comes at the
expense of more elaborate preprocessing and longer computational times.
For pluvial flood modeling the ability of a model to handle temporally and spatially varying precipitation
as a boundary condition seems critical from the authors view-point. If spatially and temporally uniform
precipitation can be defined as a boundary condition, hydrologic runoff generation processes can also be
considered outside the model in a separate step and the model can be forced with net-rainfall. For model
applications in predominately urban areas also the possibility of coupling the surface hydraulics to urban-
drainage models can be of interest.
Table 1 provides an overview of software packages that were examined to a varying level of detail in the
course of the RAINMAN pilot study Upper Austria. A more detailed Table and an elaborate description of
the conducted investigations can be found in the corresponding technical report, which is available in
German (Achleitner et al., 2020b).
Table 1: Software packages, which were used in the RAINMAN pilot study Upper Austria

                                                                                                     Seite 6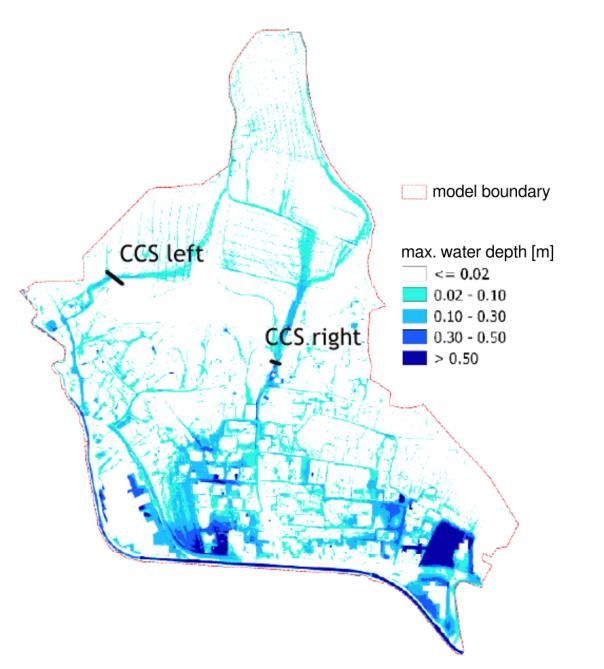
Modeling of surface runoff – Guidance for Practitioners

3. Design-precipitation and climate-change aspects
Observations of pluvial floods in different areas of Upper Austria in the summer of 2016, as well as
experiences from other regions, suggest that intensive precipitation events with typically short duration
act as a trigger for this type of flood events in many cases (Achleitner et al., 2020a; Lumassegger et al.,
2016a, b; Strehz, A., 2015).
The Federal Government of Upper Austria therefore suggests using a reference design-precipitation event
with the duration of 60min and a statistical return-interval of 100years as a base for the preparation of
hazard indicator maps for pluvial floods. Design precipitation data can be obtained from the Austrian
climate service ehyd.gv.at in a 6kmx6km grid for the whole country. For any given study it has to be
clearly stated, which grid-points have been considered. If more than one grid-point is relevant for the
study area, it also should be documented, which method(s) was/were applied for the combination of
design-precipitation values from the different cells (e.g. maximum, area-weighted mean, nearest
neighbour, etc.). As a simplified and easily comparable approach a temporally constant distribution of
precipitation intensities over the duration of the event might be assumed (block precipitation). Figure 1
shows the distribution of the 100 yearly rainfall totals for events with a duration of 60 minutes for the
province of Upper Austria based on the current design precipitation values (as of May 2020). The hourly
rainfall totals for a 100-year event with one-hour duration in Upper Austria range from around 40mm to
96mm.

Figure 1: Distribution of the eHYD design rainfall with a duration of 60 min and 100 year return interval for Upper
Austria (left) and eHYD grid-points used for the analysis (right).

With a changing climate, temperatures across Europe are expected to rise in the future. Along with the
very probable temperature increase also an increase of precipitation intensities has to be expected. The
possible influence of future climatic developments on the risk of flooding due to heavy precipitation
events was not specifically addressed in the RAINMAN pilot study Upper Austria, but corresponding
investigations for selected areas in Upper Austria were carried out in the two projects SAFFER-CC and
AQUACLEW (https://aquaclew.eu) (Strehz et al., 2015; Lumassegger et al., 2016a). Results of these
studies indicate that for various regions in Upper Austria an increase in precipitation intensities is to be
expected in the future. The more extreme the precipitation event (i.e. the lower its probability of
occurrence or the greater its return period) and the shorter its duration, the more pronounced the
increase might be. Precipitation totals for events with a duration of 60 minutes or less could increase by
up to 10% per °Celsius temperature increase compared to current conditions. For events of longer
duration, possible rates of increase are currently projected to be in the range of 7% per °Celsius or below.
These estimates largely coincide with results and assessments from various other studies on this topic
(including Lenderik and van Meijgaard, 2008; Formayer and Kromp-Kolb, 2009; Berg et al., 2013; Formayer
and Fritz, 2017; Giorgi et al., 2019; Becker, 2019). Based on these numbers an increase in flooded areas

                                                                                                             Seite 7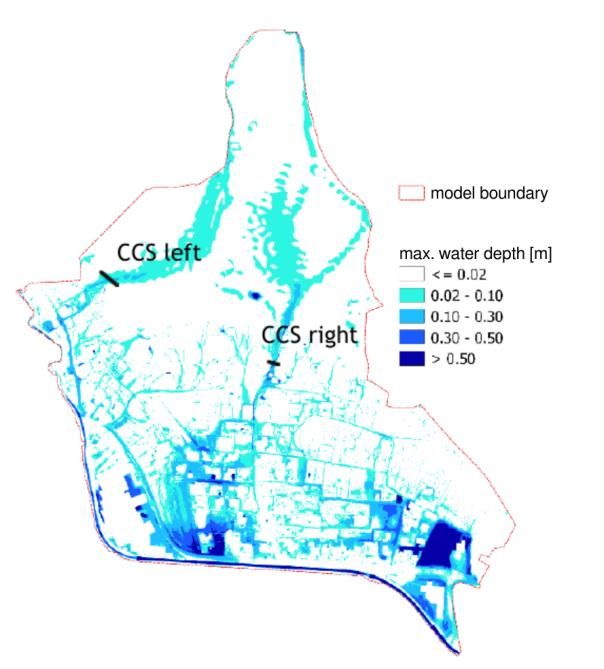
Modeling of surface runoff – Guidance for Practitioners

and values at risk from pluvial flooding in coming years seems likely under the assumption that other
influencing factors remain largely unchanged.
Currently an explicit consideration of potential climate-change impacts is not required for the production
of hazard indicator maps or the design of mitigation measures for pluvial floods in Upper Austria.
Corresponding formal and legal foundations are not yet sufficiently in place to take climate change
aspects into account. However, the Austrian design-precipitation values are updated in irregular intervals
based on the growing precipitation time-series, thus also covering recent developments in the
precipitation regime (see Weilguni, 2019). In addition, the plausibility of assumptions regarding the
considered design rainfall event (e.g. the 1h duration) for pluvial flood assessment is continuously
evaluated based on ongoing event-documentation.

                                                                                                    Seite 8
Modeling of surface runoff – Guidance for Practitioners
4. Topography, compuational grids/meshes
The spatial resolution and level of detail of computational meshes or grids affects the result quality of
two-dimensional hydrodynamic calculations. From a practical perspective the available input data and
limitations regarding computational costs govern the choice of appropriate mesh resolutions. Without a
detailed data basis also the refinement of computational meshes does not necessarily result in model
results of higher quality (Schubert et. al, 2008; Schubert and Sanders, 2012). Therefore, it is necessary to
find a suitable compromise between the level of detailedness of the computational mesh on one hand and
the processing and computational effort on the other hand.
4.1. Topography / Digital Terrain Model
A detailed representation of the terrain surface and hydraulically relevant artificial and natural structures
is particularly important for the realistic modeling of overland flow paths. For this reason, the use of
digital elevation models with spatial resolutions of 1m or below is suggested. In Upper Austria airborne
laserscan based raster digital elevation models are currently available under an open-source license in
0.5m and 1m resolution (https://www.land-oberoesterreich.gv.at/211787.htm). These elevation models
present a sound basis for modeling of pluvial floods. However, plausibility checking based on local
information and, if required, additional processing of the elevation data set are recommended steps.
Especially the following areas should be critically reviewed and compared to the actual local situation by
the modeler as they might not be represented adequately in the digital elevation models:
Above surface structures which can divert surface flow paths (e.g. buildings, walls, dams, dikes,
etc.)
Below surface structures like underpasses, bridges, culverts
small streams, rivulets, gullies (see figure 2)
Figure 2: Cross-section of elevation models with different spatial resolution for the study area Seewalchen. The small
stream is not represented in elevation models with a resolution beyond 2.5m.
Seite 9
Modeling of surface runoff – Guidance for Practitioners

Areas in which the digital elevation model does not represent the actual hydraulic situation should be
modified in the computational mesh. Depending on the employed software packages different methods for
the adaption of the terrain data are viable. In any case, the areas where elevation data is modified should
be transparently documented. Also areas where hydraulic behavior in the model is expected to deviate
from the actual situation, even after terrain modifications, should be explicitly documented.

4.2. Raster
For raster-based models, the resolution of the digital terrain model determines the resolution of the
uniform computational grid. In these models, the geometry of break lines cannot be represented
geometrically exact. The magnitude of deviations from the vector representation depends on the grid
resolution. As shown in figure 3 the deviations become more significant with increasing raster resolution.
This effect has to be considered e.g. when mapping building areas or delimiting areas with different
hydrological and hydraulic properties in the model.

                       0.5m raster                                                    1m raster

                        5m raster                                                    10m raster
Figure 3: Raster representation of building footprints at different raster resolutions compared to the vector geometry of
the features.

                                                                                                                 Seite 10
Modeling of surface runoff – Guidance for Practitioners
The following points should be considered when using raster-based models:
Since the raster resolution is constant over the entire computational domain, the required resolution is
defined by the areas where the most detailed information is needed. In most practical applications this
will be the case in the settlement area.
When choosing the raster resolution, the modeler must ensure that hydraulically relevant structures
(e.g. buildings) are represented in sufficiently good resolution. At a grid resolution of more than 1m,
for example, the geometries of buildings or other hydraulically relevant structures can no longer be
represented with sufficient geometrical accuracy. Therefore, the use of raster-based models is mainly
practicable in combination with high-resolution digital terrain models.
The Office of the Federal Government of Upper Austria recommends a grid resolution of ≤ 1m for the
raster-based modeling of surface runoff in response to heavy precipitation events. Corresponding
digital terrain models, based on areal laser scans, are available for Upper Austria and can be obtained
and used free of charge through open-source licensing (Creative Commons 4.0).
4.3. Flexible Mesh
With flexible computational meshes, the geometries of structures can be mapped in the correct position
almost independently of the selected mesh resolution. In this case, flexible meshes are more adaptable
than grids, since break lines can be defined independently of the elevation model, e.g. on the basis of the
geometries of different hydrologic response units. Height information is only interpolated in a subsequent
step at the nodes of the mesh. The creation and quality of the computational mesh is largely independent
of the resolution of the used elevation source; only the elevation at the mesh nodes is taken from the
digital elevation model. In order to meet requirements regarding model accuracy and computational time,
a balance between the accurate representation of topographic details and hydraulically relevant
structures and acceptable computational times is required. Simply put, the flexible computational mesh
has to be as fine as necessary and as coarse as possible. While offering greater flexibility in mesh design,
flexible mesh based models commonly involve more effort in processing and longer computational times as
compared to their raster-based counterparts.
The following points should be considered when using models working with flexible meshes:
Regardless of the structure and resolution of the flexible mesh, the best available digital
elevation model should be used for interpolation of elevation values at the mesh nodes. In
Upper Austria the use of the 0.5m DEM is suggested.
The accurate representation of break lines significantly influences the overall quality of the
flexible computational meshes and according simulation results.
For large meshes (approx. > 1 million nodes) different resolutions in settlement areas and
surrounding areas (e.g. forests and agricultural areas) can be a sensible modeling choice.
However, when using coarser mesh resolutions in parts of the mesh it is crucial to ensure that
the main flow paths and small hydraulically relevant structures are still adequately captured.
Experiences gained in the RAINMAN pilot study suggest, that using mesh resolutions coarser
than approx. 2.5m can potentially have a significant effect on the surface flow paths and can
thus not be recommended. The use of coarser mesh resolutions must be justified on a well-
founded technical basis in any case. Wherever possible, the inflow into settlement areas or
other areas of interest (e.g. future construction areas) should be checked using control cross
sections (CSSs).
Seite 11Modeling of surface runoff – Guidance for Practitioners
Figure 4: Maximum modeled flow depths for two different flexible meshes covering the same area. On the left the mesh
resolution above the control cross sections is 0.5m, on the right the same area is represented by a mesh of 10m
resolution. The areas below the CSSs are represented by a 0.5m mesh in both cases. Upon visual inspection clear
differences in the modelled maximum water depths between the two maps can be observed; a larger portion of the
headwater area drains into the left CSS at coarser mesh resolution.
Figure 5: Corresponding hydrographs for the control cross sections depicted in figure 4. A shift in the amount of water
draining into each cross section is clearly visible as a result of different mesh resolutions in the head water area. The
CSS left drains a larger portion of the headwater area in case of coarser mesh representation as compared to the fine
mesh representation. At the right CSS the observed behaviour is exactly opposite. Effects like these should be carefully
checked at selected cross sections (e.g. along main entry points of water into settlement areas) when using partially
coarser mesh resolutions for optimizing computational performance or other reasons.
Seite 12Modeling of surface runoff – Guidance for Practitioners
5. Modeling of hydraulically relevant structures
Hydraulically relevant structures such as buildings, walls, culverts, dams or ditches can have a significant
impact on the dynamics of surface water flows in case of heavy precipitation events. However, these
structures are not always adequately represented in the available digital terrain models and have to be
implemented in the computational grid or meshes by means of terrain modification or as boundary
conditions. Achleitner et al. (2020b) investigated the possibilities of considering different structures in
grid-based (FloodArea, JFlow) and mesh-based (Hydro_AS-2D) models in the RAINMAN pilot study Upper
Austria. Also the sensitivity of model results in response to the consideration or neglection of different
hydraulic structures has been investigated in the study. Recommendations for the treatment of
hydraulically relevant structures presented here are based on experiences from the RAINMAN pilot study
Upper Austria and additional sources. Generally, it can be recommended to check the plausibility of the
assumptions made in the model based on on-site inspections preferably involving representatives of local
disaster response units (in most cases the fire brigade), the mayor or local building authority and affected
residents.
5.1. Buildings
Buildings present hydraulic obstacles to surface water flow in case of heavy rainfall. It is thus required to
adequately map buildings in the modeling process. There are different possible methods on how to
consider buildings in the application of two-dimensional hydrodynamic models (see Schubert et al., 2012).
Here, we recommend the use of any of the following two methods:
Building Block Method – The elevation of nodes or cells within the buildings footprints are raised
according to real building heights or alternatively by a sensible constant value.
Building Hole Method – Buildings are defined as non-permeable flow obstacles; either by defining
closed boundary conditions along the buildings perimeters or through similar approaches (which might
differ between models).
Modeling of precipitation acting directly on buildings is only possible with the building block method.
However, when using this possibility attention should be given to a hydraulically adequate representation
of roof areas in the mesh/grid, such as to avoid pooling of water on roof areas. Also applying rainfall
directly on roof areas can lead to unrealistic flow velocities or water depths directly along building
perimeters in the model. It is highly recommended to check the behaviour of the used model regarding
these effects, when using this option. Alternatively, precipitation falling on rooftops can be considered by
adjusting the precipitation input in areas surrounding the buildings in proportion to the area of the
building footprints. This procedure is also viable when using the building hole method. In any case, it is
important to consider the contribution of rainfall over buildings when modeling pluvial floods. Depending
on the precipitation scenario and the proportion of built-up areas in the model domain the precipitation
over buildings should be directly or indirectly considered in the model. With more extreme modeled
precipitation events and more densely built-up areas under investigation, the relative contribution of
precipitation over buildings to the total volume of surface runoff will increase. For these types of
scenarios special attention should be given to this aspect.
5.2. Property fencing, walls
Property enclosures in the form of fences, walls or hedgerows can influence local hydraulics in case of
pluvial flood events. However, the effects of partly permeable enclosures such as fences and hedgerows
depend on a multitude of factors and are thus difficult to assess. From a practical perspective it appears
Seite 13Modeling of surface runoff – Guidance for Practitioners
reasonable, as an approximation, to neglect any hydraulic effect of these partly permeable features in
hydraulic modeling of surface water floods. However, explicit consideration of fences and hedges might be
sensible in cases where empirical evidence allows a characterisation of their hydraulic behaviour in case
of an event. In the Upper Austrian RAINMAN pilot study Achleitner et al. (2020b) investigated the
sensitivity of maximum modeled water depths in response to consideration of walls of different heights for
modeling of pluvial floods. The results indicate that walls up to a height of 10cm might only affect
maximum computed water-depths in settlement areas to a relatively small extent. The Federal
Government of Upper Austria therefore suggests that walls up to a height of 10cm (this also includes most
curb stones) in 2D hydrodynamic models for pluvial flooding can be neglected as an approximation. For
walls, which are considered in the model, special attention should be given to a realistic mapping of
openings in the walls (e.g. doors, gates, driveways).
Walls might be considered in the computational grid/mesh via the following methods:
Integration of wall geometry – The elevation of cells or nodes in the grid/mesh, which are covered by
the walls footprint are adjusted according to the wall height. Walls integrated with this method can be
overflown in case of sufficient water depths. Most walls only have widths of a few decimeters, which
can present a challenge for their implementation in computational grids or meshes. For raster-based
models this means, that limitations regarding the exact geometrical representation of the walls exist.
Deviations of the model representation from the real geometry mainly depend on the raster resolution
and chosen rasterization method (see section 4 of this document). In the case of flexible computational
meshes the requirement of very small mesh elements for the representation of walls might introduce a
higher workload for mesh generation.
Walls as weir boundary condition – Walls are implemented with a special weir boundary condition
(e.g. Hydro_AS-2D). The width and height of the wall crest as well as an overflow-coefficient have to
be parameterized. This method is only available in selected software packages.
Walls as closed boundary conditions – Walls are implemented as closed boundary conditions or
defined as flow obstacles with infinite height. In this case walls cannot be overflown, which has to be
considered especially when having low-rise walls.
The choice of an appropriate method is - from the authors perspective - case dependent. Modeling walls
as closed boundary conditions or with infinite height is only appropriate if overtopping can be excluded as
well in reality. In all other cases modeling the walls by integrating the real wall geometry in the
grid/mesh is recommended. When using this method, special attention should be paid to model specific
requirements regarding mesh quality (in e.g. Hydro_AS-2D walls should be represented by at least two
mesh elements; see Achleitner et al., 2020b); The use of weir boundary conditions for modeling of walls
requires additional effort in the mesh creation process. This method is also not implemented in all
software packages. It's use should be case-wise justified and documented accordingly.
5.3. Culverts
The hydraulic relevance of structures like culverts or underpasses depends on the modeled precipitation
scenario and the dimensions of the culverts, pipes, etc. These parameters also govern the decision
whether to consider these structures in two-dimensional hydrodynamic modeling of pluvial floods. Smaller
structures without constructive measures against jamming debris might only have a limited discharge
capacity in case of a pluvial flood event (Achleitner et al. 2020a). Besides, culverts up to a diameter of
300mm, even at full capacity, only exhibited a minor effect on modelled maximum water depths in an
example from the RAINMAN pilot study Upper Austria (Achleitner et al. 2020b). Therefore, the Upper
Austrian Federal Government recommends neglecting culverts of 300mm diameter or less for modeling of
pluvial floods. The hydraulic relevance of larger culverts should be estimated based on on-site inspections.
Seite 14Modeling of surface runoff – Guidance for Practitioners
If culverts are explicitly modeled, also scenarios with reduced or no discharge capacity due to blocking of
the inlet structures should be modeled.
Large structures like underpasses and bridges, which are likely to preserve their discharge capacity in case
of a flood event, should be integrated into the models in any case. Considering these structures is
important to model realistic overland flow pathways (see Achleitner et al. 2020a; Starl, 2020).
Underpasses might be modeled as breaches in the computational grid/mesh as the simplest
approximation. Alternative methods for considering culverts vary between different software packages
and are not discussed here; In any case the modeling decisions regarding culverts and underpasses should
be comprehensibly documented.
5.4. Urban drainage system, sewers
This document is mainly concerned with modeling of pluvial floods in rural areas. In more rural settings
urban drainage systems tend to play a minor role in contrast to urban areas (Achleitner, et al. 2020a). In
Austria urban drainage systems are designed for precipitation events with recurrence intervals which are
low compared to the events considered in this document. In the case of extreme precipitation events
leading to pluvial floods there is a high probability that sewer capacities are overburdened. Moreover, the
sewer inlets might be clogged by transported debris, which can further diminish the effective capacity of
these structures in many scenarios. These effects could be observed in a number of pluvial flood events in
Upper Austria in recent years. Based on these deliberations the Federal Government of Upper Austria does
not suggest considering any positive effects of urban drainage systems in pluvial flood modeling for
extreme precipitation events. Also the coupled modeling of surface hydrodynamics with designated urban
drainage models is not required. If based on local expertise/experience from past events locally negative
effects of urban drainage systems on the flood situation can be expected (e.g. sewer acting as local
source for flooding) these effects can be considered in a simplified manner in the model (e.g. by using
local point sources in the model).
Seite 15Modeling of surface runoff – Guidance for Practitioners
6. Surface roughness / flow resistance
The hydraulic roughness of a terrain surface is influenced by a multitude of parameters (vegetation,
surface condition, etc.). In sensitivity studies carried out in the RAINMAN pilot study Upper Austria it could
be observed that with rough parameterization the maximum modeled flow depths tends to increase
(Figure 7 left) while the maximum modeled flow velocity tends to decrease (Figure 8 left). In addition to
the effects on the maximum modeled water levels and flow velocities, the runoff dynamics must also be
considered. Increasing the hydraulic roughness can lead to delayed flow reactions in the model, which
causes peak flows to occur later. This can also be seen in figure 7 on the left, where the lower water
depths in lower parts of the study area can be attributed to this effect. A calibration of roughness
parameters for two-dimensional hydrodynamic modeling of pluvial floods is in many cases inhibited by a
lack of suitable reference data. The parameters are often obtained based on values from literature;
parameter calibration often is limited to simple plausibility checks (see chapter 9).
Figure 6: Reference scenario calculated with Hydro_AS-2D (average roughness). Display of maximum water depths (left)
and maximum flow velocities (right).
Figure 7: Changes in maximum modeled water depths compared to the reference scenario calculated with Hydro_AS-2D
for a comparatively rougher and a smoother parametrisation. Higher water depths are modeled using a rough
parametrisation (left), a hydraulically smooth parametrisation leads to lower modeled maximum water depths (right).
Seite 16Modeling of surface runoff – Guidance for Practitioners
Figure 8: Changes in maximum modeled flow velocities compared to the reference scenario calculated with Hydro_AS-
2D for a comparatively rougher and a smoother parametrisation. As expected, lower flow velocities are modeled using a
rough parametrisation (left), a hydraulically smooth parametrisation leads to higher modeled maximum flow velocities
(right).
In most software packages currently used for modeling of pluvial floods/surface water floods, a Manning-
or Strickler type flow resistance approach is implemented. This also applies to the software packages used
in the RAINMAN pilot study in Upper Austria. The flow resistance of different surface classes is
parameterised by defining corresponding Manning or Strickler coefficients for these surfaces. Rough value
ranges for different surfaces can be obtained for practical application from various literature sources, but
a plausibility check of the parameterisation based on local information should always be performed by the
modeler. The guideline for municipal heavy rain risk management in Baden-Württemberg summarises this
as follows:
"In the hydraulic model, the roughness of the terrain surface for the local conditions shall be set
according to the existing surface properties and uses in such a way that realistic flooding depths
and flow velocities are achieved." (translated from LUBW,2016)
Results from the investigations in the RAINMAN pilot areas of Schwertberg and Seewalchen also show that,
depending on the implementation of the model (numerics, basic hydraulic equations), the sensitivity of
the model results to different parameterisations of the flow resistance can be quite different. As
expected, a rougher parameterisation for the examples considered led to a tendency towards higher
simulated maximum water depths and lower maximum flow velocities; a smoother parameterisation in
comparison has the opposite effect. The results also show that, depending on the terrain and area
characteristics, the compared models do not necessarily react in the same way to a similar change in the
flow resistance parameterisation. From the point of view of the authors, it therefore seems particularly
important to know the corresponding characteristics of the model used and to take them into account
accordingly in the parameterisation of the flow resistances.
With regard to the parameterisation of the flow resistances, it should also be noted that the assignment of
constant roughness coefficients according to Manning- or Strickler for different land use or land cover
classes naturally always implies a simplification of real processes. On the one hand, the flow resistances
actually occurring for different land cover units change seasonally, for example due to different
vegetation periods or processing stages on agricultural land. On the other hand, the effective flow
resistances can also vary depending on the water depth (cf. Figure 9) and other factors (e.g. resolution of
the selected computational mesh in the modeling), which is not represented by the choice of a constant
roughness parameter.
Accordingly, different roughness parameters can be found in scientific literature, which also show a
corresponding spread (see Figure 10). The definition of water depth dependent flow resistances or the
choice of alternative flow resistance formulations is already implemented in some software packages;
Seite 17Modeling of surface runoff – Guidance for Practitioners
however, the subject matter is very extensive and was not explicitly investigated in the RAINMAN pilot
study Upper Austria.
Figure 9: Vegetation laid down in the direction of flow after a pluvial flood in Schwertberg in 2016 (left) and runoff
documented during an irrigation experiment (right). Depending on the water depth, the effective flow resistances here
are higher (shallow water depth, right) or lower (vegetation laid down as a result of greater water depth, left) for the
same land cover unit.
Considering current practice, the authors are in favour of a pragmatic choice of flow resistance
parameters for pluvial flood modeling.
Accordingly, in the course of the sensitivity studies on roughness carried out in the RAINMAN pilot study
Upper Austria, the landuse classes - cropland, meadow and pasture - were combined into one category for
agricultural areas in agreement with the client. This pragmatic approach was chosen, since changes from
cropland to grassland or pasture areas are possible in principle and the respective area proportions can
vary seasonally or over several years.
A corresponding simplified determination of mean roughness values for the creation of hazard maps is also
conceivable from a practical perspective (Achleitner et al. 2020b). The bandwidths for different land
cover classes examined in the sensitivity study are depicted as color gradients in Figure 10.
Seite 18Modeling of surface runoff – Guidance for Practitioners
Figure 10: Compilation of roughness values (Strickler type coefficients) from literature for different land use
classes/types. The dashed bordered value ranges are proposed in LUBW (2020) for shallow water depths the
corresponding solid boxes in the LUBW references refer to value ranges for water depths of more than 10cm.
Seite 19Modeling of surface runoff – Guidance for Practitioners
7. Hydrological modeling
Runoff formation on different hydrologic response units depends on a variety of factors. Vegetation, the
degree of surface sealing, land use practices and soil properties are among the most important factors
influencing the formation of surface runoff in response to precipitation events. Most of these factors vary
with time; the same precipitation event can produce different amounts of surface runoff in response to
the prevailing conditions. Accordingly, it is important to consider vertical-hydrological processes when
modeling surface water floods in response to heavy precipitation events. Different empirical and
physically based hydrological model approaches of varying complexity exist, some of which are
implemented in the two-dimensional hydrodynamic software packages discussed in this document (see
Table 1). 2d hydrodynamic models which support the definition of spatially and temporally variable
precipitation as a boundary condition allow using a hydrologic model in a pre-processing step and forcing
the model with corresponding net-precipitation independently from any pre-implemented loss model.
From a practical point of view, however, besides the choice of the appropriate loss model, the question of
its parameterisation arises.
A pragmatic approach towards the parametrisation of loss models for use in hazard map production is the
use of regional-scale maps for runoff-coefficients or net-precipitation datasets (cf. LUBW, 2016; Steinbrich
et al. 2016; Sotier et al. 2016). Of course, this requires that such data bases are available for the area
under investigation. A corresponding data set for Upper Austria is currently being revised; up-to-date
information on the data set can be obtained upon request from the Office of the Upper Austrian
Government. From the authors' point of view, such maps - after checking and, if necessary, updating the
underlying data to take into account possible changes in prevailing conditions - provide a pragmatic and
comparable basis for the creation of hazard maps at the present time. If more detailed local information
and evidence on possible runoff formation behaviour is available for a study area (e.g. from irrigation
experiments, seepage experiments, soil samples, observations/measurements of past events, etc.), the
use of alternative hydrological runoff formation models (e.g. Zemokost, SCS-CN, Green-Ampt, etc.) is also
reasonable (cf. Achleitner et al, 2020b); the corresponding model parametrisation should strive to provide
a realistic approximation of the actual runoff formation processes. A neglection of the hydrological runoff
formation processes in the modeling workflow (i.e. use of a constant runoff coefficient 1 - net
precipitation equals gross precipitation) is explicitly not recommended here.
As already noted in the previous sections, the assumptions made in the parametrisation of the hydrological
loss model should also be documented in a comprehensible manner. Coordination with the client regarding
the model choice and assumptions made early in the modeling process can also contribute to improving
the comprehensibility and transparency of the model results. Regardless of the method and
parametrisation selected, plausibility checking of the chosen assumptions is highly recommended (see also
Section 9).
Seite 20Modeling of surface runoff – Guidance for Practitioners
8. Cartographic presentation of results
The requirements for the cartographic display of the results depend on the respective application. For use
in emergency planning/disaster management, the dynamics of the runoff event are of main concern (e.g.
which areas are affected or accessible at different times during a pluvial flood event). For spatial planning
applications, maximum values (max. modeled water depths, flow velocities) are of primary importance. It
is therefore advisable to determine the purpose and manner of cartographic representation of model
results with the client in advance. In the following selected cartographic presentations for hazard
indicator maps are presented.
8.1. Mapping of maximum water-depths hmax
Areas endangered by heavy precipitation can be delineated most easily by means of a classified
illustration of maximum modeled water depths or water levels hmax. This classification is easy to
understand; moreover, uncertainties in the modeling can be partially covered (except for class
boundaries) by a classified presentation (especially by choosing broader classes). Due to the use of areal
precipitation as boundary conditions in hydrodynamic modeling, almost all cells are wetted in one or more
time steps in the course of a simulation run (water depths > 0m accumulate at the cells). Thus, the
identification of endangered areas by means of high water marks, or the distinction between wet and dry
cells in the model domain is not possible. The use of a threshold value for hmax below which corresponding
water depths are not depicted has therefore been established in many practical applications. The
minimum displayed water depth usually varies between 0.015m and 0.05m. The choice of a corresponding
value in this range is recommended from the authors' point of view. Table 2 shows a proposal for the
classification of maximum water depths as used in Achleitner et al., (2020b).
Table 2: Vorschlag für die Klassifizierung der maximalen Wassertiefe
8.2. Mapping of maximum water-depths hmax and maximum flow
velocities vmax
Both the calculated water depths and the flow velocities can be used for the mapping of areas at risk in
response to heavy precipitation. The two parameters can be considered either separately or in
combination. Separate maps with independent representations of the two parameters or a superimposed
representation in one map (e.g.: by a combination of color and texture or the punctual representation of
flow velocities at neuralgic points) are suitable for a separate representation. A combined classification
v²
can, for example, be based on the energy line height (h + ) or different types of matrices relating h and
2g
v. However, in this case the information about the respective contribution of the individual parameter to
the classification is lost.
Seite 21Modeling of surface runoff – Guidance for Practitioners
Figure 11 shows an example of a representation classified according to the energy line height, as used in
the guideline for hazard zone plans of torrent and avalanche control service (BMLFUW, 2011) for
frequently occurring events (HQ30). A lower limit for the designation of a yellow zone was defined at 5cm,
otherwise all wetted areas would be designated as yellow zones.
Figure 11: Presentation of the hazard zones based on the classification for more frequently occurring events (HQ30)
according to BMLFUW (2011) As minimum limit value for the yellow zone (h+v2/2g) ≥ 5cm was used.
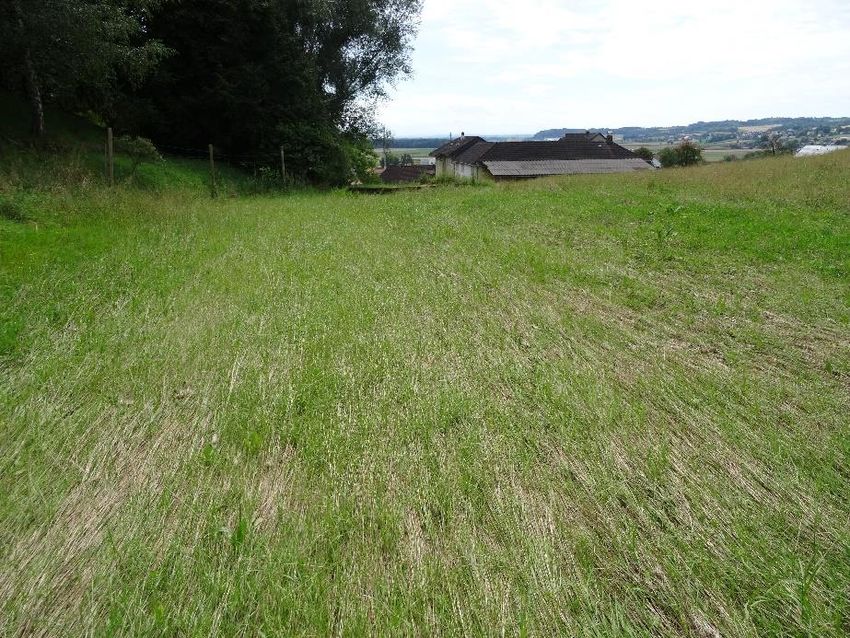
Figure 12: Example for a superimposed representation of the maximum water depth hmax (colour-coded according to
Table 2) and the maximum flow velocity vmax (hatched signatures).
Another way to display information about hmax and vmax in combination is to overlay the color-coded water
depths with the velocities in form of hatched signatures. A corresponding example is depicted in Figure
12.
Seite 22Modeling of surface runoff – Guidance for Practitioners
8.3. Summary – cartographic presentation
The choice of the minimum displayed water depth is particularly important for the display of areas
endangered by heavy precipitation. The choice of the minimally displayed water depths in the range
between 0.015m and 0.05m is considered reasonable from the authors' perspective. The gradation and
number of classes should be chosen according to the purpose of the hazard map.
If, in addition to maximum water depths, also flow velocities should be displayed, a distinction can be
made between a separate display (e.g. separate map layer, punctual display of particularly relevant areas
using point signatures/arrows) or a combined display (e.g. energy line height, matrix-based visualization).
Depending on the area of application of the hazard map (operational planning/disaster management vs.
spatial planning), an appropriate option should be selected. When displaying flow velocities, a plausibility
check of the modelled velocities (especially in the case of "automatic" classification of the results) is
recommended in order to detect potential artefacts in the model calculations.
The development of a standardized methodology for the cartographic representation of areas endangered
by pluvial floods at the national level, similar to existing conventions in hazard zoning for fluvial floods
and torrent events appears sensible from the authors’ perspective. For example, the WLV HQ30 approach
shown in this chapter might present a good compromise between existing BWV/WLV classification
approaches for fluvial processes and the LUBW classification approach for heavy rainfall risk (for details
see Achleitner et al., 2020b).
Seite 23Modeling of surface runoff – Guidance for Practitioners
9. Plausibility checks and final remarks
For the two-dimensional hydrodynamic modeling of surface runoff due to heavy precipitation, there are a
growing number of available software products with different modeling approaches and implemented
functions. The quality and informative value of the model results is influenced by the underlying data,
assumptions made and calculation approaches used. The RAINMAN pilot study Upper Austria showed that
the use of different models can sometimes lead to considerable differences in the results, even if the
same parameters are chosen in the models. Finally, it should be pointed out again that a plausibility check
of the simulation results is recommended in any case. In the following some possibilities are listed:
An evaluation of modeled inundation areas and flow paths can be conducted by inspections with
local experts. Fire brigades often provide very helpful information in the form of operational
documentation. On the basis of these records, flow paths and affected buildings can be identified
and, ideally, maximum water levels derived. In the course of an inspection, affected residents
should also be questioned. They can supply valuable information on water entry points and water
levels in buildings. Evidence for very recent events is often visible by means of marks on
buildings/vegetation and can be recorded with relatively little effort, given the opportunity of a
timely site-inspection. High water marks can provide information about the magnitude of
maximum water depths and can be used to evaluate the plausibility of model results.
Alongside the maximum modeled velocities and water depths also the modeled spatial patterns of
these parameters should be critically evaluated. If very large local deviations of maximum values
between neighbouring elements/cells occur, also the temporal evolution of values at these cells
should be checked in detail using control points or control cross sections. Strongly fluctuating
water depths (e.g. so-called "roll-wave" instabilities) or unrealistically high flow velocities can be
indicative of a numerical problem in the model. In this case, for example, it might be sensible to
check whether quality criteria such as the CFL criterion are met. Subsequently, the model
parameters or the calculation mesh/grid can be adjusted if necessary.
In addition to the calculated maximum values for flow velocities and water depths, their temporal
evolution over the simulated period should also be checked for obvious irregularities. This can be
done e.g. in a first step by visual inspection of different time steps (e.g. through animated
frames). The examination of the temporal progressions of flow height h, flow velocity v and, if
necessary, discharge Q at defined control points or cross sections can also help the modeler to
better assess the plausibility of the model results. Special attention should be given to main entry
points of surface flows into settlement areas or the locations of critical infrastructure.
The selected roughness parametrisation in the model might be roughly evaluated on the basis of
the temporal evolution of the modeled flood wave. In the majority of cases peak discharges for
pluvial floods in small rural catchments occur during or shortly after the triggering precipitation
event. If, for example, corresponding water depths in the settlement area only occur in the model
more than one hour after the end of the modeled rainfall, this can be an indication that the model
was parameterised too rough. Information on the temporal course of past events can sometimes
be obtained by on-site inspections on the basis of personal communication, official records (e.g.
fire brigades) or photos/videos with time stamps (cf. e.g. Achleitner et al. 2020; Lumassegger,
2016a, b; Starl, 2020).
Seite 24Modeling of surface runoff – Guidance for Practitioners
10. References
Achleitner, S., Kohl, B., Lumassegger, S., Huber, A., Formayer, H. und Weingraber, F. (2020a),
Sturzfluten, In Thomas Glade, Martin Mergili, Katrin Sattler (Hrsg.) ExtremA 2019. Aktueller Wissensstand
zu Extremereignissen alpiner Naturgefahren in Österreich. Vienna University Press, S. 247–286, ISBN Print:
9783847110927 – ISBN E-Lib: 9783737010924
Achleitner, S.; Huber, A.; Lumassegger, S.; Spira, Y.; Weingraber, F. (2020b): Pilotstudie Oberösterreich -–
Methoden zur Risikogebietsausweisung für Starkregen, Technischer Bericht RAINMAN Interreg Central
Europe
Becker, A. (2019). Extremerer Niederschlag im Klimawandel - Was wissen wir? WasserWirtschaft, 12:10–16.
Berg, P.; Moseley, C.; Haerter, J. (2013). Strong increase in convective precipitation in response to high
temperatures. Nature Geoscience, 6:181–185. URL https://doi.org/10.1038/ngeo1731.
Bernet, D. B.; Prasuhn, V.; Weingartner, R. (2017). Surface water floods in Switzerland: what insurance
claim records tell us about the damage in space and time. Natural Hazards and Earth System Sciences,
17:1659–1682.
Bernet, D. B.; Zischg, A.; Prasuhn, V.; Weingartner, R. (2018). Modeling the extent of surface water floods
in rural areas: Lessons learned from the application of various uncalibrated models. Environmental
Modelling & Software, 109:134–151.
BMLFUW (2011). die.wildbach - Richtlinie für die Gefahrenzonenplanung BMLFUW-LE.3.3.3/0185-
IV/5/2007 Fassung vom 04. Februar 2011. techn. Richtlinie, Bundesministerium für Land- und
Forstwirtschaft, Umwelt und Wasserwirtschaft (BMLFUW).
Broich, K.; Kaiser, M.; Lin, Q.; Mitterer, J.; Nguyen, H.; Pflugbeil, T.; von Trentini, F.; Willkofer, F.;
Disse, M.; Ludwig, R. (2018). Das Projekt HiOS - Erstellung einer Hinweiskarte für Oberflächenabfluss und
Sturzfluten für bayerische Gemeinden. In: Disse, M.; Kaiser, M. (Hg.), Starkregen und Sturzfluten -
Erfassen, Erforschen, Evaluieren; Beiträge zum Seminar am 6. Juni 2018, Nummer 40.18 in Forum für
Hydrologie und Wasserbewirtschaftung, S. 27–40. doi:10.14617/for.hydrol.wasbew.40.18.
Courty, L. G.; Pedrozo-Acuña, A.; Bates, P. D. (2017). Itzı̈ (version 17.1): an open-source, distributed GIS
model for dynamic flood simulation. Geoscientific Model Development, 10:1835–1847.
Falconer, R.; Cobby, D.; Smyth, P.; Astle, G.; Dent, J.; Golding, B. (2009). Pluvial flooding: new
approaches in flood warning, mapping and risk management. Journal of Flood Risk Management, 2,(2):198–
208.
Formayer, H.; Kromp-Kolb, H. (2009). Hochwasser und Klimawandel. Auswirkungen des Klimawandels auf
Hochwasserereignisse in Österreich. BOKU-Met Report 7, Institut für Meteorologie (BOKU-Met),
Department für Wasser - Atmosphäre - Umwelt, Universität für Bodenkultur Wien, Wien. Endbericht WWF
(2006), URL http://www.boku.ac.at/met/report/BOKU-Met_Report_07_online.pdfHiO.
Formayer, H. and A. Fritz (2017). "Temperature dependency of hourly precipitation intensities – surface
versus cloud layer temperature." International Journal of Climatology 37(1): 1-10.
Fritsch, K.; Assmann, A.; Tyrna, B. (2016). Long-term experiences with pluvial flood risk management.
FLOODrisk 2016 – 3rd European Conference on Flood Risk Management, DOI:10.1051/e3sconf/20160704017
Giorgi, F.; Raffaele, F.; Coppola, E. (2019). The response of precipitation characteristics to global
warming from climate projections. Earth System Dynamics, 10:73–89. URL https://doi.org/10.5194/esd-
10-73-2019.
Humer, G.; Reithofer, A.; Klar, R.; Achleitner, S. (2015): Erweiterung eines 2D-Strömungsmodelles zur
Berechnung von Sturzfluten – Plausibilisierung und praktische Anwendung für die Darstellung von
Seite 25You can also read