Development of a dynamic dust source map for NMME-DREAM v1.0 model based on MODIS Normalized Difference Vegetation Index (NDVI) over the Arabian ...
←
→
Page content transcription
If your browser does not render page correctly, please read the page content below

Geosci. Model Dev., 12, 979–988, 2019
https://doi.org/10.5194/gmd-12-979-2019
© Author(s) 2019. This work is distributed under
the Creative Commons Attribution 4.0 License.

Development of a dynamic dust source map for NMME-DREAM
v1.0 model based on MODIS Normalized Difference Vegetation
Index (NDVI) over the Arabian Peninsula
Stavros Solomos1,2 , Abdelgadir Abuelgasim2 , Christos Spyrou3 , Ioannis Binietoglou4 , and Slobodan Nickovic5
1 Institute
          for Astronomy, Astrophysics, Space Applications and Remote Sensing (IAASARS),
National Observatory of Athens, Athens, Greece
2 Department of Geography and Urban Planning, National Space Science and Technology Center,

United Arab Emirates University, United Arab Emirates
3 Department of Geography, Harokopio University of Athens (HUA), El. Venizelou Str. 70, 17671 Athens, Greece
4 National Institute of R&D for Optoelectronics, 409 Atomiştilor Str., Magurele 77125, Romania
5 Republic Hydrometeorological Service of Serbia, 11000 Belgrade, Serbia

Correspondence: Abdelgadir Abuelgasim (a.abuelgasim@uaeu.ac.ae)

Received: 5 October 2018 – Discussion started: 6 November 2018
Revised: 24 January 2019 – Accepted: 7 February 2019 – Published: 15 March 2019

Abstract. We developed a time-dependent dust source map            1   Introduction
for the NMME Dust Regional Atmospheric Model (DREAM
v1.0) based on the satellite MODIS Normalized Difference           The importance of natural particles, namely desert dust, in
Vegetation Index (NDVI). Areas with NDVI < 0.1 are clas-           the weather and climate has been underlined in a great num-
sified as active dust sources. The updated modeling system         ber of studies. Dust is a climatic regulator, as it modifies
is tested for dust emission capabilities over SW Asia using a      extensively the radiative balance of the atmospheric column
mesoscale model grid increment of 0.1◦ × 0.1◦ for a period         (e.g., Torge et al., 2011; Spyrou et al., 2013; Mahowald et
of 1 year (2016). Our results indicate significant deviations      al., 2014). At the same time dust aerosols modify the at-
in simulated aerosol optical depths (AODs) compared to the         mospheric water content (Spyrou, 2018), the way clouds are
static dust source approach and general increase in dust loads     formed by acting as cloud condensation nuclei (CCN) and ice
over the selected domain. Comparison with MODIS AOD in-            nuclei (IN), and the precipitation process (Kumar et al., 2011;
dicates a more realistic spatial distribution of dust in the dy-   Solomos et al., 2011; Nickovic et al., 2016). In addition,
namic source simulations compared to the static dust sources       there is a clear connection between dust particles and human
approach. The modeled AOD bias is improved from −0.140             health disorders, as the size of the aerosols produced is small
to 0.083 for the case of dust events (i.e., for AOD > 0.25)        enough to cause respiratory and cardiovascular diseases, as
and from −0.933 to −0.424 for dust episodes with AOD > 1.          well as pathogenic conditions due to the microorganisms that
This new development can be easily applied to other time pe-       they can potentially carry (Mitsakou et al., 2008; Esmaeil et
riods, models, and different areas worldwide for a local fine      al., 2014).
tuning of the parameterization and assessment of its perfor-          The Arabian Peninsula is one of the most important
mance.                                                             sources of mineral dust worldwide and together with the Sa-
                                                                   hara and the Gobi contributes to the formation of a North-
                                                                   ern Hemisphere “dust belt” as described by Prospero et
                                                                   al. (2002). Severe dust storms over the Peninsula are quite
                                                                   common, especially during long periods without rain, in the
                                                                   spring and summer (Almazrouia et al., 2012). Particles in-
                                                                   jected into the atmosphere from arid soils, under favorable

Published by Copernicus Publications on behalf of the European Geosciences Union.
980                            S. Solomos et al.: Development of an NDVI dynamic dust source map for NMME-DREAM

weather conditions (high wind speeds and dry soil), can af-           In the current study we present the implementation of a dy-
fect large areas around the sources but also remote loca-          namical dust source map in the well-established and widely
tions like the Eastern Mediterranean (Mamouri et al., 2016;        used the Dust Regional Atmospheric Model (DREAM v1.0)
Solomos et al., 2017) and the Indian Ocean (Chakraborty et         (Nickovic et al., 2001; Pérez et al., 2006). The new devel-
al., 2006).                                                        opment is first tested here for the greater SW Asia but can
   Due to the multitude and severe effects of dust particles       be extended for use in mesoscale dust modeling applications
not only on the weather and the ecosystem but on human             worldwide. Two experimental simulations are performed for
health as well, the proper description of the production, trans-   a 1-month period (August 2016) over the greater SW Asia:
port, and eventual deposition of the dust cycle in numeri-         (1) a control run, where the dust source definition is based on
cal weather prediction models (NWPs) is essential. In or-          the Ginoux et al. (2001) dataset, and (2) a dynamic source
der to be able to accurately describe the dust life cycle in       run, where the NDVI values are used to identify the dust
the atmosphere, we need a clear understanding of the areas         sources. The main differences in our approach compared to
which can potentially act as “dust sources”. The definition        the previous studies referenced above are that we use a very
of such areas dictates the emission strength and therefore the     high-resolution NDVI product (500 m × 500 m) in a regional
amount of particles inserted into the atmosphere. A proper         modeling domain (e.g., Kim et al., 2013 used an 8 km × 8 km
representation of dust sources is therefore an essential first     NDVI dataset extrapolated to 1◦ × 1◦ global modeling do-
step, in studying the impacts of mineral particles in the cli-     main) and our study is not limited to specific test cases (like,
mate and human societies. Usually the definition of the areas      for example, Vukovic et al., 2014 and Solomos et al., 2017),
that can act as dust sources is made using global datasets.        but covers an extended time period, as presented below. The
For example Nickovic et al. (2001) used a subjective corre-        model results from both runs are compared to available satel-
spondence between the Olson World Ecosystems (Olson et             lite observations and station measurements inside the model-
al., 1983) and the 13 SSib (simplified simple biosphere; Xue       ing domain. In Sect. 1 we describe the methodological steps
et al., 1991) vegetation types to identify arid and semiarid       regarding the model developments and remote-sensing data;
areas. Similarly, Spyrou et al. (2010) used a 30 s global land     Sect. 2 includes the results of the experimental runs and
use/cover database, classified according to the 24 category        Sect. 3 is a summary and discussion of the study findings.
U.S. Geological Survey (USGS) land use/cover system (An-
derson et al., 1976) to define active areas in the SKIRON dust
model. Solomos et al. (2011) used the LEAF soil and vegeta-        2     Methodology
tion sub-model of the Regional Atmospheric Modeling Sys-
tem (RAMS) (Walko et al., 2000) to identify the active dust        2.1    Model description
sources in the RAMS-ICLAMS model.
                                                                   The modeling system used in this study is NMME-DREAM
   However, the abovementioned methodologies have some
                                                                   v1.0. The meteorological core is the NCEP–NMME atmo-
significant drawbacks. The datasets are usually not up
                                                                   spheric model (Janjic et al., 2001). DREAM v1.0 is a nu-
to date; therefore, recent land use modifications are not
                                                                   merical model created with the main purpose of simulating
included and not represented. In addition, such “static”
                                                                   and predicting the atmospheric life cycle of mineral dust us-
databases mean that possible seasonal variations are not
                                                                   ing an Euler-type nonlinear partial differential equation for
taken into account. In order to overcome the above limita-
                                                                   dust mass continuity (Nickovic et al., 2001, 2016; Pérez et
tions and improving global dust forecasts, Kim et al. (2013)
                                                                   al., 2006; Pejanovic et al., 2011). In DREAM the concen-
developed a dynamical dust source map for the GOCART
                                                                   tration approach is used for dust uplift, where surface con-
dust model by characterizing Normalized Difference Vegeta-
                                                                   centration is used as a lower boundary condition and used
tion Index (NDVI) values < 0.15 as active dust spots. Sim-
                                                                   for the calculation of surface fluxes, which in turn depends
ilarly Vukovic et al. (2014) combined MODIS land cover
                                                                   on the friction velocity (Nickovic et al., 2001). This surface
types with pixels having NDVI < 0.1 to identify the seasonal
                                                                   concentration is calculated using Eq. (11) from Nickovic et
dust sources that caused the severe Phoenix haboob of July
                                                                   al. (2001):
2011 in the US. Such information can be even more relevant
at meso- and local scales for determining land use changes                            "         2 #
                                                                                             u∗t
and potential dust sources, especially in heterogeneous re-        Csfc = c1 · δ · u2∗ 1 −            ,
gions such as the Arabian Peninsula (which has more diverse                                  u∗
soil types than, e.g., the Sahara) and the greater SW Asia. In
this context, Solomos et al. (2017), used the Landsat-8 NDVI       where c1 = 2.4 · 10−4 mKgr 5 s2 is a constant determined from
data (assuming also NDVI < 0.1 as active sources) to iden-         model experiments, u∗ and u∗t are the friction velocity and
tify recent changes in land use due to the war in Iraq and         the threshold friction velocity for dust production, respec-
Syria resulting in a significantly more realistic simulation of    tively, and δ = a ·γk ·βk , where γk the ratio between the mass
dust properties in the Middle East.                                available for uplift and the total mass βk the fractions of clay,
                                                                   silt, and sand for each soil class and a is the desert mask

Geosci. Model Dev., 12, 979–988, 2019                                                  www.geosci-model-dev.net/12/979/2019/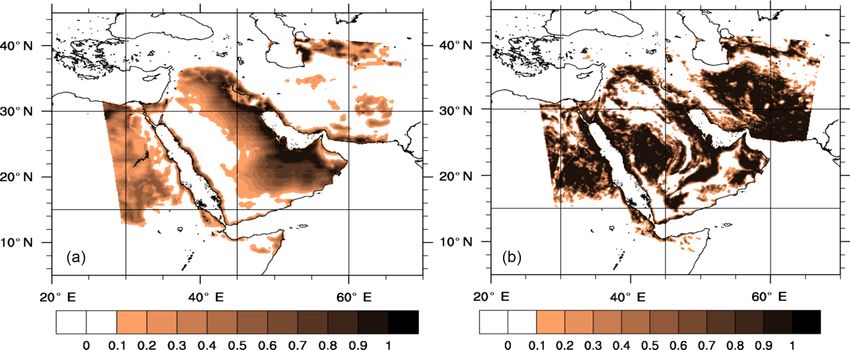
S. Solomos et al.: Development of an NDVI dynamic dust source map for NMME-DREAM                                              981

(between 0 and 1) calculated from the Ginoux et al. (2001)
dataset. Soil moisture and particle size dictate the threshold
friction velocity which initializes dust production. Once par-
ticles have been lifted from the ground they are driven by
the atmospheric model variables and processes. Therefore,
turbulent parameters are used in the beginning of the pro-
cess, when dust is lifted from the ground, and transported
by model winds in the later phases, when dust travels away
from the sources. The model handles dust in eight size bins,
with effective radii of 0.15, 0.25, 0.45, 0.78, 1.3, 2.2, 3.8,
and 7.1 mm. Dust is treated as a passive tracer and does not
interact with radiation or clouds. Dust is eventually settled
through rainfall and/or dry deposition processes parameter-
ized according to the scheme of Georgi (1986), which in-
cludes deposition by surface turbulent and Brownian diffu-
sion, gravitational settling, and impact on surface elements.
   In order to test the use of NDVI for source characteri-
zation, the model is set up with a horizontal resolution of
0.1◦ ×0.1◦ , covering the Arabian Peninsula parts of SW Asia
and parts of NE Africa (Fig. 1). In the vertical we use 28        Figure 1. DREAM model domain and topography in meters.
levels stretching from the surface to the top of the atmo-
sphere. August 2016 has been selected as a test period for
the model development due to the significant dust activity        a higher value could overestimate the regional dust sources.
and variability in wind properties during this month. One-        The NDVI dataset is at a finer resolution than the model grid
year runs for all of 2016 have been conducted to evaluate         (500 m × 500 m), and in order to find the potential for dust
the performance of the static and dynamic database emission       production in each model grid box, we calculate the follow-
maps. The original classification of dust sources in DREAM        ing ratio:
is based on Ginoux et al. (2001), which takes into account the                  #_of_dust_points
preferential sources related to topographic depressions and       Agrid_box =                     ,
paleolake sediments. The global mapping of dust sources in                      Total_#_of_points
Ginoux et al. (2001) is determined from the comparison be-        where #_of_dust_points is the number of points with NDVI
tween the elevation of surface grid points at 1◦ ×1◦ resolution   values smaller than 0.1. This approach allows for a dynamic
with the surrounding hydrological basins and with the 1◦ ×1◦      description of dust source areas over the model domain to re-
AVHRR (Advanced Very High Resolution Radiometer) veg-             place the previously used static database. Moreover, the scal-
etation map (DeFries and Townshend, 1994). Recent studies         ing of satellite data over model grid points allows the use of
indicated the contribution of both natural and anthropogenic      the same algorithm for different model configurations. Sev-
dust sources to the overall dust emissions detected by the        eral mountains in the area (e.g., the Sarawat Mountains along
MODIS Deep Blue product (Ginoux et al., 2012) and also            the Red Sea coast and the Zagros Mountains in Iraq) could
the relevance of local geomorphological conditions and sed-       be misclassified as dust sources due to low NDVI values.
iment supply (Parajuli and Zender, 2017) for the global dust      In order to exclude such unrealistic emissions from non-soil
emissions. All these advances in dust emissions are based on      bare areas or snow-covered areas we have applied a limit of
static map considerations.                                        zero dust production above 2500 m over the entire domain.
   In our work, a numerical procedure has been developed to       This simple approach has been selected in order to keep our
insert the NDVI satellite information into the model and to       straightforward NDVI mapping independent of vegetation
update such information each time the NDVI changes during         and soil information. The threshold value of 2500 m does not
the simulation period. We assume that regions with NDVI           suppress the emissions from lowlands and hillsides (e.g., the
values from 0 to 0.1 correspond to bare soil and therefore        coastal areas of the Hejaz Mountains in the Red Sea that have
can be efficient sources (“dust points”; DeFries and Town-        been identified as dust hot spots by Anisimov et al., 2017).
shend, 1994; Solomos et al., 2017). In general it is not easy        In Fig. 2a we show the static sources in the original model
to define a global threshold value for all satellite NDVI sen-    version with a factor of 0 to 1 depending on the source area
sors and all vegetation types worldwide. For example Kim          strength. Accordingly in Fig. 2b we show the new dynamic
et al. (2013) used a threshold of 0.15 to define global dust      sources for 1–16 August 2016. The two dust source patterns
sources based on AVHRR retrievals (Tucker et al., 2005;           present remarkable differences especially over western Saudi
Brown et al., 2006). Here we adopt the 0.1 NDVI threshold         Arabia and over Iran and Pakistan where the NDVI classifica-
due to the bareness of the specific modeling domain since         tion results in stronger emissions. In order to test the perfor-

www.geosci-model-dev.net/12/979/2019/                                                  Geosci. Model Dev., 12, 979–988, 2019

982                            S. Solomos et al.: Development of an NDVI dynamic dust source map for NMME-DREAM

mance of the new methodology, we run the model in two dif-          Secondly, we evaluate model performance using AERONET
ferent configurations: (1) using the static Ginoux et al. (2001)    AOD retrievals at eight photometric stations. AERONET is
dust source database, called DREAM-CTRL run from now                a network of sun or sky photometers that derive aerosol op-
on, and (2) using the dynamic NDVI database as described            tical and microphysical properties at a large number of sta-
above, called DREAM-NDVI run from now on. Both setups               tions around the world (Holben et al., 1998). For this evalu-
are initialized using the National Centers for Environmen-          ation, we use Version 3 AOD retrievals that, in comparison
tal Prediction Global Forecast System (NCEP GFS) analy-             with previous versions, improve automatic cloud screening
sis files (0.5◦ × 0.5◦ at 00:00, 06:00, 12:00, and 18:00 UTC),      (Giles et al., 2018). Level 2 datasets were used for all sta-
which were used for boundary conditions as well. The two            tions apart from Kuwait University, where only Level 1.5
model configurations are identical except for the dust source       data were available. Both model and AERONET AODs were
database.                                                           calculated at 532 nm; this was chosen to facilitate future in-
                                                                    tercomparing with lidar systems that frequently measure at
2.2   NDVI description                                              this wavelength (e.g., Pappalardo et al., 2014). AERONET
                                                                    measurements were converted to this wavelength using the
For the purposes of our study we used the 500 m 16-day av-          440–870 Ångström exponent and taking into account AOD
eraged NDVI from MODIS (Didan, 2015) for the period of              measurements at 440, 675, and 870 nm; in the cases where
interest. The NDVI is a normalized transform of the near-           the 440 nm AOD was not available, the 500 nm (Mezaira) or
infrared to red reflectance ratio, designed to provide a stan-      443 nm (KAUST campus) measurement was used instead.
dard for vegetation, and takes values between −1 and +1.               We evaluation model performance using five metrics:
Since it is expressed as a ratio, the NDVI has the advantage of     mean bias, root mean square error, correlation coefficient,
minimizing certain types of band-correlated noise (positively       mean fractional bias, and fractional gross error. Concretely,
correlated) and influences attributed to variations in irradi-      assuming we have n pairs of model values (mi ) and observa-
ance, clouds, atmospheric attenuation, and other parameters         tions (oi ), the mean bias (MB) is defined as
(Solano et al., 2010).
   To create an accurate time-dependent dust source map, we         MB = mi − oi ,
have utilized the NDVI derived from the MODIS-Terra in-
                                                                    where the bar denotes the mean value. The root mean square
strument. NDVI is calculated as the normalized difference of
                                                                    error (RMSE) is defined as
reflectance in the red and near-infrared channels (Rouse Jr. et              q
al., 1974; Huete et al., 2002); i.e.,
                                                                    RMSE = (mi − oi )2 .
          Xnir − Xred
NDVI =                ,                                             The correlation coefficient (r) is defined as
          Xnir + Xred
                                                                               Pn
where X represents surface reflectance as would be mea-                              (mi − m) (oi − o)
                                                                    r = qP i=1             q                    .
sured at ground level (i.e., corrected for atmospheric gas                   n            2 Pn                2
                                                                             i=1 (mi − m)        i=1 (oi − o)
and aerosol effects) in each channel. The 16-day composite
is calculated by ingesting two 8-day composite surface re-          The fractional gross error (FGE) is defined as
flectance granules, taking into account pixel quality, presence
of clouds, and viewing geometry. This procedure can lead to                   mi − o i
                                                                    FGE = 2
spatial discontinuities, as it is possible that data from differ-             mi + o i
ent days are used for adjacent pixels, each representing dif-       following Boylan and Russell (2006). Similarly, mean frac-
ferent measurement conditions. If a pixel had no useful mea-        tional bias (MFB) is defined as
surements during the 16-day period, historic data are used as
fill values (Didan et al., 2015). For terrestrial targets, NDVI               mi − oi
                                                                    MFB = 2
will take values near 0.8 for vegetated areas and near 0 for                  mi + oi
barren soil (Huete et al., 1999). The high-resolution dataset       following Chang and Hanna (2004).
was used to calculate the percentage of barren land in each
0.1◦ × 0.1◦ model grid cells, and this percentage was used to
define the effective strength of dust sources in each cell.         3   Results

2.3   Evaluation datasets and metrics                               The test simulation period is 1–31 August 2016 and the re-
                                                                    sults from both simulations are compared to MODIS and
Model evaluation is carried out with two datasets. First, the       AERONET AOD. A 5-day spin-up model run, prior to the
MODIS monthly aerosol optical depth (AOD) is use to study           experimental period, is used for establishing the dust back-
the spatial distribution of dust in the model domain. For           ground over the domain. After finalizing the experimen-
this we use the Level 3 gridded atmosphere monthly prod-            tal model configuration, we perform a complete 1-year run
uct at 1 × 1 resolution, MOD08_ME (Platnick et al., 2017).          (2016) and evaluate the results against AERONET stations.

Geosci. Model Dev., 12, 979–988, 2019                                                    www.geosci-model-dev.net/12/979/2019/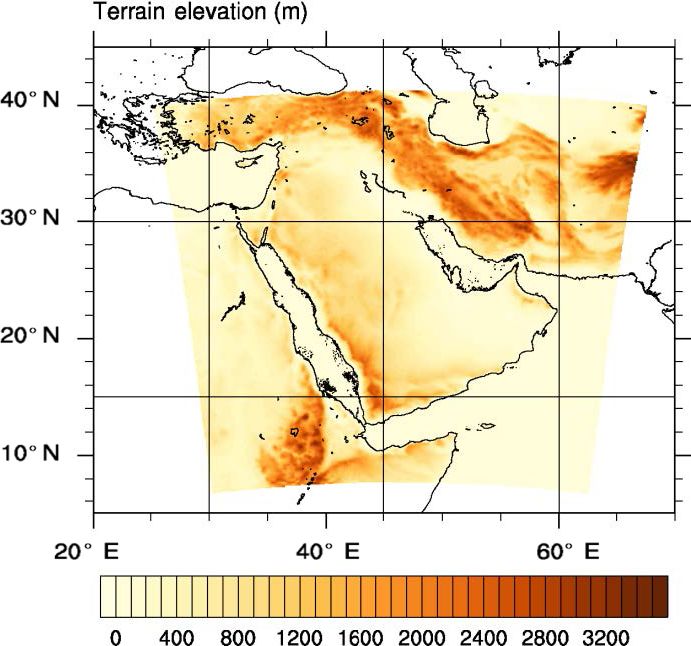
S. Solomos et al.: Development of an NDVI dynamic dust source map for NMME-DREAM                                                 983

Figure 2. Dust source strength as defined by (a) the Ginoux et al. (2001) dataset and (b) the 1–16 August 2016 mean NDVI.

                                                                      3.2   Comparison with MODIS and AERONET

                                                                      The monthly average AOD for August 2016 is shown in
                                                                      Fig. 4 for the two experimental runs (Fig. 4a, b). The
                                                                      DREAM-NDVI run results in a significantly modified spa-
                                                                      tial distribution of dust presenting increased dust loads over
                                                                      the entire domain and most profoundly over the Red Sea
                                                                      and Gulf regions (Fig. 4b). This dust pattern is closer to the
                                                                      MODIS-observed AOD over the same period that is shown
                                                                      in Fig. 4c. The MODIS AOD in this area is mostly related
                                                                      to dust; however, it must be taken into account that other
                                                                      aerosols not parameterized in the model (e.g., sea salt, sul-
                                                                      fates, nitrates) may also contribute to the observed MODIS
                                                                      AOD.
                                                                         The first step is to examine how our methodology com-
                                                                      pares against the monthly average AOD in our study area.
Figure 3. Average wind speed (color scale) and vectors from
                                                                      Therefore, the monthly average AOD values produced from
NMME-DREAMv1.0 for August 2016.
                                                                      our two simulations (DREAM-NDVI run and DREAM-
                                                                      CTRL run) are compared. More specifically, the DREAM-
                                                                      NDVI run reproduces the MODIS-observed AOD pattern
                                                                      that is in general characterized by values of 0.3–0.4 in the
3.1   Dust transport during August 2016                               NW parts of the Arabian Peninsula and by values of 0.4–0.8
                                                                      in the SE parts. Significant improvement is also evident over
                                                                      the Red Sea and NE Africa. The DREAM-NDVI run cap-
The selected 1-month period is characterized by a significant         tures the maximum observed AOD values reaching up to 1.6
variability in wind speeds and directions (Fig. 3), which al-         over the Red Sea and also the southwesterly extension of an
lows the evaluation of the new model version under different          AOD tongue of 0.3–0.8 towards Sudan. In the eastern parts of
conditions. During 1–10 August, east winds prevail over the           the modeling domain, the DREAM-NDVI run again outper-
region and increased dust concentrations are found mostly             forms the DREAM-CTRL run since it reproduces the spatial
along the central, east and south coastal areas of the Arabian        distribution of AOD 0.4–0.8 over the Arabian Sea and the
Peninsula. An anticyclonic circulation is established during          maximum of 0.8–1.2 at the SE edge of Arabian Peninsula.
10–15 August over the Arabian Desert and increased dust               Over the Gulf, the NDVI run correctly represents the 0.4–
concentrations are mostly found over the central desert areas.        0.8 AOD but the dust concentration is overpredicted at the
On 16–26 August the circulation is mainly from northerly              Strait of Hormuz and along the Iran–Pakistan coastline. This
directions and thick dust plumes are advected southwards to-          is mostly due to the prevailing NE winds during the last days
wards the Arabian Sea. The north winds veer east on 26–31             of the August 2016 modeling period and due to a possible
August, and increased dust loads are found over the Gulf on           misclassification of Iran and Pakistan grid points as effective
these dates.                                                          dust sources, thus favoring unrealistic southeasterly transport

www.geosci-model-dev.net/12/979/2019/                                                       Geosci. Model Dev., 12, 979–988, 2019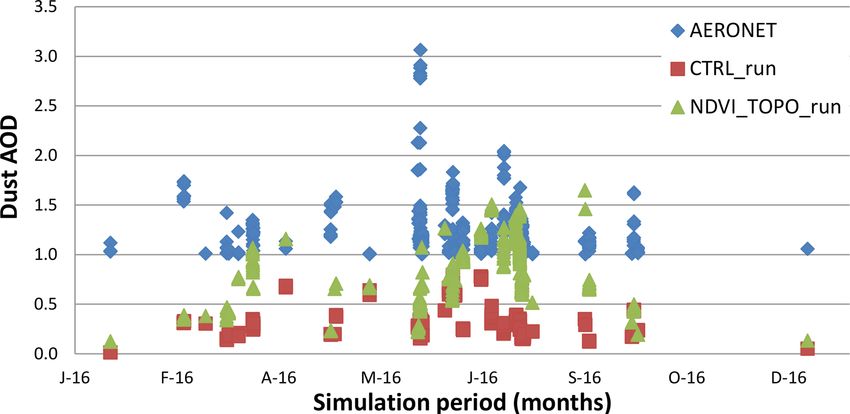
984                           S. Solomos et al.: Development of an NDVI dynamic dust source map for NMME-DREAM

                                                                 dust source areas (e.g., the Sahara) and their statistics are
                                                                 not representative for Arabian and Middle Eastern sources.
                                                                 Instead, the comparison with Arabian Peninsula stations
                                                                 (Eilat, Kuwait_University, KAUST_Campus, and Mezaira)
                                                                 provides more insight on the effects of the new source char-
                                                                 acterization. As seen in Fig. 5 and also in Table 2, these sta-
                                                                 tions clearly benefited from the experimental run.
                                                                    In general the two runs present a significant statistical dif-
                                                                 ference and, more remarkably, a reverse of bias (MODEL-
                                                                 AERONET) from negative in the DREAM-CTRL run to pos-
                                                                 itive in the DREAM-NDVI run. The DREAM-NDVI run
                                                                 produces increased AODs that are neither linearly propor-
                                                                 tional to the DREAM-CTRL run AODs nor uniformly dis-
                                                                 tributed over the domain. When considering only Arabian
                                                                 stations, the statistical metrics in Table 1 and especially the
                                                                 fractional gross error and bias are improved but the RMSE is
                                                                 increased due to the increase in maximum modeled AODs.
                                                                 In order to investigate the sensitivity of our results towards
                                                                 the severity of dust events we further assume two additional
                                                                 air quality states in Table 1: (i) dust events (AOD > 0.25)
                                                                 and (ii) severe dust episodes (AOD > 1). Both cases show
                                                                 an improvement in the bias values over the control simu-
                                                                 lations. When we consider AOD > 1, the DREAM-NDVI
                                                                 run still underestimates the observed values but with a lower
                                                                 RMSE (0.586 versus 0.983 of the DREAM-CTRL run). This
                                                                 is clearly evident in Fig. 6, where the NDVI run is indeed
                                                                 more realistic for the Arabian stations but still does not re-
                                                                 produce the extreme AOD during severe episodes. For most
                                                                 of the cases, such high AODs should be attributed to dust
                                                                 storms from convective downdrafts (haboobs). These pro-
                                                                 cesses are not resolved at mesoscale model resolutions (Solo-
                                                                 mos et al., 2012, 2017; Vukovic et al., 2014) and thus cannot
                                                                 be represented here.

Figure 4. Monthly average simulated AOD during August 2016       4   Summary and discussion
from the DREAM-CTRL run (a), the DREAM-NDVI run (b)
and (c) MODIS.                                                   In this study we present the development of a dynamic dust
                                                                 source map for implementation in NMME-DREAM v1.0
                                                                 over the Arabian Peninsula and the greater areas of the
towards the Gulf of Oman. The DREAM-NDVI AOD is also             Middle East, SW Asia, and NE Africa. Although the ma-
higher than MODIS AOD over western Saudi Arabia, indi-           jor dust sources worldwide are located in permanent deserts
cating a possible overprediction of dust sources in this area.   where the NDVI is almost always < 0.1 (e.g., Bodélé De-
   As a second step we run the same model configurations         pression, Gobi, Arabian Desert), the dynamical scaling of
(CTRL and NDVI) for the entire 2016. The modeled dust            dust emissions presented here can be important for provid-
optical depth is compared with individual AERONET mea-           ing up-to-date evidence of active dust sources over nonper-
surements. The model retrievals are interpolated in time         manent deserts. These may include dried bogs, marshes, and
to match the AERONET measurement time considering                semidesert areas as well as irrigated and nonirrigated farms
only dust-relevant measurements with an Ångström co-             where land use changes occur throughout the year. Analysis
efficient < 0.6 (Holben et al., 1998), and the results are       of the modeling results for a 1-year test period (2016) over
shown in Table 1. For completeness we first consider all         SW Asia indicated the improved performance of the new pa-
AERONET stations inside the modeling domain for the              rameterization. The DREAM-NDVI run showed a significant
evaluation. However the stations that are at the margins         increase in dust loads over the greater Arabian Peninsula area
of our domain (Cairo_EMA_2, SEDE_BOKER, AgiaMa-                  and a more realistic representation of the spatial distribution
rina_Xyliatou, and El_Farafra) are also affected by other        of AOD compared to the corresponding MODIS satellite re-

Geosci. Model Dev., 12, 979–988, 2019                                               www.geosci-model-dev.net/12/979/2019/
S. Solomos et al.: Development of an NDVI dynamic dust source map for NMME-DREAM 985 Figure 5. Density scatterplots of modeled and AERONET dust AOD at the stations of Mezaira, KAUST, Eilat, and Kuwait for 2016. trievals. These findings support the previous results by Kim from −0.933 to −0.424 at AOD > 1). However, the model et al. (2013), who also showed an increase in dust emissions statistics are not improved for all AERONET measuring sta- and a more realistic comparison with satellite observations in tions and for all air quality states (Table 2), mainly due to a Saudi Arabia through the introduction of an NDVI-based dy- possible misclassification of dust sources in the highlands of namic source mapping for the GOCART model. Comparison Iran and Pakistan. with AERONET measurements also showed significant im- The main purpose of our work was the development and provement especially at higher AODs that are also relevant to first testing of this new modeling version. A major advance the model efficiency for air quality purposes (i.e., the model of our study is the ability to implement the real-time proper- bias is reduced from −0.140 to 0.083 at AOD > 0.25 and ties of dust sources in air quality simulations (as represented www.geosci-model-dev.net/12/979/2019/ Geosci. Model Dev., 12, 979–988, 2019
986                                   S. Solomos et al.: Development of an NDVI dynamic dust source map for NMME-DREAM

Table 1. Statistical metrics from the comparison between the annual runs and AERONET.

                                               Mean bias                     RMSE                Correlation             Fractional           Mean fractional
                                           (model–observation)                                                           gross error              bias
                                           CTRL             NDVI        CTRL       NDVI        CTRL       NDVI        CTRL        NDVI       CTRL              NDVI
  AOD > 0 (all stations)                   −0.163          0.015        0.258       0.312      0.408       0.464      0.887       0.803      −0.639        0.043
  AOD > 0 (Arabian stations)               −0.142          0.122        0.252       0.332      0.340       0.426      0.644       0.515      −0.455       −0.187
  AOD > 0.25 (Arabian stations)            −0.140          0.083        0.283       0.350      0.238       0.328      0.640       0.462      −0.527       −0.142
  AOD > 1 (Arabian stations)               −0.933         −0.424        0.983       0.586      0.032       0.009      1.230       0.481      −1.211       −0.413
The AERONET stations used in this study are Eilat (29◦ N, 34◦ E), Cairo_EMA_2 (30◦ N, 31◦ E), Kuwait_University (29◦ N, 47◦ E), KAUST_Campus (22◦ N, 39◦ E),
SEDE_BOKER (30◦ N, 34◦ E), AgiaMarina_Xyliatou (35◦ N, 33◦ E), Mezaira (23◦ N, 53◦ E), and El_Farafra (27◦ N, 27◦ E).

Table 2. Statistical metrics from the annual runs (2016) at AERONET stations. Bold values indicate a correlation coefficient with p < 0.01.

       Station                            Mean bias                  RMSE                   Correlation             Fractional            Mean fractional
                                                                                                                    gross error               bias
                                      CTRL          NDVI       CTRL        NDVI         CTRL         NDVI        CTRL       NDVI          CTRL        NDVI
       AgiaMarina_Xyliatou           −0.188       −0.185        0.226      0.224      −0.005        0.001        1.825      1.780       −1.828       −1.767
       Cairo_EMA_2                   −0.355       −0.344        0.406      0.399      −0.053        0.018        1.689      1.646       −1.687       −1.591
       Eilat                         −0.138        0.006        0.186      0.165       0.110        0.312        1.183      0.610       −1.166        0.034
       El_Farafra                    −0.186       −0.190        0.259      0.263       0.170        0.138        1.155      1.248       −1.218       −1.257
       KAUST_Campus                  −0.245        0.152        0.322      0.376       0.412        0.386        0.966      0.609       −1.001        0.342
       Kuwait_University             −0.097        0.007        0.275      0.278       0.152        0.266        0.588      0.537       −0.290        0.018
       Mezaira                       −0.130        0.161        0.228      0.347       0.353        0.445        0.528      0.475       −0.382        0.332
       SEDE_BOKER                    −0.151       −0.125        0.198      0.201       0.030        0.034        1.202      1.209       −1.228       −0.921
       Weizmann_Institute            −0.207       −0.180        0.264      0.255      −0.088       −0.100        1.494      1.323       −1.521       −1.197

                                                                                      implemented in other atmospheric dust models at different
                                                                                      configurations and spatial coverage to improve their perfor-
                                                                                      mance.

                                                                                      Code and data availability. All code and data used in this study are
                                                                                      available upon request.

                                                                                      Author contributions. SS contributed to the conceptualization, for-
                                                                                      mal analysis, investigation, methodology, project administration, re-
Figure 6. Time series of measured and modeled dust AOD for the                        sources, software, validation, visualization, writing of the original
cases of AERONET AOD > 1.                                                             draft, review, and editing. AA contributed to the conceptualization,
                                                                                      funding acquisition, project administration, supervision, writing, re-
                                                                                      view, and editing. CS contributed to software and data curation, vi-
                                                                                      sualization, writing, review, and editing. IB contributed to concep-
by the satellite NDVI) and thus capture local or seasonal ef-                         tualization, formal analysis, software, writing, review, and editing.
fects. In general, 1 year is not sufficient for extracting robust                     SN contributed to methodology, supervision, writing, review, and
statistical results and further analysis is required to examine                       editing.
the performance of the proposed methodology over longer
time periods and also over different areas worldwide. For ex-
ample the simple approach of employing a uniform value of                             Competing interests. The authors declare that they have no conflict
NDVI < 0.1 for determining the active dust sources may not                            of interest.
be adequate to represent fine-scale land properties, and fur-
ther adjustments may be required depending on local-scale
characteristics. This new approach for the dynamic charac-
terization of active dust sources based on NDVI can be easily

Geosci. Model Dev., 12, 979–988, 2019                                                                         www.geosci-model-dev.net/12/979/2019/
S. Solomos et al.: Development of an NDVI dynamic dust source map for NMME-DREAM 987
Acknowledgements. This work was funded by a grant from the J. R., Welton, E. J., Korkin, S. V., and Lyapustin, A. I.: Advance-
National Space Science and Technology Center of the United ments in the Aerosol Robotic Network (AERONET) Version 3
Arab Emirates University under grant number NSS Center 7-2017. database – automated near-real-time quality control algorithm
The authors also acknowledge support from the BEYOND Centre with improved cloud screening for Sun photometer aerosol op-
of Excellence (FP7-REGPOT-2012-2013-1, grant agreement no. tical depth (AOD) measurements, Atmos. Meas. Tech., 12, 169–
316210) for providing financial support and computing resources. 209, https://doi.org/10.5194/amt-12-169-2019, 2019.
Ginoux, P., Chin, M., Tegen, I., Prospero, J. M., Holben, B.,
Edited by: Samuel Remy Dubovik, O., and Lin, S.-J.: Sources and distributions of dust
Reviewed by: Enric Terradellas, Sagar Parajuli, and one anonymous aerosols simulated with the GOCART model, J. Geophys. Res.,
referee 106, 20255–20273. https://doi.org/10.1029/2000JD000053,
2001.
Ginoux, P., Prospero, J. M., Gill, T. E., Hsu, N. C., and
Zhao, M.: Global-scale attribution of anthropogenic and nat-
References ural dust sources and their emission rates based on MODIS
Deep Blue aerosol products, Rev. Geophys., 50, RG3005,
Almazrouia, M., NazrulIslama, M., Jonesa, P. D., Athara, H., and https://doi.org/10.1029/2012RG000388, 2012.
AshfaqurRahmana, M.: Recent climate change in the Arabian Holben, B. N., Eck, T. F., Slutsker, I., Tanre, D., Buis, J. P., Set-
Peninsula: Seasonal rainfall and temperature climatology of zer, A., Vermote, E., Reagan, J. A., Kaufman, Y., Nakajima, T.,
Saudi Arabia for 1979–2009, Atmos. Res., 111, 29–45, 2012. Lavenu, F., Jankowiak, I., and Smirnov, A.: AERONET – a fed-
Anderson, J., Hardy, E., Roach, J., and Witmer, R.: A land use and erated instrument network and data archive for aerosol character-
land cover classification system for use with remote sensing data, ization, Remote Sens. Environ., 66, 1–16, 1998.
U.S. Geological Survey, United States Government Printing Of- Huete, A. R., Justice, C., and van Leeuwen, W., MODIS Veg-
fice, Washington, USGS Professional Paper 964, 1976. etation index (MOD 13): Algorithm Theoretical Basis Docu-
Anisimov, A., Tao, W., Stenchikov, G., Kalenderski, S., Prakash, P. ment, NASA Goddard Space Flight Center, Greenbelt, Maryland
J., Yang, Z.-L., and Shi, M.: Quantifying local-scale dust emis- 20771, 1999.
sion from the Arabian Red Sea coastal plain, Atmos. Chem. Huete, A., Didan, K., Miura, T., Rodriguez, E. P., Gao, X., and Fer-
Phys., 17, 993–1015, https://doi.org/10.5194/acp-17-993-2017, reira, L. G.: Overview of the radiometric and biophysical perfor-
2017. mance of the MODIS vegetation indices, Remote Sens. Environ.,
Boylan, J. W. and Russell, A. G.: PM and light extinction 83, 195–213, 2002.
model performance metrics, goals, and criteria for three- Janjic, Z. I., Gerrity Jr., J. P., and Nickovic, S.: An Alternative Ap-
dimensional air quality models, Atmos. Environ., 40, 4946– proach to Nonhydrostatic Modeling, Mon. Weather Rev., 129,
4959, https://doi.org/10.1016/j.atmosenv.2005.09.087, 2006. 1164–1178, 2001.
Brown, M. E., Pinzon, J. E., Didan, K., Morisette, J. T., and Tucker, Kim, D., Chin, M., Bian, H., Tan, Q., Brown, M. E., Zheng, T.,
C. J.: Evaluation of the consistency of long-term NDVI time se- You, R., Diehl, T., Ginoux, P., and Kucsera, T.: The effect of
ries derived from AVHRR, SPOT-Vegetation, SeaWIFS, MODIS the dynamic surface bareness on dust source function, emis-
and Land-SAT ETM+, IEEE T. Geosci. Remote, 44, 1787–1793, sion, and distribution, J. Geophys. Res.-Atmos., 118, 871–886,
2006. https://doi.org/10.1029/2012JD017907, 2013.
Chakraborty, A., Behera, S. K., Mujumdar, M., Ohba, R., and Yam- Kumar, P., Sokolik, I. N., and Nenes, A.: Measurements of cloud
agata, T.: Diagnosis of tropospheric moisture over Saudi Arabia condensation nuclei activity and droplet activation kinetics of
and influences of IOD and ENSO, Mon. Weather Rev., 134, 598– fresh unprocessed regional dust samples and minerals, Atmos.
617, 2006. Chem. Phys., 11, 3527–3541, https://doi.org/10.5194/acp-11-
Chang, J. C. and Hanna, S. R.: Air quality model perfor- 3527-2011, 2011.
mance evaluation, Meteorol. Atmos. Phys., 87, 167–196, Mahowald, N., Albani, S., Kok, J. F., Engelstaeder, S., Scanza, R.,
https://doi.org/10.1007/s00703-003-0070-7, 2004. Ward, D. S., and Flanner, M. G.: The size distribution of desert
DeFries, R. S. and Townshend, J. R. G.: NDVI-derived land cover dust aerosols and its impact on the Earth system, Aeolian Res.,
classifications at a global scale, Int. J. Remote Sens., 15, 3567– 15, 53–71, https://doi.org/10.1016/j.aeolia.2013.09.002, 2014
3586, https://doi.org/10.1080/01431169408954345, 1994. Mamouri, R.-E., Ansmann, A., Nisantzi, A., Solomos, S., Kallos,
Didan, K. : MOD13A1 MODIS/Terra Vegetation Indices 16-Day G., and Hadjimitsis, D. G.: Extreme dust storm over the eastern
L3 Global 500m SIN Grid V006 [Data set], NASA EOSDIS LP Mediterranean in September 2015: satellite, lidar, and surface ob-
DAAC, https://doi.org/10.5067/MODIS/MOD13A1.006, 2015. servations in the Cyprus region, Atmos. Chem. Phys., 16, 13711–
Didan, K., Munoz, A. B., Solano, R., and Huete, A.: MODIS Vege- 13724, https://doi.org/10.5194/acp-16-13711-2016, 2016.
tation Index User’s Guide (MOD13 Series); Version3.0; Univer- Mitsakou, C., Kallos, G., Papantoniou, N., Spyrou, C., Solomos, S.,
sity of Arizona, Tucson, AZ, USA, 2015. Astitha, M., and Housiadas, C.: Saharan dust levels in Greece and
Esmaeil, N., Gharagozloo, M., Rezaei, A., and Grunig, G.: Dust received inhalation doses, Atmos. Chem. Phys., 8, 7181–7192,
events, pulmonary diseases and immune system, American Jour- https://doi.org/10.5194/acp-8-7181-2008, 2008.
nal of Clinical and Experimental Immunology, 3, 20–29, 2014. Nickovic, S., Kallos, G., Papadopoulos, A., and Kakaliagou, O.: A
Georgi, F.: A particle dry-deposition parameterization scheme for in model for prediction of desert dust cycle in the atmosphere, J.
tracer transport models, J. Geophys. Res., 91, 9794–9806, 1986. Geophys. Res., 106, 18113–18129, 2001.
Giles, D. M., Sinyuk, A., Sorokin, M. G., Schafer, J. S., Smirnov,
A., Slutsker, I., Eck, T. F., Holben, B. N., Lewis, J. R., Campbell,
www.geosci-model-dev.net/12/979/2019/ Geosci. Model Dev., 12, 979–988, 2019988 S. Solomos et al.: Development of an NDVI dynamic dust source map for NMME-DREAM Nickovic, S., Cvetkovic, B., Madonna, F., Rosoldi, M., Pejanovic, Solomos, S., Kallos, G., Kushta, J., Astitha, M., Tremback, G., Petkovic, S., and Nikolic, J.: Cloud ice caused by atmo- C., Nenes, A., and Levin, Z.: An integrated modeling study spheric mineral dust – Part 1: Parameterization of ice nuclei on the effects of mineral dust and sea salt particles on concentration in the NMME-DREAM model, Atmos. Chem. clouds and precipitation, Atmos. Chem. Phys., 11, 873–892, Phys., 16, 11367–11378, https://doi.org/10.5194/acp-16-11367- https://doi.org/10.5194/acp-11-873-2011, 2011. 2016, 2016. Solomos, S., Ansmann, A., Mamouri, R.-E., Binietoglou, I., Pat- Olson, J. S., Watts, J. A., and Allison, L. J.: Carbon in Live Vege- lakas, P., Marinou, E., and Amiridis, V.: Remote sensing and tation of Major World Ecosystems, Oak Ridge National Labora- modelling analysis of the extreme dust storm hitting the Mid- tory, Oak Ridge, Tennessee, USA, Report ORNL-5862, 1983. dle East and eastern Mediterranean in September 2015, At- Pappalardo, G., Amodeo, A., Apituley, A., Comeron, A., Freuden- mos. Chem. Phys., 17, 4063–4079, https://doi.org/10.5194/acp- thaler, V., Linné, H., Ansmann, A., Bösenberg, J., D’Amico, 17-4063-2017, 2017. G., Mattis, I., Mona, L., Wandinger, U., Amiridis, V., Alados- Spyrou, C.: Direct radiative impacts of desert dust on at- Arboledas, L., Nicolae, D., and Wiegner, M.: EARLINET: to- mospheric water content, Aerosol Sci. Tech., 52, 693–701, wards an advanced sustainable European aerosol lidar network, https://doi.org/10.1080/02786826.2018.1449940, 2018. Atmos. Meas. Tech., 7, 2389–2409, https://doi.org/10.5194/amt- Spyrou, C., Kallos, G., Mitsakou, C., Athanasiadis, P., Kalogeri, C., 7-2389-2014, 2014. and Iacono, M. J.: Modeling the radiative effects of desert dust Parajuli, S. P. and Zender, C. S.: Connecting geomorphology on weather and regional climate, Atmos. Chem. Phys., 13, 5489– to dust emission through high-resolution mapping of global 5504, https://doi.org/10.5194/acp-13-5489-2013, 2013. land cover and sediment supply, Aeolian Res., 27, 47–65, Spyrou, C., Mitsakou, C., Kallos, G., Louka, P., and Vlastou, https://doi.org/10.1016/j.aeolia.2017.06.002, 2017. G.: An improved limited area model for describing the dust Pejanovic, G., Nickovic, S., Vujadinovic, M., Vukovic, A., Djurd- cycle in the atmosphere, J. Geophys. Res., 115, D17211, jevic, V., and Dacic, M.: Atmospheric deposition of minerals in https://doi.org/10.1029/2009JD013682, 2010. dust over the open ocean and possible consequences on climate, Torge, A., Macke, A., Heinold, B., and Wauer, J.: So- WCRP OSC Climate Research in Service to Society, 24–28 Oc- lar radiative transfer simulations in Saharan dust plumes: tober 2011, Denver, CO, USA, 2011. particle shapes and 3-D effect, Tellus B, 63, 770–780, Pérez, C., Nickovic, S., Baldasano, J. M., Sicard, M., Rocaden- https://doi.org/10.1111/j.1600-0889.2011.00560.x, 2011. bosch, F., and Cachorro, V. E.: A long Saharan dust event over Tucker, C. J., Pinzon, J. E., Brown, M. E., Slayback, D., Pak, E. the western Mediterranean: Lidar, Sun photometer observations, W., Mahoney, R., Vermote, E., and El Saleous, N.: An extended and regional dust modeling, J. Geophys. Res., 111, D15214, AVHRR 8-km NDVI data set compatible with MODIS and SPOT https://doi.org/10.1029/2005JD006579, 2006. vegetation NDVI data, Int. J. Remote Sens., 26, 4485–4498, Platnick, S., King, M. D., Meyer, K. G., Wind, G., Ama- 2005. rasinghe, N., Marchant, B., Arnold, G. T., Zhang, Z., Vukovic, A., Vujadinovic, M., Pejanovic, G., Andric, J., Kumjian, Hubanks, P. A., Ridgway, B., and Riedi, J. : MODIS M. R., Djurdjevic, V., Dacic, M., Prasad, A. K., El-Askary, Atmosphere L3 Monthly Product. NASA MODIS Adap- H. M., Paris, B. C., Petkovic, S., Nickovic, S., and Sprigg, tive Processing System, Goddard Space Flight Center, USA, W. A.: Numerical simulation of “an American haboob”, At- https://doi.org/10.5067/MODIS/MOD08_M3.061, 2017. mos. Chem. Phys., 14, 3211–3230, https://doi.org/10.5194/acp- Prospero J. M., Ginoux, P., Torres, O., Nicholson, S. E., and Gill, T. 14-3211-2014, 2014. E.: Environmental characterization of global sou7rces of atmo- Walko, R. L., Band, L. E., Baron, J., Kittel, T. G. F., Lammers, spheric soil dust identified with the nimbus 7 total ozone map- R., Lee, T. J., Ojima, D., Pielke Sr., R. A., Taylor, C., Tague, ping spectrometer (TOMS) absorbing aerosol product, Rev. Geo- C., Tremback, C. J., and Vidale, P. J.: Coupled atmosphere- phys., 40, 1002, https://doi.org/10.1029/2000RG000095, 2002. biophysicshydrology models for environmental modeling, J. Rouse Jr., R. H., Haas, J. A., Schell, and Deering, D. W.: Monitor- Appl. Meteorol., 39, 931–944, 2000. ing vegetation systems in the Great Plains with ERTS, NASA. Xue Y., Sellers P. J., Kinter J. L., and Shukla J.: A simplified bio- Goddard Space Flight Center 3d ERTS-1 Symp., Vol. 1, Sect. A, sphere model for global climate studies, J. Climate, 4, 345–364, 309–317, 1974. 1991. Solano, R., Didan, K., Jacobson, A., and Huete, A.: MODIS Veg- etation Index User’s Guide, ver. 2.0, Vegetation Index and Phe- nology Lab, The University of Arizona, available at: https://vip. arizona.edu/documents/MODIS/ (last access: 27 February 2019), 2010. Geosci. Model Dev., 12, 979–988, 2019 www.geosci-model-dev.net/12/979/2019/
You can also read