ZIONS PUBLIC FINANCE, INC - City of Saratoga Springs - Moderate Income Housing Report
←
→
Page content transcription
If your browser does not render page correctly, please read the page content below

City of Saratoga Springs

    ZIONS PUBLIC FINANCE, INC.

Moderate Income Housing Report

                 Zions Public Finance, Inc.
                         Commun1tY.one
                          November 2019
Saratoga Springs Moderate Income Housing
                                                                                         November 2019

  Housing Market Overview

  Housing growth and affordability has been capturing headlines across the country. The demand for new
  housing units is especially strong in Utah where the population is projected to double in the next 25-30
  years. The State’s economy is strong, having posted nearly 375,000 new jobs in the past 10 years. In
  comparison, Wyoming has grown by only 7,800 jobs, while Idaho has added 140,000 net new jobs.1

  Utah’s households are unique. The State has the lowest median age in the nation and the highest median
  household size, thereby influencing the type of housing product that is needed in the State. While Utah
  is showing signs of following national trends, with median age increasing and household size decreasing,
  demographics in Utah are still considerably different from that in the rest of the nation. However, as
  demographics change over time, housing product will also need to adapt to ensure that the needs of all
  age and income groups are met.

  While incomes in Utah are the second-fastest growing in the nation, and have grown by 46.19 percent
  between 2000 and 2017, house prices have increased even faster – at a rate of 75.1 percent over the same
  time period.2 This increasing gap between wages and home prices makes it ever more difficult for a first-
  time, or move-up, homebuyer to purchase real estate. In response to these economic conditions, many
  communities are considering strategies to reduce housing costs through a variety of means as discussed
  in this study.

  Transportation costs are a critical factor when evaluating housing affordability. In Utah County, annual
  transportation costs are $15,714, representing 25.0 percent of average incomes.3 Costs are slightly higher
  in Saratoga Springs where the annual average cost is $16,779. This is likely because the daily average
  commute time to and from Saratoga Springs is slightly higher than the County average.

  While housing affordability is a concern in Utah, home prices along the Wasatch Front are still substantially
  more affordable than in other economic centers in the West. The table below shows the ratio of average
  home prices to average household incomes.4 Salt Lake County has a ratio of 3.26. This means that the
  average home price in the County is 3.26 times the average wage, such as a home price of $326,000 and
  a wage of $100,000, or a home price of $250,000 and an average wage of $76,687.

  Table 1: Comparative Housing Affordability Index
   Area                                  2000                  2010                    Current
   Utah County                                                                          4.11
   Salt Lake County                      3.26                   3.31                    4.03
   Davis County                          2.65                   2.92                    3.40
   Weber County                                                                         2.76
   Tooele County                         2.22                   2.45                    2.74
   Wasatch Front MCD                                                                    3.26
   State of Utah                         2.99                   3.13                    3.83
   Portland, OR                                                                         5.12
   Phoenix, AZ                                                                          5.44

  1
    Zions Bank, Economic Insights
  2
    American Community Survey (ACS) 2017
  3
    Center for Neighborhood Technology (CNT.org)
  4
    CityData; National Association of Realtors

ZIONS PUBLIC FINANCE   | COMMUN1TY.ONE                                                                       1
Saratoga Springs Moderate Income Housing
                                                                                            November 2019

      Area                                  2000                    2010                   Current
      Denver, CO                                                                            5.84
      Las Vegas, NV                                                                         5.13
      San Francisco, CA                                                                     18.12

  Saratoga Springs is one of the fastest growing cities in Utah County and in the State. It is currently the
  ninth largest city in the County and is projected to become the fourth largest by 2040 surpassing Spanish
  Fork, Pleasant Grove, and Springville in size.5 With rapid growth, long-term planning is both a challenging
  and vital task to ensure that growth is beneficial to residents and businesses. Facilitating proper housing
  development that is safe, efficient and diverse in type and affordability can improve the economic
  performance in the City, promote a feeling of community, and enhance the quality of life. The type of
  residential development that occurs will be influenced by government regulations and policies, zoning,
  existing land uses, and market forces.

  This report provides all of the required elements of SB34 for housing elements of a General Plan.

  Summary of Findings

  Saratoga Springs has experienced a dramatic rise in population in recent years, much like the rest of the
  Wasatch Front. Most of the City’s affordable units are in the higher threshold of affordability (80% of
  AMI) meaning that those citizens in the lower- to mid-level thresholds (30% and 50% of AMI) may not
  have the adequate housing opportunities in the City.

  The analysis uses the following steps to evaluate housing affordability in the City:

         •   Identifies the number of households in Utah County that fall within the following income
             categories:
                 o 30% of AMI
                 o 50% of AMI
                 o 80% of AMI
         •   Calculates Saratoga Springs’ fair share of housing units needed (“demand”) to serve these income
             categories based on the ratio of the City’s households to the rest of the County6
         •   Researches the number of housing units (“supply”) in the City that are affordable (based on HUD
             guidelines) for each income category
         •   Calculates the surplus (shortage) of units in Saratoga Springs for each income category

  Based on these steps, the analysis concludes that the City could use nearly 700 additional affordable units,
  mainly to serve households with incomes less than 50% of AMI.

  Table 2: Affordable Housing Needs
                                                   30% of AMI   30% to 50% of AMI   50% to 80% of AMI       Total
      Income Level                                 $23,900           $39,800             $63,700

  5
   Governor’s Office of Management and Budget Subcounty Population Projections
  6
   Calculation Example – The 2013-2017 ACS estimates that there are 155,664 households in Utah County. 21,117 of
  those households, or 13.57 percent, are below the 30 percent AMI threshold. Therefore, the Saratoga Springs fair
  share calculation is the ACS’s estimated total number of Saratoga Springs households multiplied by that same
  percentage: (6,058 * .1357 = 822)

ZIONS PUBLIC FINANCE      | COMMUN1TY.ONE                                                                           2
Saratoga Springs Moderate Income Housing
                                                                                          November 2019

                                             30% of AMI    30% to 50% of AMI    50% to 80% of AMI         Total
      Housing Price                          $60,229           $140,702             $261,665
      Countywide HH's in Income Category      21,117            20,238               31,171
      % of All HHs Countywide                13.57%             13.00%               20.02%
      Saratoga Springs Units Needed Based
                                               822                788                  1,213             2,823
      on Fair Share of County
      Total Affordable Units in Saratoga
                                                0                 319                  1,812             2,131
      Springs
      Additional Units Needed to Meet Fair
                                               822                469                  (599)               692
      Share of County

      Saratoga Springs Actual HH's in
                                               134                387                  1,195             1,716
      Income Category
      Difference Between County
      Proportion and Saratoga Springs          688                401                   18               1,107
      Actual HHs

  As the City grows, it is anticipated that demand for affordable housing will increase proportionate to
  population growth. Over the next five years it is projected that the City will grow by 2,860 households.
  The City will need to continue to consider this growth when planning housing supply in the future.

  The City has proactively identified several strategies to diversify the existing housing stock in the City and
  serve the needs of all age and income groups. Some of these strategies include rezoning initiatives, higher
  density allowed in certain areas (especially near transit), reduced requirements for the use of accessory
  dwelling units and encouragement of more housing product types.

  Demographics Overview

  Demographic characteristics greatly influence housing demands within an area. Population growth, age,
  income and other characteristics of a city’s population determine what types of housing are desired and
  needed. A variety of housing options is also important to ensure that the needs are met in all stages of
  the lifecycle. This section evaluates these factors in Saratoga Springs in order to inform the analysis of the
  demand for units now and in the future.

  Population and Households Growth
  The City’s fast population growth increases the challenge of accurately projecting housing needs across
  all demographic groups. The City’s population was 17,781 in 2010 according to the United States 2010
  Census. The City had an estimated population at 27,780 in 20177 – an amazing 66.5 percent increase in
  just 7 years. This population makes up 6,977 households living within the City as of 2017. While Utah has
  had remarkable population growth statewide, the State’s population growth over the same time period
  was relatively much lower compared to Saratoga Springs, only 11.7 percent.

  Population is projected to be around 42,000 with 10,370 households by 2024. Population growth in the
  City has been largely linear since 2010 and the projection below is based on the expectation of the trend
  continuing. The graph below shows this projection based on historical Census data.

  7
      Source: City of Saratoga Springs

ZIONS PUBLIC FINANCE    | COMMUN1TY.ONE                                                                           3
Saratoga Springs Moderate Income Housing
                                                                                        November 2019

                          Saratoga Springs Population - Historic and Projected
      45,000
      40,000
      35,000
      30,000
      25,000
      20,000
      15,000
      10,000
        5,000
           -
                2010        2012        2014       2016        2018         2020     2022         2024

                       Historic ACS Population       Projected Population          Linear Trend

  Similar to the population, household sizes have also been steadily increasing. From 2010 to 2017 the
  average household size went from 4.05 to 4.23, a difference of 0.18 persons per household.8 The national
  trend is a decrease in household size; therefore, this study assumes the household size will follow the
  national trend and decrease back to around 4.05 by 2024, and perhaps even further thereafter. The
  projected population divided by the projected household size produces a projected number of
  households, informing the number of housing units needed (discussed in “Projected Housing Needs”).
  This estimated number of households (7,510) will be used as the current number of households in
  comparison to current housing supply.

  Table 3: Projected Population and Households
  Year                  Projected Population          Projected Household Size      Projected Households
  2019                         31,384                           4.18                        7,510
  2020                         33,268                           4.15                        8,011
  2021                         35,254                           4.13                        8,542
  2022                         37,379                           4.10                        9,114
  2023                         39,622                           4.08                        9,722
  2024                         42,000                           4.05                       10,370

  Age and Household Size
  Saratoga Springs has a median age of 21.4 years, slightly younger than the Utah County median of 24.5
  years old and much lower than the statewide median of 30.5. New developments in the southwestern
  and southern areas of the City have lowered the median age as new homes are being filled with young
  families. Block Group 490490101061 has a median age of 14.3, which is the lowest of any block group
  with boundaries within the City. 9

  8
      U.S. Census Bureau 2010 Census and ACS 2013-2017 5-Year Estimates
  9
      U.S. Census Bureau ACS 2013-2017 5-Year Estimate

ZIONS PUBLIC FINANCE    | COMMUN1TY.ONE                                                                    4
Saratoga Springs Moderate Income Housing
                                                                                                 November 2019

                      Source: U.S. Census Bureau ACS 2013-2017 5-year Estimate, Utah AGRC

  Saratoga Springs is a family-oriented community with a high average household size of 4.23 persons per
  household. Over 68 percent of the current households contain children under 18 years old and nearly half
  of the population is under the age of 18.

  Table 4: Age and Household Characteristics in Saratoga Springs
                                                   Saratoga Springs                Utah County         Utah

    HH Size                                                  4.23                       3.60           3.14
    Median Age                                               21.4                       24.5           30.5
    % of households with someone
                                                         68.1%                         49.3%          41.3%
    under 18

    % of total population under 18                       47.0%                         34.5%          30.4%

    % of total population 65 and over                        4.0%                      7.2%           10.3%
  Source: U.S. Census Bureau ACS 2013-2017 5-Year Estimate

  The population pyramid below shows a detailed breakdown of age groups compared to Utah County. The
  disproportionate distribution of the pyramid helps to highlight Saratoga Spring’s young population and
  how it compares to the average distribution in Utah County. There are more children under the age of 18
  than any other age group in the City. The next largest age group are adults between the age of 30 to 44

ZIONS PUBLIC FINANCE    | COMMUN1TY.ONE                                                                          5
Saratoga Springs Moderate Income Housing
                                                                                                                November 2019

  years old. This suggests that the predominant family profile in the City is established families with infants
  and school-age children. The smallest categories in the City are the elderly adults over the age of 75 years
  old and who constitute less than 1 percent of the total population.

                                                           Age Group Distribution
                                      Saratoga Springs                                                 Utah County
       85 years and over                                                  85 years and over
           80 to 84 years                                                     80 to 84 years
           75 to 79 years                                                     75 to 79 years
           70 to 74 years                                                     70 to 74 years
           65 to 69 years                                                     65 to 69 years
           60 to 64 years                                                     60 to 64 years
           55 to 59 years                                                     55 to 59 years
           50 to 54 years                                                     50 to 54 years
           45 to 49 years                                                     45 to 49 years
           40 to 44 years                                                     40 to 44 years
           35 to 39 years                                                     35 to 39 years
           30 to 34 years                                                     30 to 34 years
           25 to 29 years                                                     25 to 29 years
           20 to 24 years                                                     20 to 24 years
           15 to 19 years                                                     15 to 19 years
           10 to 14 years                                                     10 to 14 years
             5 to 9 years                                                       5 to 9 years
           Under 5 years                                                      Under 5 years

                        16%           8%                  8%       16%                     16%    8%                  8%         16%
                                           % Male     % Female                                         % Male     % Female
  Source: U.S. Census Bureau ACS 2013-2017 5-Year Estimate

  Income
  Saratoga Spring’s median household income is $88,804; this is $21,762 higher than the County median
  income of $67,042. The City’s median income is comparable to surrounding cities like Lehi and Herriman,
  but much higher than that of American Fork and Eagle Mountain.10

  Table 5: Median Income
                            American                                Eagle                                   Saratoga     Utah
                                            Bluffdale    Draper                      Herriman     Lehi
                              Fork                                 Mountain                                  Springs    County

       Median
                            $70,926        $105,391     $110,270    $74,885           $94,837    $85,794    $88,804    $67,042
       Income
  Source: U.S. Census Bureau ACS 2013-2017 5-year Estimate

  Over 40 percent of the households in Saratoga Springs makes over $100,000 per year, compared to 28.6
  percent countywide. Only 5.3 percent of households live on less than $35,000 in the City while 22.4
  percent of households in Utah County live at this income level or less. The largest income category is
  $100,000 to $149,999 with 27.4 percent of the City’s households in this income range.

  10
       U.S. Census Bureau ACS 2013-2017 5-Year Estimate

ZIONS PUBLIC FINANCE          | COMMUN1TY.ONE                                                                                          6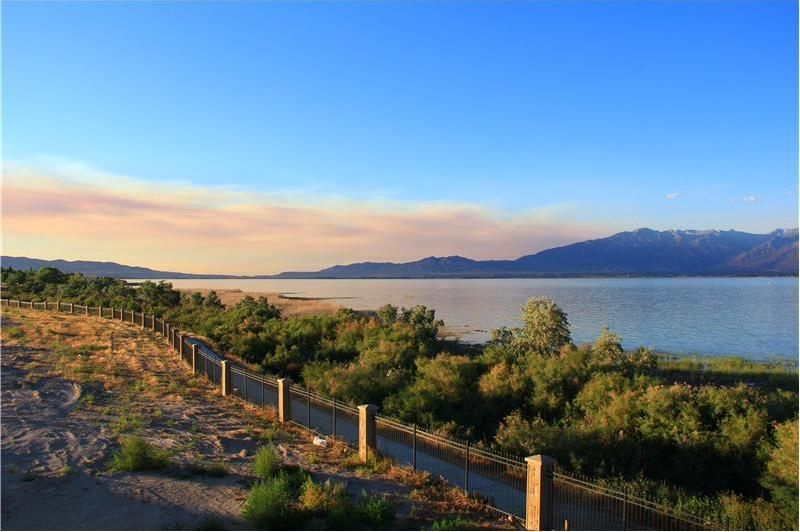
Saratoga Springs Moderate Income Housing
                                                                                                  November 2019

                                               Household Income Distribution

          $200,000 or more
   $150,000 to $199,999
   $100,000 to $149,999
        $75,000 to $99,999
        $50,000 to $74,999
        $35,000 to $49,999
        $25,000 to $34,999
        $15,000 to $24,999
        $10,000 to $14,999
          less than $10,000

                             0.0%             5.0%            10.0%          15.0%        20.0%   25.0%      30.0%

                                                   Saratoga Springs         Utah County

  Source: U.S. Census Bureau ACS 2013-2017 5-Year Estimates

  Employment
  Saratoga Springs is a commuter community with most of its residents leaving the City during the day to
  commute to their places of employment and only 313 residents working within the City’s boundaries. The
  chart below11 shows the inflow and outflow of jobs within Saratoga Springs.

                                         Source: U.S. Census Bureau, “On the Map”

  The average commuting time of 30.3 minutes for a Saratoga Springs resident is significantly longer than
  average commute times for residents of other cities in the County. The countywide average is 21.4

  11
       US Census “On the Map” Tool

ZIONS PUBLIC FINANCE    | COMMUN1TY.ONE                                                                              7
Saratoga Springs Moderate Income Housing
                                                                                                        November 2019

  minutes.12 Commuting is an important factor in housing costs as a lower cost of commuting can help a
  household afford housing.

  Residential Market Conditions Overview
  Residential market conditions in Saratoga Springs are presently considered healthy, although significant
  concerns exist regarding rising housing prices. A gap persists between the rise in incomes and housing
  prices, resulting in a local populace that has some difficulty moving through life cycle housing options.
  Overall, it is anticipated that market conditions will continue to exude demand for new housing options,
  and prices will likely show persistent upward movement.

  Competitive Markets
  Saratoga Springs is a rapidly growing city that has a major influence on surrounding cities in both northern
  Utah County and southern Salt Lake County. In order to understand the pressures on Saratoga Springs, it
  is important to analyze the demographics of neighboring cities. The following table highlights data from
  the U.S. Census and the American Community Survey, and shows median monthly housing costs, housing
  costs as a percentage of income, the percentage of single-family residences within the respective cities,
  and the percent of owner-occupied housing.

  Table 6: Comparative Housing Costs
                                                                                  Percent of Single-
                                Median Monthly            Housing Costs as %                              Percent of Owner-
       Neighboring Cities                                                         Family Homes in
                                 Housing Costs               of Income                                    Occupied Housing
                                                                                        City
   Bluffdale                          $2,045                     37%                    83%                      82%
   Lehi                               $1,564                     30%                    78%                      81%
   Eagle Mountain                     $1,167                     26%                    87%                      85%
   American Fork                      $1,370                     26%                    69%                      72%
   AVERAGE                            $1,537                     30%                    79%                      80%

   Saratoga Springs                   $1,578                     31%                      75%                    78%
  Source: U.S. Census Bureau, ACS 2013-2017 5-Year Estimate

  Saratoga Springs is largely reflective of the data shown for surrounding cities for median housing costs
  and the make-up of single-family homes and owner-occupied housing. Statistics from DataUSA, the
  American Community Survey, and the MLS are shown below that reflect the affordability indexes for each
  city. This index represents the ratio of median housing price to median household income. The higher
  the ratio, the less “affordable” a community is (a ratio of 4.0 suggests that the median household price is
  four times the median income).

  Table 7: Housing Affordability Index
                                    Median Household
       Neighboring Cities                                              Median Housing Price            Affordability Index
                                         Income
   Bluffdale                            $106,000                               $430,000                       4.0
   Lehi                                 $86,000                                $290,000                       3.4
   Eagle Mountain                       $75,000                                $240,000                       3.2
   American Fork                        $71,000                                $245,000                       3.5

   AVERAGE                                      $84,500                        $301,250                       3.5

  12
       ACS 2017 5-Year Estimate

ZIONS PUBLIC FINANCE    | COMMUN1TY.ONE                                                                                       8
Saratoga Springs Moderate Income Housing
                                                                                                      November 2019

                                         Median Household
       Neighboring Cities                                                Median Housing Price        Affordability Index
                                              Income

   Saratoga Springs                             $88,800                        $295,000                     3.3
  Source: U.S. Census Bureau, ACS 2013-2017 5-Year Estimate

  The previous data notes that Saratoga Springs has comparable or higher incomes to most surrounding
  cities but has an affordability index that is in line with the most immediately surrounding municipalities
  (temporarily excluding Bluffdale). The 3.3 indication for Saratoga Springs represents a significant increase
  from figures reflected just ten years ago that were closer to 2.5. Median housing prices have escalated at
  a rate notably higher than incomes, resulting in upward pressure on the affordability index.

  As land becomes more constrained around and within Saratoga Springs, the affordability index will most
  likely continue to rise. Most developers anticipate that construction costs will continue to rise, and, at a
  rate that exceeds the escalations in median incomes. Consequently, the affordability index will likely
  reflect upward movement. If national and regional economic conditions deteriorate, construction costs
  could decrease. Additionally, if interest rates rise, the number of qualified home buyers will decrease,
  resulting in downward pressure on achievable pricing. Median home values are considered to be more
  prone to market fluctuations than median incomes, as the latter does not always see notable declines
  during periods of market weakness.

  Of additional note is the impact of transportation costs on a household’s ability to afford housing in
  Saratoga Springs. Lending institutions are now considering with greater import the combined costs of
  housing and transportation to gauge a household’s ability to qualify for a loan. The table below highlights
  transportation costs per household, the percentage of income that transportation costs represent, the
  annual household miles driven, and the combined percentage of income spent on housing and
  transportation.

  Table 8: Comparative Housing and Transportation Costs
                                                                                                          Housing and
                               Annual Household               Transportation
                                                                                  Annual Household       Transportation
    Neighboring Cities          Transportation                 Costs as % of
                                                                                    Miles Driven          Costs as % of
                                    Costs                        Income
                                                                                                            Income
   Bluffdale                          $16,502                      27%                    27,051              63%
   Lehi                               $16,519                      27%                    26,850              56%
   Eagle Mountain                     $17,272                      28%                    28,297              51%
   American Fork                      $15,878                      26%                    25,622              52%
   AVERAGE                            $16,543                      27%                    26,955              56%

   Saratoga Springs                   $16,779                      27%                    27,806               58%
  Source: U.S. Census Bureau, ACS 2013-2017 5-Year Estimate

  As the data shows, residents in Saratoga Springs have fairly similar transportation costs as most
  surrounding cities, although combined housing and transportation costs are higher than all but Bluffdale.
  If annual transportation costs are reduced by $1,500, a typical household that could qualify for a $300,000
  home would be able to qualify for a $325,000 home at current (2019) market lending rates. Furthermore,
  if transportation costs are reduced by $2,500, that same household can qualify for a $350,000 home, as
  compared to $300,000. The potential to reduce transportation costs should be a consideration in
  providing life-cycle housing options for current and future residents of Saratoga Springs.

ZIONS PUBLIC FINANCE    | COMMUN1TY.ONE                                                                                    9
Saratoga Springs Moderate Income Housing
November 2019
Residential Investment and Development Market Conditions
Again, as noted, construction costs have had notable increases over the past several years, ultimately
resulting in upward pressure on housing prices in Saratoga Springs. Despite this factor, current developer
proformas continue to show profitability for nearly all housing types in the city. Required internal rates
of return from developers range from 15 to 25 percent, with most developers and construction firms
indicating that they will pursue new projects with a 20 percent internal rate of return as a goal. The
internal rate of return is highly sensitive to time, so projects which quickly move through the approval
process and are priced correctly show returns in excess of 25 percent. If a development is slowed due to
public opposition or changes in required design, profits can ultimately drop to levels that do not meet the
desired market returns and may ultimately lead to project abandonment.
As compared to previous years, investors are showing only minimal upward pressure on discount rates.
This suggests that they see some increase in possible risk of receiving income from their developments
(and thus the increased discount rate), but that overall, they view the market with healthy optimism.
Projections of future discount rates are always somewhat higher than what is deemed supported by the
market at present due to the perceived increase in risk with most future investments.
Current conditions in the lending market suggest a healthy market for both developers and potential
buyers. Interest rates for construction loans are at appealing levels, and banks remain interested locally
in lending to residential developers. Loan to value ratio requirements have not shown upward pressure
(a practice often noted when economic conditions worsen) in the past several years. Borrowing rates for
possible home purchasers remain low, allowing for a wide variety of possible buyers to enter the market
or move within the market. Historically, as interest rates have increased by 50 basis points (for example,
from a rate of 4.0 to 4.5), roughly ten percent of the active residential market loses its ability to qualify
for a loan. If interest rates were to notably climb, transaction volume would likely decrease. If significant
product was on the market during a period of rapid rate escalation, the effect would likely be a downward
pressure on prices. Additionally, required rates of return for developers may fall to the level where new
projects are not feasible under a rising rates scenario. If rates do increase at the same time as market
supply of product is limited, the impact to housing prices and developer proformas will be reduced.
The multi-family housing market for rentals is presently strong in the region, as well as within Saratoga
Springs. Rental rates have shown upward pressures, although not at unsustainable levels. Strong
population and regional employment growth have fueled demand for rental housing. Furthermore, as
for-sale housing prices have increased, more demand has been experienced for rental units. Occupancy
rates in Saratoga Springs are on average at 96 percent for apartment units, and rollover periods for
individual units are at less than three weeks. Both these indications suggest a tight supply market.
Rental rates for apartments have increased notably in the past several years, while data for 2018 and 2019
show healthy increases that appear sustainable going forward. Monthly rental rates are shown at prices
ranging from $1.10 to $1.50 per square foot, with the level of buildout and common area amenities having
a significant influence on price. Furthermore, smaller units reflect higher price per square foot rental rates
than larger units, all else equal. Projections by local developers suggest that apartment rental rates may
increase by three to five percent in 2020, reflecting a figure that represents healthy market conditions
and not concerns of an overheated market.
Construction proformas for apartment developments in Saratoga Springs (representing both single-level
flats and multi-story rental townhomes) indicate healthy profit potential. Apartment complexes are
selling with capitalization rates below 6.0 percent. The lower the rate the higher the value on a per square
ZIONS PUBLIC FINANCE | COMMUN1TY.ONE 10Saratoga Springs Moderate Income Housing
November 2019
foot basis, with apartment capitalization rates the lowest of all commercial and residential property types.
The low rates are reflective of the high demand for the property. Developer proformas show the ability
to provide some forms of covered parking in select areas. While developers typically indicate that the
market does not allow them to provide covered parking (due to cost issues), numerous projects in the
region have successfully implemented some variety of covered parking. Below-grade parking does not
appear feasible in most areas, but structured parking with wrapped units is successfully being
implemented in many areas. Developers have become more aggressive with charging for covered parking,
with some complexes reflecting monthly parking rents close to $80-$100 per space. This additional
income source has aided in making parking structures more feasible for the development community.
The spreadsheet on the following page shows estimated market rent and expenses for a hypothetical
apartment complex in Saratoga Springs. Market rents are based on existing, achievable rents from newer,
good quality developments in the city. Average unit sizes, additional income sources, stabilized vacancy
rates, and potential operating expenses are all derived from developer proformas. The hypothetical
example shows a range in capitalization rates and the associated sensitivity of impact that each rate has
on value. The lightly-green shaded boxes show the spread in value and costs (costs are outlined below
the shaded boxes), reflecting the potential profit margin that a developer could achieve for the risk
associated with construction and stabilization. This is not a reflection of the previous mentioned internal
rates of return.
The costs shown on the spreadsheet consider the type of proposed building construction, including
heights and consideration for parking and total lot size needed. Costs are derived from active construction
companies, the Marshall & Swift Valuation service, and various construction cost indexes utilized
throughout Utah. In this analysis, surface spaces are estimated.
Overall, the apartment construction spreadsheet shows desirable developments at both 6.0 and 6.5
percent capitalization rates. This indicates that if developers can build, stabilize, and eventually sell
projects with a capitalization rate of 6.0 or 6.5 percent (a reflection of the strength of the investment
market and the appeal of apartment development), then development will be pursued. If rates (which
are influenced by investor demand and perceived associated risk) are at 7.0 percent or higher,
development will most likely not occur unless incentives are provided, the developer has a low land cost
basis, or certain economies of scale can be applied.
ZIONS PUBLIC FINANCE | COMMUN1TY.ONE 11Saratoga Springs Moderate Income Housing
November 2019
Saratoga Springs
Direct Capitalization MULTIFAMILY
Rent Per
Number of UnitsA verage Unit Size Unit/Mont Annual
Estimated Market Rent - Multi-Family 150 950 $1,378 $2,479,500
Other Income (storage, late fees, parking, etc.) $45,000
Potential Gross Income (PGI) Total Size 142,500 $2,524,500
% of PGI
Less Stablized Vacancy 5% ($126,225)
Effective Gross Income (EGI) $2,398,275
Operating Expenses % of EGI Per Unit/Year
Management 3% ($71,948)
Reserves 1% ($23,983)
Utilities $840 ($126,000)
Maintenance & Repair $1,200 ($180,000)
Admin $450 ($67,500)
Property Taxes $1,188 ($178,200)
Insurance $480 ($72,000)
Total Expenses ($719,631)
Per unit/Year $4,798
Net Operating Income (NOI) $1,678,644
Value
Spread
With Value Spread
Costs/Per With
Capitalization Rate Value Per Unit Per Sq.Ft. Unit Costs/Sq.Ft. Profit %
6.0% $ 27,977,400 $ 186,516 $196 $ 40,007 $ 42 27.3%
6.5% $ 25,825,292 $ 172,169 $181 $ 25,659 $ 27 17.5%
7.0% $ 23,980,629 $ 159,871 $168 $ 13,361 $ 14 9.1%
COSTS
Required Total Spaces Sq.Ft. Per Total Parking Site area
Building Size Footprint Parking Spaces Needed Space Area needed
142,500 35,625 1.0 150 320 48,000 2.40
Per Sq. Ft. Total
Direct Costs - Bldg 105 $ 14,962,500
Indirect Costs - Bldg 36 $ 5,130,000
% of Indirects to
Direct - Bldg 34%
Per Space
Costs - Surface $3,500.0 $ 525,000
Total Direct/Indirect $ 20,617,500
Land Costs $13.00 $ 1,358,906
Costs + Land $ 21,976,406
Profit % of Costs + Land
0% $ -
Total Costs + Profit $ 21,976,406
Per Unit $146,509
Per Sq.Ft. $154.22
ZIONS PUBLIC FINANCE | COMMUN1TY.ONE 12Saratoga Springs Moderate Income Housing
November 2019
Newly constructed detached homes in desirable areas of Saratoga Springs are being valued at prices
typically ranging from $115 to $145 per square foot. This represents a near 15 percent increase over what
was reported in late 2017 and early 2018. Homes with higher-end finishes, larger lots, or smaller floor
plans (smaller units typically trade for higher price per square foot amounts, all else equal) have sold
above this range, while newly constructed homes with some unfinished areas or less desirable specific
locations are selling below this range.
Attached homes have traded in a wide range of prices, with this market segment typically more sensitive
in pricing to age, specific location, and varying interior buildouts. Recent sales transactions have shown
figures from $125 to $175 per square foot, with the upper end heavily influenced by size.
Most transactions are occurring at asking prices, although some areas have seen offers at amounts slightly
above listed prices. While price appreciation has somewhat slowed in recent months, future demand
driven by healthy population growth and in-migration, coupled with continually low interest rates,
suggests strong support for housing prices. As employment growth continues to surge in the surrounding
areas, Saratoga Spring’s desirability from a residential perspective should remain strong.
Current Housing Supply
The majority of housing units in Saratoga Springs are owner-occupied, single-family homes with large lot
sizes. Saratoga Springs currently has 8,934 residential parcels listed with the Utah County Assessor’s office
representing 9,173 housing units. Approximately 79 percent of those units are categorized as single-family
residences (SFRs). The median value for SFRs is $364,156 according to the County’s assessed market
values and the average lot size is 0.30 acres. In addition, the City has a senior housing facility with a total
of 116 beds. Although the senior housing facility beds are important housing resources for residents, they
are reserved for a specific age group and not available to most households as a housing choice. These
facilities will be included in the analysis where appropriate, but generally not in market affordability
considerations.
Table 9: Number of Parcels and Units by Housing Type*
Summary Total Number of Household Units Avg. Parcel Size (acres) Average Value
Apartments 240 NA NA
Condo 516 NA $188,702
Duplex 210 NA $278,023
Townhome 1,165 0.03 $250,100
Single-Family Residence 7,042 0.30 $364,156
TOTAL 9,173
Senior Housing 116 10.1 NA
Source: Utah County Recorder and Assessor Offices
* Types are as categorized and grouped determined by the parcel database.
In addition to the 9,173 dwelling units already built and listed in the Assessor’s parcel database, an
additional 451 permits have been submitted through October of 2019.13 The following graph shows that
the building of single-family homes has been fairly steady since recession recovery. This corresponds with
the consistent population growth in the City. The building permits also show the variety in housing types
built each year showing efforts by the City to provide more housing diversity.
13
University of Utah BEBR – Ivory-Boyer Construction Database; City of Saratoga Springs
ZIONS PUBLIC FINANCE | COMMUN1TY.ONE 13Saratoga Springs Moderate Income Housing
November 2019
Saratoga Springs Building Permits by Year
900
800
700
600
500
400
300
200
100
0
2003 2004 2005 2006 2007 2008 2009 2010 2011 2012 2013 2014 2015 2016 2017 2018 2019*
Single-Family Duplex and Twin Home Condos/Townhomes
Source: University of Utah BEBR – Ivory-Boyer Construction Database, Saratoga Springs Building Department
*Through October of 2019
ZIONS PUBLIC FINANCE | COMMUN1TY.ONE 14Saratoga Springs Moderate Income Housing
November 2019
The following map shows the geographic distribution of housing types in the City and visually shows the
predominance of SFRs in the City.
Source: Utah County Recorder and Assessor Offices Utah AGRC
ZIONS PUBLIC FINANCE | COMMUN1TY.ONE 15Saratoga Springs Moderate Income Housing
November 2019
The parcel database shows that 1,180 vacant residential lots are already recorded. This indicates that
there are many lots prepared for future growth.
The Census’s 2017 American Community Survey (ACS) data estimated a 17.9 percent rental rate for the
City. A comparison to other local communities shows that Saratoga Springs is below average when
compared to the renter-occupied percentages of most other local communities. The City is also lower
than Utah County’s rate as well. Bluffdale and Lehi are similar, with Herriman, Draper and American fork
having more rentals and Eagle Mountain having fewer.
Table 10: Proportion of Units that are Renter-Occupied
American Eagle Saratoga Utah
Bluffdale Draper Herriman Lehi
Fork Mountain Springs County
Percent of
Units:
24.2 17.0 20.7 14.3 20.0 19.1 17.9 32.7
Renter-
Occupied
Source: U.S. Census Bureau, ACS 2013-2017 5-Year Estimate
Saratoga Springs has a limited number of apartments. There are 240 units located at the Aldara
Apartments complex. The following tables detail the current apartments and senior living beds located in
these two complexes
Table 11: Units by Apartment Complex
Summary Address Number of Units Monthly Rental Rate
Aldara Apartments 1256 N. Commerce Drive 240
1 Bed/1 Bath 50 $1,149 - $1,299
2 Bed/1 Bath 130 $1,289 - $1,399
3 Bed/2 Bath 60 $1,369 - $1,599
Table 12: Beds by Senior Living Complex
Summary Beds
Legacy Villas 116
Source: Saratoga Springs Planning Department
The ACS estimates 92.5 percent of all rentals have a gross rent above $1,000 per month. The median gross
rent is $1,417, compared to the County’s $954.
Housing Conditions
63.7 percent of housing in Saratoga Springs was built between 2000 and 2009, and 27.7 percent built in
2010 or after. While the City experienced some slowdown during the recession years around 2010, recent
building permit data indicates that new home construction has returned to the pre-recession levels of the
mid-2000s.
ZIONS PUBLIC FINANCE | COMMUN1TY.ONE 16Saratoga Springs Moderate Income Housing
November 2019
Proportion of Housing Units by Year Built
70%
60%
50%
40%
30%
20%
10%
0%
1940- 1950- 1960- 1970- 1980- 1990- 2000-
2010
1949 1959 1969 1979 1989 1999 2009
Saratoga Springs 0.0% 0.1% 0.4% 0.2% 0.7% 0.3% 6.9% 63.7% 27.7%
Utah County 4.9% 3.4% 5.1% 5.3% 15.3% 9.4% 20.5% 28.0% 8.1%
Source: U.S. Census ACS 2013-2017 5-Year Estimate
Housing Affordability
Utah State Code and recent legislation requires municipalities to include a plan for moderate income
housing as part of a general plan. The City must outline a Plan to “facilitate a reasonable opportunity for
a variety of housing that meet the needs of people of various income levels living, working, or desiring to
live or work in the community.” The Plan must “allow people with various incomes to benefit from and
participate in all aspects of neighborhood and community life.” This Plan is designed to meet these
requirements.
Moderate income housing is defined by the U.S. Department of Housing and Urban Development (HUD)
as “housing occupied or reserved for occupancy by households with a gross household income equal to or
less than 80 percent of the median gross income for households of the same size in the county in which the
City is located.” This plan uses Area Median Income (AMI) in the Provo-Orem, UT MSA14 as determined by
HUD and average household size to determine current moderate-income thresholds for an average
household in the region.
Area Median Income Levels
According to HUD, the Median Family Income (MFI or AMI)15 for 2018 in the region is $79,600 – HUD
rounds up from $79,588. The Plan will estimate housing affordability as a percentage of this AMI. A
“moderate income” household at its most basic definition is at 80% AMI – an income of $63,700 in Utah
County. The Plan will also consider thresholds for those making 30% and 50% of AMI.
Table 13: Income Thresholds in Salt Lake City HUD Metro Fair Market Rent Area
Area Median Income 30% of AMI 50% of AMI 80% of AMI
$79,600 $23,900 $39,800 $63,700
Source: U.S. Department of Housing and Urban Development
14
This area contains Utah County, UT
15
Area Median Income (AMI) is more generally used in the industry. HUD considers the terms synonymous.
https://www.huduser.gov/portal/datasets/il/il18/FAQs-18r.pdf
ZIONS PUBLIC FINANCE | COMMUN1TY.ONE 17Saratoga Springs Moderate Income Housing
November 2019
The chart below shows the HUD income limits for Utah County. These income limits are adjusted for
family size at each income threshold and for poverty definitions, allowing for larger families to earn more
and still qualify for services. HUD does not always use 30 percent of AMI as its lowest income level; poverty
guidelines established by the Department of Health and Human Services are used if higher than 30 percent
of AMI, as is the case for Utah County. Calculations in this Plan will use the simple 30 percent threshold,
as this is the level indicated by Utah Code and legislation guidelines. The following chart is provided for
informational and contextual reasons only and is not used in calculations.
Table 14: Area Median Income Thresholds by Household Size
Household Size “Extremely Low Income” 50% of AMI 80% of AMI
1 person $16,750 $27,900 $44,600
2 persons $19,050 $31,850 $51,000
3 persons $21,550 $35,850 $57,350
4 persons $25,750 $39,800 $63,700
5 persons $30,170 $43,000 $68,800
6 persons $34,590 $46,200 $73,900
7 persons $39,010 $49,400 $79,000
8 persons $43,430 $52,550 $84,100
Source: U.S. Department of Housing and Urban Development
Using the HUD income levels, Saratoga Springs has a total of 1,716 households that are considered low-
to moderate-income households earning under the 80 percent of AMI threshold. A more comprehensive
breakdown of this figure is detailed in the table below.
Table 15: Saratoga Springs Low- and Moderate-Income Households
Affordability Number of Households Cumulative Number of HouseholdsSaratoga Springs Moderate Income Housing
November 2019
Table 16: Monthly Housing Allowance by Household Size and AMI Thresholds
Household Size 30% 50% 80% of AMI
1 person $419 $698 $1,115
2 persons $478 $796 $1,275
3 persons $538 $896 $1,434
4 persons $597 $995 $1,593
5 persons $645 $1,075 $1,720
6 persons $693 $1,155 $1,848
7 persons $741 $1,235 $1,975
8 persons $788 $1,314 $2,103
Source: ACS 2017 5-Year Estimate, HUD, ZPFI
Translating this moderate-income affordability level to home values, a family at 80 percent of AMI can
afford a home in Saratoga Springs up to $261,665. This assumes utility payments at $300 per month,
average City property tax rates, insurance, a four percent interest rate, 30-year mortgage term and a 10
percent down payment. The first table below shows the home price ranges affordable to household
income categories at various interest rates; the next table shows the ranges specific to targeted low- and
moderate-income households. Note the significant changes in affordability due to mortgage interest
rates. While current interest rates are currently at historic lows around four percent, making housing
much more affordable, affordability in the City would be more difficult to maintain if interest rates rise in
the future.
Table 17: Affordable Home Price Ranges by Income Category and Mortgage Interest Rate
Household Income Home Price Range
Range 4% Mortgage 5% Mortgage 6% Mortgage
Low High Low High Low High
$10,000 to $14,999 $0 15,179 $0 13,718 $0 12,447
$15,000 to $24,999 15,184 65,791 13,722 59,458 12,451 53,952
$25,000 to $34,999 65,796 116,403 59,462 105,198 53,956 95,456
$35,000 to $49,999 116,408 192,321 105,203 173,809 95,460 157,713
$50,000 to $74,999 192,327 318,852 173,813 288,159 157,717 261,474
$75,000 to $99,999 318,857 445,383 288,164 402,510 261,478 365,235
$100,000 to
445,388 698,444 402,515 631,211 365,239 572,757
$149,999
$150,000 to
698,449 951,505 631,216 859,913 572,761 780,279
$199,999
$200,000 or more 951,510 859,917 780,283
Source: ZPFI
Table 18: Affordable Price Ranges by Targeted Group and Interest Rate
Household Income Home Price Range
Range 4% Mortgage 5% Mortgage 6% Mortgage
Income Income
Range - Range -
Low High Low High Low High Low High
< 30% of AMI $0 $23,900 $0 $60,229 $0 $54,431 $0 $49,390
30% to 50% of AMI $23,900 $39,800 $60,229 $140,702 $54,431 $127,158 $49,390 $115,382
50% to 80% of AMI $39,800 $63,700 $140,702 $261,665 $127,158 $236,477 $115,382 $214,578
Source: ZPFI
ZIONS PUBLIC FINANCE | COMMUN1TY.ONE 19Saratoga Springs Moderate Income Housing
November 2019
As Saratoga Springs continues to grow, there is a chance that the average household size may decrease
as the City follows national trends and as a greater diversity of housing product is made available in the
City. The table below shows the affordable price ranges of a three-person household size to show the
impact a reduced household size has on the affordability threshold of the City. In this case, the
affordability threshold for a household of three making 80 percent of AMI is $229,527 at a four percent
interest rate. This is $32,138 lower than the comparable $261,665 cost for a household of four shown in
the previous table.
Table 19: Affordable Price Ranges by Targeted Group and Interest Rate (3-Person Household)
Household Income Home Price Range
Range 4% Mortgage 5% Mortgage 6% Mortgage
Income Income
Range - Range -
Low High Low High Low High Low High
< 30% of AMI $0 $21,510 $0 $48,132 $0 $43,499 $0 $39,471
30% to 50% of AMI $21,510 $35,850 $48,132 $120,710 $43,499 $109,091 $39,471 $98,988
50% to 80% of AMI $35,850 $57,350 $120,710 $229,527 $109,091 $207,432 $98,988 $188,223
Source: ZPFI
Housing Unit Pricing and Affordability
In considering affordability, there are two types of housing costs: the costs to purchase (and likely pay a
mortgage) or the rental costs of a unit. For purposes of analyzing housing costs, SFR, Condo, Townhome,
and Duplex units will be analyzed on their market value since they can be bought and sold by individual
owners and are primarily owner-occupied. The affordability of these units is analyzed based on their
market value as assessed by the County.
Market Value Properties – SFR, Condo and Duplex
The table below shows the distribution of 8,931 SFR, Duplex, Townhome, and Condo units by home value
in Saratoga Springs, as assessed and maintained by the Utah County Assessor. The average assessed value
in the City is $337,116 and should be somewhat reflective of actual market value. The average value is
substantially higher than the affordable threshold (80% of AMI) of $261,665.
Approximately 21 percent (1,891 units) of units available for sale to individual households are affordable
to individuals making 80 percent of AMI. Of these units, only 319 units are attainable at the 50 percent
affordability threshold and there are none at the 30 percent level.
Table 20: Residential Unit Values
Home Value # of Units % of Total Cumulative % TotalSaratoga Springs Moderate Income Housing
November 2019
Home Value # of Units % of Total Cumulative % Total
$220,000 - $239,999 251 2.81% 12.76%
$240,000 - $259,999 646 7.23% 19.99%
$260,000 - $279,999 803 8.99% 28.98%
$280,000 - $299,999 704 7.88% 36.86%
$300,000 - $324,999 915 10.24% 47.11%
$325,000 - $349,999 1002 11.22% 58.32%
$350,000 - $374,999 1001 11.21% 69.53%
$375,000 - $399,999 879 9.84% 79.37%
$400,000 - $424,999 604 6.76% 86.13%
$425,000 - $449,999 421 4.71% 90.84%
$450,000 - $474,999 234 2.62% 93.46%
$475,000 - $499,999 171 1.91% 95.38%
$500,000 - $549,999 170 1.90% 97.28%
$550,000 - $599,999 61 0.68% 97.96%
$600,000 - $649,999 44 0.49% 98.46%
$650,000 - $699,999 40 0.45% 98.90%
$700,000 - $749,999 21 0.24% 99.14%
$750,000 - $799,999 21 0.24% 99.37%
$800,000 - $899,999 23 0.26% 99.63%
$900,000 - $999,999 10 0.11% 99.74%
$1,000,000+ 23 0.26% 100.00%
Source: Utah County Parcel Database, ZPFI
Number of Housing Units by Market Value
1,200
1,000
800
600
400
200
0Saratoga Springs Moderate Income Housing
November 2019
The map below shows the value of the residential parcels in Saratoga Springs. It shows that housing prices
tend to increase as property gets closer to Utah Lake with most shoreline properties assessed at over
$600,000 in value. Most of the lower valued homes are smaller parcels and are located in the northern
part of the city.
Source: Utah County Recorder and Assessor Offices, Utah AGRC, ZPFI
ZIONS PUBLIC FINANCE | COMMUN1TY.ONE 22Saratoga Springs Moderate Income Housing
November 2019
The next map shows the locations of the units affordable at the 80 percent AMI or below throughout the
City and indicates that there are affordable units spread throughout the entire City.
Source: Utah County Recorder and Assessor Offices, Utah AGRC, ZPFI
ZIONS PUBLIC FINANCE | COMMUN1TY.ONE 23Saratoga Springs Moderate Income Housing
November 2019
Rental Properties – Multi-Family Complexes
All the rental units at the Aldara Apartment complex classify as affordable, but rental rates place all
current units in the upper threshold of affordability. This means many households who are under 50
percent of the AMI do not have access to affordable rental units. These rental units are important options
for households that do not have down payment savings, would have trouble with loan approval, or simply
for those not wishing to make a large commitment on purchasing a home. These households are often
those with the highest need for affordable housing.
Combined Supply and Demand
The table below shows the estimated number of cumulative units at each affordability threshold of all
housing types – SFR, Condo, Duplex and Apartments – and how those units match up with current demand
of households within the City. There is a total of 2,131 affordable units and 1,716 low- to moderate-
income households, an adequate supply of affordable units in comparison to current City demographics.
However, there is not an adequate supply of housing for those making less than 50 percent of AMI. These
statistics must be further compared to the need in all of Utah County.
Table 21: Affordable Housing Unit Availability by Income Threshold
Cumulative Total Cumulative Cumulative
Cumulative Current
Affordable Number of Percentage of
Affordability Percentage of Cumulative
Housing Units Households at Households at
Affordable Units Shortage
Available Income Level Income Level
30% of AMI 0 0.00% 134 2.18% 134
50% of AMI 319 3.48% 521 8.49% 202
80% of AMI 2,131 23.23% 1,716 27.95% (415)*
*Indicates surplus of affordable units
Affordable Housing – Utah County Comparison
This section compares Saratoga Springs to Utah County in the interest of regional context. About 35
percent of households in the County make less than $50,000 per year, compared to 16 percent of
households in Saratoga Springs. In this regard, Saratoga Springs is not representing lower-income
households relative to the County.
Table 22: Income Distributions in Saratoga Springs and Utah County
Saratoga Springs Utah County
Income Category Saratoga Springs Utah County
Cumulative Cumulative
Less than $10,000 1.40% 1.40% 4.20% 4.20%
$10,000 to $14,999 0.10% 1.50% 3.10% 7.30%
$15,000 to $24,999 0.80% 2.30% 7.00% 14.30%
$25,000 to $34,999 3.00% 5.30% 8.10% 22.40%
$35,000 to $49,999 10.50% 15.80% 12.80% 35.20%
$50,000 to $74,999 23.00% 38.80% 20.70% 55.90%
$75,000 to $99,999 18.40% 57.20% 15.40% 71.30%
$100,000 to $149,000 27.40% 84.60% 17.60% 88.90%
$150,000 to $199,999 11.10% 95.70% 6.10% 95.00%
$200,000 or more 4.40% 100.00% 4.90% 100.00%
Source: U.S. Census Bureau, ACS 2013-2017 5-Year Estimate
ZIONS PUBLIC FINANCE | COMMUN1TY.ONE 24Saratoga Springs Moderate Income Housing
November 2019
If the County’s income distributions were applied to the current number of Saratoga Springs households,
the demand for housing units at 30 and 50 percent of AMI would increase substantially. The table below
explores this would-be distribution, as well as how the current affordable units compare to that
hypothesized figure. It shows a far greater need for housing units for lower-income thresholds than the
actual need for current Saratoga Springs households. The higher threshold (households at 80 percent) is
where most of the City’s current affordable housing is found and would still be sufficient to meet the
demand for affordable housing at that level of income.
Table 23: Hypothetical Number of Affordable Units to Meet County Income Proportions
30% of 30% to 50% of 50% to 80% of
Total
AMI AMI AMI
Income Level $23,900 $39,800 $63,700
Housing Price $60,229 $140,702 $261,665
Countywide HH's in Income Category 21,117 20,238 31,171
% of All HHs Countywide 13.57% 13.00% 20.02%
Saratoga Springs Units Needed Based on
822 788 1,213 2,823
Fair Share of County
Total Affordable Units in Saratoga Springs 0 319 1,812 2,131
Additional Units Needed to Meet Fair Share
822 469 (599) 692
of County
Saratoga Springs Actual HH's in Income
134 387 1,195 1,716
Category
Difference Between County Proportion and
688 401 18 1,107
Saratoga Springs Actual HHs
Source: U.S. Census Bureau, ACS 2013-2017 5-Year Estimate
Projected Housing Needs
Population growth is rapid throughout Utah and especially the Wasatch Front. The Kem C. Gardner
Institute recently produced a report that found, for the first time, there are more households than
household units, which is a major reason behind rising home prices. In addition, current supply may not
be meeting the broad range of needs or desires of potential homeowners. Combined with slow wage
growth, rising material costs and a shortage of skilled construction workers, any measures the City can
take to actively work towards providing a diverse range of housing units will help residents and families
dramatically.
A significant age gap in the City is young adults in their 20s. There is also a large gap in the City’s number
of residents who are over the age of 50. While part of this could be a result of lifestyle factors, it can also
be indicative of the current housing supply not adequately meeting full life-cycle housing demands. There
may not be sufficient apartments to house young adults who have yet to start families and there may not
be enough options for “empty-nesters” who no longer have children living at home and who want to
downsize.
As the population and number of households continues to rise, the City will have greater need to provide
housing that meets the needs of residents and those interested in moving to the City. The current surplus
(for households at 80 percent of AMI) will provide the additional units needed until 2023, meaning that
ZIONS PUBLIC FINANCE | COMMUN1TY.ONE 25Saratoga Springs Moderate Income Housing
November 2019
(assuming current distributions of household incomes) the City will have a deficit of 239 affordable houses
by 2024. However, an analysis based on the County’s proportion of income as shown in Table 21 shows
that the demand for affordable housing in the County will increase the number of affordable units needed
within the next 5 years. When considering the County’s income levels, Saratoga Springs has a deficit of
692 affordable housing units in 2019. That number is projected to increase to a deficit of 1,767 units by
2024. Due to the incredible growth in the area, it is not unlikely that the need for affordable housing may
increase even more quickly than the historical average. Therefore, the City may still find it necessary to
plan for unexpected demands in affordable housing by continuing to facilitate low-cost housing even
though there is sufficient current supply for those households at 80 percent of AMI. There is a current
shortage of housing units for households at 50 percent and 30 percent of AMI.
Table 24: Projected Affordable Housing Need
Utah County Proportion
Projected Total
Projected Total Surplus (Deficit) of Projected Total
Year Moderate-Income
Households Affordable Units Moderate-Income Surplus (Deficit) of
Households
Households Affordable Units
2019 7,510 1,716 415 2,823 (692)
2020 8,011 1,830 300 3,011 (880)
2021 8,542 1,952 179 3,211 (1,080)
2022 9,114 2,083 48 3,426 (1,295)
2023 9,722 2,221 (91) 3,654 (1,523)
2024 10,370 2,370 (239) 3,898 (1,767)
Source: Utah County Assessor’s Database, ZPFI
Financial Resources
Listed below are various funding resources available to development within Saratoga Springs and sources
relevant to the City’s affordable and special needs. They are from a variety of local, state and federal
sources.
Local, Non-Profit, and Private Sources
Rocky Mountain Community Reinvestment Corporation (AKA Utah Community Reinvestment
Corporation)
This multi-bank consortium provides financing for multi-family housing developments for low- and
moderate-income households. Support includes loans, tax-exempt bonds and equity capital.
Down Payment Assistance
Consideration could be given to the creation of a down payment assistance fund which could be used for
down payment assistance for qualifying first-time homebuyers wishing to purchase a home in Saratoga
Springs making under 80% of the Area Median Income (AMI). The city of Asheville, NC operates a program
of this type. Their program also offers special assistance towards qualifying full-time city employees,
police officers and firefighters, as well as qualifying full-time school employees.
ZIONS PUBLIC FINANCE | COMMUN1TY.ONE 26Saratoga Springs Moderate Income Housing
November 2019
State Sources
Critical Needs Housing
The most useful application to the City of this appropriation is grants to be matched against other funding
sources for accessibility design and down payment assistance. These funds must be used to serve those
with income at or below 125 percent of the federal poverty guideline.
Olene Walker Housing Loan Fund
This State fund is the primary source of State-level housing assistance, providing funding for rehabilitation
and development of affordable and special needs housing. Funds are available for individual use for very
low-income, low-income and moderate-income persons as defined by HUD. There are two programs
within this fund of special interest to the City:
1. The Community Driven Housing Fund within the Olene Walker Housing Fund is specifically
intended to help cities develop affordable and special needs housing. This program helps set up
partnerships with developers, guides the development process, and can assist with gap financing
to make affordable housing more feasible to developers. The City can use this program in direct
development assistance for needs identified in this study.
2. The HomeChoice program helps low- and moderate-income households or households with a
disabled member buy affordable housing. The program funds 30 percent of the purchase price
through a second mortgage with a one percent interest rate. This makes monthly payments much
more affordable, reducing the housing cost burden.
3. The Multi-family program provides financial assistance for the acquisition, construction, or
rehabilitation of affordable rental housing of five or more units.
4. The Transportation-Oriented Development Fund will provide loan guarantees for third-party
financing to multi-family developers. The Board intends for these guarantee funds to revolve as
loan guarantees are fulfilled. An element of the selection process is that the project targets
households at less than 80 percent of AMI.
5. Individual Development Accounts: OWHLF supports savers participating in Individual
Development Accounts with AAA Fair Credit. Savers receive federal and state matching funds for
use in down payments and closing costs.
Utah Housing Corporation
Created in 1975, the Utah Housing Corporation was created through the Legislature to provide a supply
of money to make mortgage loans and reasonable interest rates. The UHC also partners with developers
and investors to use State and Federal Tax Credits and bond financing on multifamily projects for low-
income families, senior citizens and more. Additionally, UHC administers Low Income Housing Tax Credits.
These credits are a dollar for dollar reduction of tax liability for owners and investors of low-income
housing for ten years. The amount of the credit is based on the costs of the project and the number of
units that will be reserved for low-income households.17
17
https://utahhousingcorp.org/about/programs
ZIONS PUBLIC FINANCE | COMMUN1TY.ONE 27You can also read