With PGMs Innovation PLG:NYSE.A | PTM:TSX
←
→
Page content transcription
If your browser does not render page correctly, please read the page content below
PLG:NYSE.A | PTM:TSX

Innovation
with PGMs
March 22, 2021
PLG:NYSE.A
                                                                                                                                                                              PTM:TSX

Disclosure
Technical and Scientific Information                           mineral resource estimates and a general discussion of       amount of uncertainty as to their existence, and great
This presentation has been prepared by Platinum Group          the extent to which the mineral resource estimates and       uncertainty as to their economic and legal feasibility. It
Metals Ltd. (“Platinum Group” or the “Company”).               the other estimates and projections included in the          cannot be assumed that all or any part of an inferred
Information included in this presentation regarding the        reports may be materially affected by any known              mineral resource will ever be upgraded to a higher
Company’s mineral properties has been compiled by R.           environmental, permitting, legal, taxation, socio-political, category. Under Canadian securities laws, estimates of
Michael Jones, P.Eng, the President and Chief Executive        marketing, or other relevant issues.                         inferred mineral resources may not form the basis of
Officer of the Company, and a non-independent Qualified                                                                     feasibility or pre-feasibility studies, except in rare cases.
Person for purposes of National Instrument 43-101 -            Cautionary Note to United States Investors                   Additionally, disclosure of "contained ounces" in a
Standards of Disclosure for Mineral Projects (“NI 43-          Estimates of mineralization and other technical              resource is permitted disclosure under Canadian
101”), based on independent information filed by the           information included or referenced in this presentation      securities laws; however, the SEC normally only permits
Company with the Canadian securities regulators and the        have been prepared in accordance with NI 43-101. The         issuers to report mineralization that does not constitute
U.S. Securities and Exchange Commission (“SEC”). R.            definitions of proven and probable reserves used in NI       "reserves" by SEC standards as in place tonnage and
Michael Jones, the QP who has compiled the technical           43-101 differ from the definitions in SEC Industry Guide 7. grade without reference to unit measurements.
info for the presentation, has approved the written            Under SEC Industry Guide 7 standards, a "final" or           Accordingly, information contained or referenced in this
disclosure regarding technical and scientific information in   "bankable" feasibility study is required to report reserves, presentation containing descriptions of the Company's
this presentation. For more detailed information regarding     the three-year historical average price is used in any       mineral deposits may not be comparable to similar
the Company and its mineral properties, you should refer       reserve or cash-flow analysis to designate reserves and      information made public by U.S. companies subject to the
to the Company’s independent technical reports and             the primary environmental analysis or the report must be reporting and disclosure requirements of United States
other filings with the Canadian securities regulators and      filed with the appropriate governmental authority. As a      federal securities laws and the rules and regulations
the SEC, which are available at www.sedar.com and              result, the reserves reported by the Company in              thereunder.
www.sec.gov, respectively. Scientific and technical            accordance with NI 43-101 may not qualify as "reserves"
information contained herein is derived from the               under SEC standards. In addition, the terms "mineral         COVID 19
Company’s technical reports. Information contained             resource", "measured mineral resource", "indicated           The recent COVID-19 pandemic and related measures
herein related to the Waterberg Definitive Feasibility         mineral resource" and "inferred mineral resource" are        taken by government create uncertainty and have had,
Study and associated Reserve and Resource Update can           defined in and required to be disclosed by NI 43-101;        and may continue to have, an adverse impact on many
be found in the October 4, 2019 technical report entitled,     however, these terms are not defined terms under SEC         aspects of the Company’s business, including employee
“Waterberg Project Definitive Feasibility Study and            Industry Guide 7 and normally are not permitted to be        health, workforce productivity and availability, travel
Mineral Resource Update.” www.sedar.com and                    used in reports and registration statements filed with the   restrictions, contractor availability, supply availability, the
www.sec.gov. Reference is made to such reports for             SEC. Mineral resources that are not mineral reserves do Company’s ability to maintain its controls and procedures
more detailed information with respect to the Company’s        not have demonstrated economic viability. Investors are      regarding financial and disclosure matters and the
properties, including details of quality and grade of each     cautioned not to assume that any part or all of the mineral availability of insurance and the costs thereof, some of
mineral resource estimate, details of the key                  deposits in these categories will ever be converted into     which, individually or when aggregated with other
assumptions, methods and parameters used in the                reserves; "inferred mineral resources" have a great          impacts, may be material to the Company.

                           Innovation with PGMs                                                                                                                                           2
PLG:NYSE.A
                                                                                                                                                                                   PTM:TSX

Forward Looking Statements
This presentation contains forward-looking information           various factors, including possible adverse impacts due the      corruption; the Company may become subject to the U.S.
within the meaning of Canadian securities laws and               global outbreak of COVID-19, the appeal of the mining            Investment Company Act; exploration, development and
forward-looking statements within the meaning of U.S.            right, the applicable procedures, timeline and potential         mining risks and the inherently dangerous nature of the
securities laws (collectively “forward-looking statements”).     results of such appeal; the Company’s inability to generate      mining industry, and the risk of inadequate insurance or
Forward-looking statements are typically identified by           sufficient cash flow or raise sufficient additional capital to   inability to obtain insurance to cover these risks and other
words such as: believe, expect, anticipate, intend, estimate,    make payment on its indebtedness, and to comply with the         risks and uncertainties; property and mineral title risks
plans, postulate and similar expressions, or are those,          terms of such indebtedness; additional financing                 including defective title to mineral claims or property;
which, by their nature, refer to future events. All statements   requirements; the Company’s credit facility (the “Sprott         changes in national and local government legislation,
that are not statements of historical fact are forward-looking   Facility”) with Sprott Resource Private Lending II               taxation, controls, regulations and political or economic
statements. Forward-looking statements in this                   (Collector), LP (“Sprott”) and the other lenders party thereto   developments in Canada and South Africa; equipment
presentation include, without limitation, statements             is, and any new indebtedness may be, secured and the             shortages and the ability of the Company to acquire
regarding the projections and assumptions relating to the        Company has pledged its shares of Platinum Group Metals          necessary access rights and infrastructure for its mineral
DFS, including, without limitation NPV, IRR, costs, mine         (RSA) Proprietary Limited (“PTM RSA”), and PTM RSA has           properties; environmental regulations and the ability to
life, payback periods, margins, exchange rates, inflation,       pledged its shares of Waterberg JV Resources (Pty)               obtain and maintain necessary permits, including
recoveries, grades, potential production of the Waterberg        Limited (“Waterberg JV Co.”) to Sprott, under the Sprott         environmental authorizations and water use licences;
Project and other operational and economic projections           Facility, which potentially could result in the loss of the      extreme competition in the mineral exploration industry;
with respect to the Waterberg Project; Waterberg Project’s       Company’s interest in PTM RSA and the Waterberg Project          delays in obtaining, or a failure to obtain, permits necessary
potential to be a bulk mineable, low cost, dominantly            in the event of a default under the Sprott Facility or any new   for current or future operations or failures to comply with the
palladium mine producing platinum and palladium based on         secured indebtedness; the Company’s history of losses and        terms of such permits; risks of doing business in South
a fully mechanized mine plan; the Waterberg Project’s            negative cash flow; the Company’s ability to continue as a       Africa, including but not limited to, labour, economic and
potential to be one of the largest and lowest cash cost          going concern; the Company’s properties may not be               political instability and potential changes to and failures to
underground platinum group metals mines globally; first          brought into a state of commercial production; uncertainty       comply with legislation; the Company’s common shares
production in late 2023 and steady state production by           of estimated production, development plans and cost              may be delisted from the NYSE American or the TSX if it
2027; the expected creation of 1,100 new highly skilled          estimates for the Waterberg Project; discrepancies               cannot maintain compliance with the applicable listing
jobs; the potential for future drilling to convert mineral       between actual and estimated mineral reserves and                requirements; and other risk factors described in the
resources into reserves, extending mine life; and the            mineral resources, between actual and estimated                  Company’s most recent Form 20-F annual report, annual
potential for underground mining of the North Mine to lower      development and operating costs, between actual and              information form and other filings with the U.S Securities
future capital costs. Mineral resource and reserve               estimated metallurgical recoveries and between estimated         and Exchange Commission (“SEC”) and Canadian
estimates are also forward-looking statements because            and actual production; fluctuations in the relative values of    securities regulators, which may be viewed at www.sec.gov
such estimates involve estimates of mineralization that may      the U.S. Dollar, the Rand and the Canadian Dollar; volatility    and www.sedar.com, respectively. Proposed changes in
be encountered in the future if a production decision is         in metals prices; the failure of the Company or the other        the mineral law in South Africa if implemented as proposed
made, as well as estimates of future costs and values.           shareholders to fund their pro rata share of funding             would have a material adverse effect on the Company’s
Although the Company believes the forward-looking                obligations for the Waterberg Project; any disputes or           business and potential interest in projects. Any forward-
statements in this presentation are reasonable, it can give      disagreements with the other shareholders of Waterberg JV        looking statement speaks only as of the date on which it is
no assurance that the expectations and assumptions in            Co., Mnombo Wethu Consultants (Pty) Ltd. or Maseve; the          made and, except as may be required by applicable
such statements will prove to be correct. The Company            ability of the Company to retain its key management              securities laws, the Company disclaims any intent or
cautions investors that any forward-looking statements by        employees and skilled and experienced personnel; conflicts       obligation to update any forward- looking statement,
the Company are not guarantees of future results or              of interest; litigation or other administrative proceedings      whether as a result of new information, future events or
performance and that actual results may differ materially        brought against the Company; actual or alleged breaches          results or otherwise.
from those in forward-looking statements as a result of          of governance processes or instances of fraud, bribery or

                            Innovation with PGMs                                                                                                                                               3
PLG:NYSE.A
PGMs                                                                           PTM:TSX

Innovation With PGMs

  Full Spectrum of            Safe, Modern      Key to Curbing   Invested in
        PGMs                Mechanized Mining   Climate Change   Green Tech

            Innovation with PGMs                                                       4
PLG:NYSE.A
PGMs                                                                                                                      PTM:TSX

Overview of Platinum Group Metals Ltd.
In Joint Venture with Major PGM Producers

• A large-scale low-cost mine development in                                   • Patented research and development using
  South Africa, with feasibility completed                                       PGMs in a cutting-edge lithium battery.
• 19.5 Million ounces of PGMS in reserves                                      • Supported by Anglo Platinum, world’s largest
                                                                                 PGM producer and Florida International
• Rare Palladium dominant deposit with 45+                                       University (FIU).
  year mine life
                                                                               • Focused on Lithium Air and Lithium Sulfur
• Mining right granted – February 2021                                           chemistries with 3X to 7X power to weight
• JV Partners: Implats, JOGMEC and Hanwa                                         advantage.

                              100% Waterberg Project. See Appendix and October 4, 2019 technical report - www.sedar.com

                  Innovation with PGMs                                                                                            5
PLG:NYSE.A
PGMs PTM:TSX
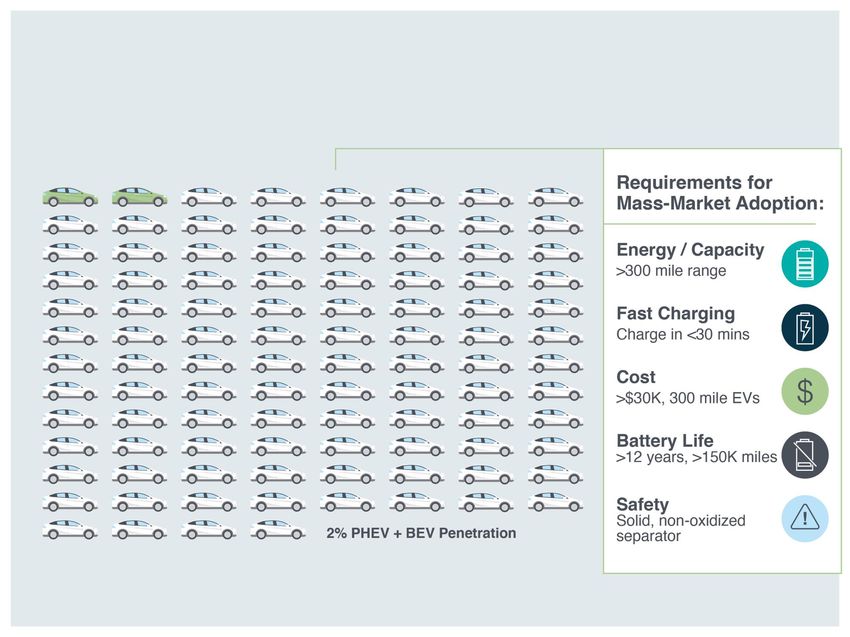
The Key to Green Transport Today
INTERNAL COMBUSTION PLUG-IN HYBRID HYBRID ELECTRIC HYDROGEN FUEL CELL ELECTRIC
Innovation with PGMs 6
PLG:NYSE.A
 PGMs                                                                                                                                       PTM:TSX

 Transportation Forecast – PGMs Critical
                                                                                                                           2050
                                   Global LDV
                                      Global LDVPowertrain   Mix
                                                 Powertrain Mix    Forecast
                                                                Forecast
                                                                                                                           Powertrain Mix
                           180                                                                     5.0
                                 Gasoline                Diesel                    Hybrid / PHEV
       Millions

                           160   BEV                     FCEV                      TW Total        4.5

                                                                                                   4.0
                                                                                                                           FCEV 8.8M or 5.4%
                           140
                                                                                                   3.5

                                                                                                         TW
                           120
       LDV Vehicle Sales

                                                                                                          TWofofEV
                                                                                                   3.0                     BEV 52M or 33%
                           100
                                                                                                   2.5

                                                                                                                 EVLiB’s
                            80

                                                                                                                   LiB's
                                                                                                   2.0                     Hybrid + PHEV 65M or
                            60
                                                                                                   1.5                     41%
                            40                                                                     1.0
                            20                                                                     0.5                     Diesel 7.3M or 4.6%
                             0                                                                     -
                                 2006
                                 2008
                                 2010
                                 2012
                                 2014
                                 2016
                                 2018
                                 2020
                                 2022
                                 2024
                                 2026
                                 2028
                                 2030
                                 2032
                                 2034
                                 2036
                                 2038
                                 2040
                                 2042
                                 2044
                                 2046
                                 2048
                                 2050
                                                                                                                           Gasoline 25M or 16%
SOURCE: Precious Metals Commodity Management LLC
FCEV: Fuel Cell Electric Vehicle, BEV: Battery Electric Vehicle, PHEV: Plug-In Hybrid Vehicle
TW: Terawatts Battery Capacity, LDV: Light Duty Vehicle

                                  Innovation with PGMs                                                                                              7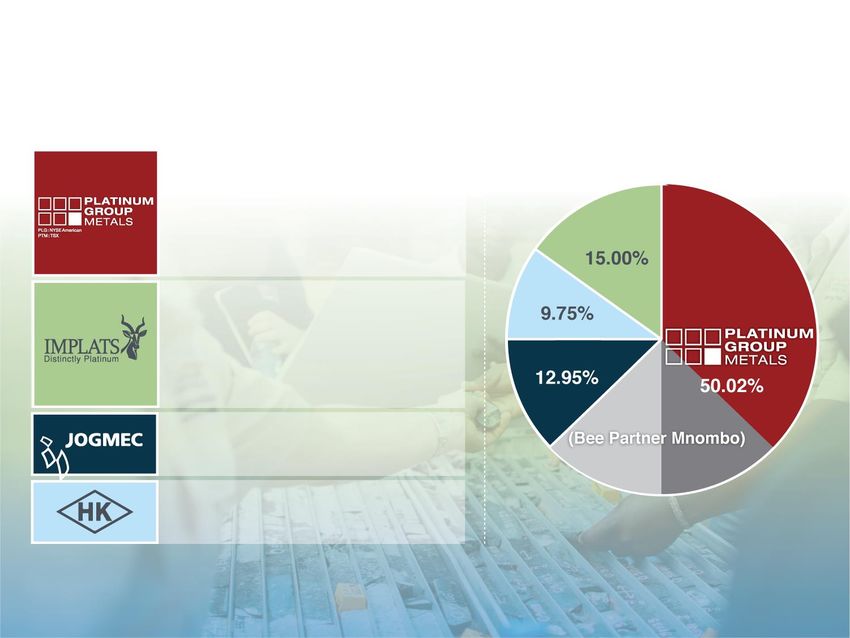
PLG:NYSE.A
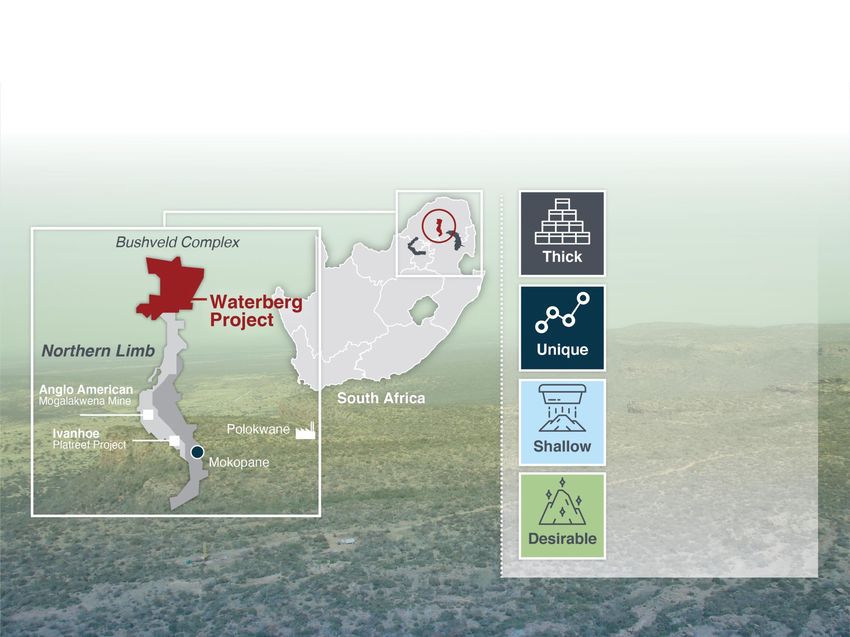
WATERBERG PTM:TSX
Bulk mechanized mining with
a higher skilled work force.
Safer to mine.
Palladium dominant with full
suite of PGMs, gold and base
metals.
Multi decline ramp access.
Lower capital costs compared to
deep vertical shafts.
Low chrome concentrate with
base metal content amenable
to existing smelters.
Innovation with PGMs 100% Waterberg Project. See Appendix and October 4, 2019 technical report - www.sedar.com 8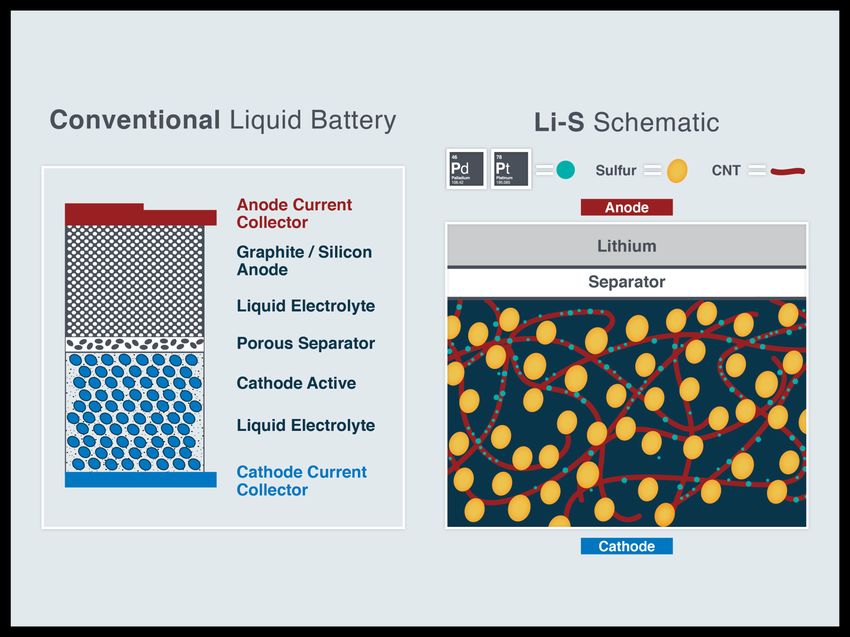
PLG:NYSE.A
 WATERBERG                                                                                                                 PTM:TSX

                                                                                              Measured Mineral Resource
 Resources Bulk Mining                                                                        Indicated Mineral Resource
                                                                                              Inferred Mineral Resource

 Waterberg                                                                               T –Zone
 Isometric view looking East

                                           8km Strike, Open
                                           Long-hole Mining
  F –Zone

            North Super F

                             Boundary Super F
                                                               Central Super F
                                                                                                   South F

North
                                                See Appendix and October 4, 2019 technical report - www.sedar.com
                    Innovation with PGMs                                                                                           9
PLG:NYSE.A
WATERBERG                                                                                                                                PTM:TSX

PGM Industry Cost Curve
                              Waterberg Low Cost and Competitive

       SOURCE: Metals Focus. Data for Waterberg is based on Platinum Group projections and is not representative of Metals Focus view.

                           100% Waterberg Project. See Appendix and October 4, 2019 technical report - www.sedar.com

             Innovation with PGMs                                                                                                               10
PLG:NYSE.A
WATERBERG PTM:TSX
Productivity Production and Reserves
Mining Method
Production of 4E koz per Annum
Conventional
Mechanized
Waterberg
Open Pit
Bubble size = Reserve oz
4E ozs per Employee per Month
SOURCE: S&P Global Market Intelligence; Fraser McGill Mining and Minerals Advisory
100% Waterberg Project. See Appendix and October 4, 2019 technical report - www.sedar.com
Innovation with PGMs 11PLG:NYSE.A
WATERBERG PTM:TSX
Commodity Price
April 16, 2021
Spot Basket Price
$2,625/4E Ounce Waterberg Basket
63%
September 4, 2019 29%
DFS Spot Basket Price
$1,425/4E Ounce
6%
2%
On Site LOM Average Cash Cost: $640/4E
September 4, 2019 DFS Spot Prices: $1,546 Pd, $980 Pt, $1,548 Au, $5,036 Rh
April 19, 2021 Spot Prices: $2,769 Pd, $1,206 Pt, $1,777 Au, $29,000 Rh
Innovation with PGMs 100% Waterberg Project. See Appendix and October 4, 2019 technical report - www.sedar.com 12PLG:NYSE.A
WATERBERG PTM:TSX
Waterberg Ownership
Platinum Group is the operator and majority
50.02% owner via a direct 37.05% interest
and an indirect 12.97% interest via BEE
partner Mnombo.
Implats is a leading producer of PGMs and
owns a 15% interest in the Waterberg Project
along with a right of first refusal for
concentrate offtake.
Japan Oil, Gas and Metals National
Corporation (JOGMEC) owns a 12.95%
interest in the Waterberg Project.
Hanwa Co., a diversified Japanese trading
company, acquired 9.75% of JOGMEC’s
interest and metal marketing rights.
Innovation with PGMs 100% Waterberg Project. See Appendix and October 4, 2019 technical report - www.sedar.com 13PLG:NYSE.A
WATERBERG PTM:TSX
Definitive Feasibility Study - Highlights
Stantec 19.5M 420,000 $640/4E
and DRA Ounces 4E Ounces Ounce
Proven and Annual On Site LOM
Principal DFS Probable Steady State Average
Consultants Reserves Production 4E Cash Cost
$2.054B $582M 32.10% 45 Years
Post Tax Estimated IRR Post Tax Mine Life
NPV8 at Peak Project at Current Based on
Current Spot Funding Spot Prices Reserves
Prices
100% Waterberg Project. See Appendix and sensitivities from the October 4, 2019 technical report - www.sedar.com
January 28, 2021 Current Spot Prices: $2,223 Pd, $1052 Pt, $1,840 Au, $16,000 Rh (Basket: $2,103/4E Ounce) ZAR/USD: 15.1
Innovation with PGMs 14PLG:NYSE.A
WATERBERG PTM:TSX
Price Sensitivity
Project value doubles from 2019 DFS at current spot metal prices.
Sept 4th 2019 (DFS) Jan. 28, 2021 Spot
NPV (8% Discount) US$982M US$2,054M
IRR 20.70% 32.10%
Project Payback 8 Years 7 Years
Peak Funding US $617M US $582M
Sept 4th 2019 (DFS) Jan. 28, 2021 Spot
Palladium (USD/oz) 1,546 2,223
Platinum (USD/oz) 980 1,052
Rhodium (USD/oz) 5,036 16,000
Gold (USD/oz) 1,548 1,840
Basket Price (USD/oz) 1,425 2,103
ZAR/USD 15 15.15
100% Waterberg Project. See Appendix and October 4, 2019 technical report - www.sedar.com Metal Ratios: Pd 63%, Pt 29% Rh 2% , Au 6%
Innovation with PGMs 15PLG:NYSE.A
WATERBERG PTM:TSX
Financial Evaluation
Undiscounted Free Cashflows Net vs. Cumulative
1 200 15 000
1 000
800 10 000
USD $2,054M
Cumulative Cashflow (USD mil Real)
NPV (Post Tax)
Net Cashflow (USD mil Real)
600
400 5 000
200 32.1%
0 0 IRR (Post Tax)
( 200)
( 400) (5 000)
6.9 Years
( 600)
Payback
( 800) (10 000)
Gross Revenue 4E
OpEx
Base Metal Credits
Project CapEx
Realisation Costs
Sustaining CapEx
USD $582M
Working Capital Royalties Tax Peak Funding
Indirects Incremental Cashflow Cumulative Cashflow (Real Terms)
100% Waterberg Project. See Appendix and sensitivities from the October 4, 2019 technical report - www.sedar.com
Based on January 28, 2021 Spot Prices: $2,223 Pd, $1052 Pt, $1,840 Au, $16,000 Rh (Basket: $2,103/4E Ounce) ZAR/USD: 15.1
Innovation with PGMs 16PLG:NYSE.A
WATERBERG PTM:TSX
Optimization and Implementation
• Implats Funded 100% of ZAR 24M Program Completed:
✓ Dry-stacking of tailings
✓ Confirmation of portal positions and detailed designs
✓ Detailed advanced simulation of initial underground mining and surface systems
✓ Battery Electric Vehicle Fleet (reduced vent/cooling & power, lower opex)
✓ Mobile Tunnel Borer Access (Master Drilling Technology)
✓ Water demand & supply studies and drilling for additional sources
✓ Permitting & community agreements – MINING RIGHT GRANTED – FEBRUARY 2021
• Execution planning involving early-works engineering & project controls – IN PROGRESS
• Partner and Offtake Discussions – IN PROGRESS
Innovation with PGMs 100% Waterberg Project. See Appendix and October 4, 2019 technical report - www.sedar.com 17PLG:NYSE.A
WATERBERG PTM:TSX
Project Timeline
Mining Right First Ore Production End of Project Construction
Q1 2021 2024 2025
Pre-Implementation Period
Project Construction (5 years)
Initial Underground Development (6 years)
Production Build-up
(3 years)
DFS Completed Decline Development Starts
September 2019 2021
Plant Commissioned Steady State
Timelines dependent upon regulatory approvals
2025 2027
and financing.
Innovation with PGMs 18PLG:NYSE.A
LiON BATTERY TECHNOLOGIES PTM:TSX
Patented Supported by Focused on
Research & Anglo Platinum Lithium Air and
Development The world’s largest Lithium Sulfur
Using PGMs in a PGM producer, and Chemistry with 3x
cutting-edge partnered with to 7x the power to
Lithium battery Florida International weight advantage
University (FIU)
Innovation with PGMs 19PLG:NYSE.A
LiON BATTERY TECHNOLOGIES PTM:TSX
Limitations on Battery Tech
Innovation with PGMs 20PLG:NYSE.A
LiON BATTERY TECHNOLOGIES PTM:TSX
Higher Energy Density Categories
Lithium-metal
anodes are
necessary to
achieve high-
energy density
Existing
Lithium-Ion
batteries are
near maximum
energy density
Gasoline
Source: Quantumscape Corp. and Industry Reports
Innovation with PGMs 21PLG:NYSE.A
LiON BATTERY TECHNOLOGIES PTM:TSX
Li-S and Li-Air have higher energy density cathodes and higher lithium content
Innovation with PGMs 22PLG:NYSE.A LiON BATTERY TECHNOLOGIES PTM:TSX Technology Benefits The Role of PGMs in the Innovative Approach to Batteries • Using Palladium/Platinum catalysts in the cathode: to improve the rate capability and reduce the charge over-potential • Using Palladium/Platinum inside Carbon for Stabilization of the electrolyte • Custom designed electrolytes – for use in many types of batteries • Published Papers Demonstrate expertise in all these areas
PLG:NYSE.A
LiON BATTERY TECHNOLOGIES                                                                                                                                PTM:TSX

Lithium + PGMs Potential
 Comparison to Tesla Model 3 Battery Modules

                                                                                 Li-Air                                                Li-S
                                    Tesla Model 3
                                                                Maximum                       Target                 Maximum                      Target
Energy                                  75 kWh¹                                 75 kWh                                              75 kWh
Weight                                   371 kg¹                   43 kg                     144 kg                    125 kg            188 kg
Cell (2170)                            4,416 cells¹             1,000 cells                3,400 cells               1,490 cells      2,235 cells
Configuration                           3.7 V/cell               2.7 V/cell                 2.7 V/cell                2.2 V/cell       2.2 V/cell
Chemistry                                 NCA                            Li-O₂                                                 Li-Sulfur
Specific energy / cell                 202 Wh/kg              1,700 Wh/kg      500 Wh/kg                             600 Wh/kg        400 Wh/kg
Cost per kWh                         $150 per kWh²          $18.5 per kWh                $63 per kWh                $47 per kWh              $71 per kWh
Cost per kg                            $31 per kg               $33 per kg                 $33 per kg                $28 per kg                $28 per kg
                                        $7,000 –
Cost of 75kWh module                                               $1,390                     $4,736                    $3,500                    $5,264
                                        11,250²,³
Grams of Pd                                0g                       8.1 g                     27.4 g                     10.5 g                   15.8 g
Cost of Pd                                 $0                       $590                      $2,000                      $766                    $1,150
% Cost of Pd                               0%                                    42.3%                                         21.8%
                                                                500 cycles                 500 cycles                500 cycles     500 cycles
Cycle life                            500+ cycles
                                                                 (target)                   (target)                  (target)       (target)
                                               1 https://evannex.com/blogs/news/tesla-s-battery-pack-is-both-mysterious-and-alluring-work-in-progress
                                               2 https://www.bloomberg.com/news/articles/2019-06-05/gm-plans-to-sell-electric-cars-to-joe-sixpack-and-make-
                                               money
                     Innovation with PGMs      3 https://interestingengineering.com/tesla-puts-price-on-model-3-battery-module-replacement-around-5000-7000     24
PLG:NYSE.A
PTM:TSX
Share Structure and Capital Markets
As of March 21, 2021
Stock Symbol PLG:NYSE.A PTM:TSX
Debt Major
Share Price USD $4.80 Shareholders
$15.2M USD
Secured Debt Hosken
52 week high/low USD $6.27 / $1.26 Consolidated
(Sprott Lending)
August 2021 + Investments Ltd.
Issued and Outstanding 74,036,413 Option to Extend (HCI:JSE),
One Year Franklin
Options 4,057,486 Templeton,
$20M USD 6 Liberty Metals
Restricted Share Units 575,763 7/8% Convertible
Senior Member of
Subordinated S&P/TSX
Fully Diluted 78,645,474 Notes, 2022 SmallCap Index
Market Capitalization USD $350M
Innovation with PGMs 25PLG:NYSE.A
PTM:TSX
Thank You
838 – 1100 Melville Street
604-899-5450
Vancouver, BC V6E 4A6
www.platinumgroupmetals.net info@platinumgroupmetals.netPLG:NYSE.A
PTM:TSX
Appendix
Waterberg Definitive Feasibility Study
September 2019PLG:NYSE.A
PTM:TSX
Resources
T-Zone and F-Zone Mineral Resource Estimate
2.5 g/t 4E Cut-Off
T Zone at 2.5 g/t (4E) Cut-off
Cut-off Grade Metal
Tonnage
Mineral Resource
4E Pt Pd Rh Au 4E Cu Ni 4E
Category
g/t t g/t g/t g/t g/t g/t % % kg Moz
Measured 2.5 4,443,483 1.17 2.12 0.05 0.87 4.20 0.150 0.080 18,663 0.600
Indicated 2.5 17,026,142 1.37 2.34 0.03 0.88 4.61 0.200 0.094 78,491 2.524
M+I 2.5 21,469 ,625 1.34 2.29 0.03 0.88 4.53 0.189 0.091 97,154 3.124
Inferred 2.5 21,829,698 1.15 1.92 0.03 0.76 3.86 0.198 0.098 84,263 2.709
F Zone at 2.5 g/t (4E) Cut-off
Cut-off Grade Metal
Mineral Resource Tonnage
4E Pt Pd Rh Au 4E Cu Ni 4E
Category
g/t t g/t g/t g/t g/t g/t % % kg Moz
Measured 2.5 54,072,600 0.95 2.20 0.05 0.16 3.36 0.087 0.202 181,704 5.842
Indicated 2.5 166,895,635 0.95 2.09 0.05 0.15 3.24 0.090 0.186 540,691 17.384
M+I 2.5 220,968,235 0.95 2.12 0.05 0.15 3.27 0.089 0.190 722,395 23.226
Inferred 2.5 44,836,851 0.87 1.92 0.05 0.14 2.98 0.064 0.169 133,705 4.299
28PLG:NYSE.A
PTM:TSX
Resources
Total Mineral Resource Estimate
2.5 g/t Cut-Off
Waterberg Aggregate Total 2.5 g/t Cut-off
Cut-off Grade Metal
Mineral Tonnage
Resource 4E Pt Pd Rh Au 4E Cu Ni 4E
Category
g/t t g/t g/t g/t g/t g/t % % kg Moz
Measured 2.5 58,516,083 0.97 2.19 0.05 0.21 3.42 0.092 0.193 200,367 6.442
Indicated 2.5 183,921,777 0.99 2.11 0.05 0.22 3.37 0.100 0.177 619,182 19.908
M+I 2.5 242,437,860 0.98 2.13 0.05 0.22 3.38 0.098 0.181 819,549 26.350
Inferred 2.5 66,666,549 0.96 1.92 0.04 0.34 3.27 0.108 0.146 217,968 7.008
29PLG:NYSE.A
PTM:TSX
Prill Splits
Prill Split Waterberg Project Aggregate
Pt Pd Rh Au
Mineral Resource Category
% % % %
Measured 28.2 64.4 1.5 5.9
Indicated 29.4 62.6 1.5 6.5
M+I 29.1 63.0 1.5 6.4
Inferred 29.5 58.9 1.2 10.4
NOTES:
1. 4E elements are platinum, palladium, rhodium and gold.
2. Cut-offs for Mineral Resources were established by a QP after a review of potential operating costs and other factors.
3. Conversion factor used for kilograms (“kg”) to ounces (“oz”) is 32.15076
4. A 5% and 7% geological loss was applied to the Measured/Indicated and Inferred Mineral Resources categories, respectively.
5. The Mineral Resources are classified in accordance with the National Instrument for the Standards of Disclosure for Mineral projects within Canada, 2011 (“NI 43-101”). Mineral
Resources that are not Mineral Reserves do not have demonstrated economic viability and Inferred Mineral Resources have a high degree of uncertainty.
6. The Mineral Resources are provided on a 100% Project basis, Inferred and Indicated categories are separate and the estimates have an effective date of 4 September 2019.
7. Mineral Resources were completed by Mr. CJ Muller of CJM Consulting.
8. Mineral Resources were estimated using kriging methods for geological domains created in Datamine from 441 mother holes and 583 deflections. A process of geological modelling and
creation of grade shells using indicating kriging was completed in the estimation process.
9. The Mineral Resources may be materially affected by metal prices, exchange rates, labour costs, electricity supply issues or many other factors detailed in the Company's 2018 Annual
Information Form.
10. The data that formed the basis of the Mineral Resources estimate are the drill holes drilled by Platinum Group as project operator, which consist of geological logs, drill hole collars
surveys, downhole surveys and assay data. The area where each layer was present was delineated after examination of the intersections in the various drill holes.
11. Numbers may not add due to rounding.
30PLG:NYSE.A
PTM:TSX
Reserves
Proven Mineral Reserve Estimate
2.5 g/t 4E Cut-Off
Proven Mineral Reserve Estimate at 2.5 g/t 4E cut-off
Pt Pd Rh Au 4E Cu Ni 4E Metal
Zone Tonnes (g/t) (g/t) (g/t) (g/t) (g/t) (%) (%) Kg Moz
T Zone 3,963,694 1.02 1.84 0.04 0.73 3.63 0.13 0.07 14,404 0.463
F Central 17,411,606 0.94 2.18 0.05 0.14 3.31 0.07 0.18 57,738 1.856
F South - - - - - - - - - -
F North 16,637,670 0.85 2.03 0.05 0.16 3.09 0.10 0.20 51,378 1.652
F Boundary North 4,975,853 0.97 2.00 0.05 0.16 3.18 0.10 0.22 15,847 0.509
F Boundary South 5,294,116 1.04 2.32 0.05 0.18 3.59 0.08 0.19 19,020 0.611
F Zone Total 44,319,244 0.92 2.12 0.05 0.16 3.25 0.09 0.20 143,982 4.629
Waterberg Total 48,282,938 0.93 2.10 0.05 0.20 3.28 0.09 0.19 158,387 5.092
NOTES:
1. The estimated Mineral Reserves have an effective date of 04 September 2019.
2. A 2.5 g/t 4E stope cut-off grade was used for mine planning for the T Zone and the F Zone Mineral Reserves estimate. The cut-off grade considered April 2018 metal spot
prices.
3. Tonnes and grade estimates include planned dilution, geological losses, external overbreak dilution, and mining losses.
4. 4E elements are platinum, palladium, rhodium and gold.
5. Numbers may not add due to rounding.
6. Based on 100% Project Basis
31PLG:NYSE.A
PTM:TSX
Reserves
Probable Mineral Reserve Estimate
2.5 g/t 4E Cut-Off
Probable Mineral Reserve Estimate at 2.5 g/t 4E cut-off
Pt Pd Rh Au 4E Cu Ni 4E Metal
Zone Tonnes (g/t) (g/t) (g/t) (g/t) (g/t) (%) (%) Kg Moz
T Zone 12 936 870 1.23 2.10 0.02 0.82 4.17 0.19 0.09 53,987 1.736
F Central 52 719 731 0.86 1.97 0.05 0.14 3.02 0.07 0.18 158,611 5.099
F South 15 653 961 1.06 2.03 0.05 0.15 3.29 0.04 0.13 51,411 1.653
F North 36 984 230 0.90 2.12 0.05 0.16 3.23 0.09 0.20 119,450 3.840
F Boundary North 13 312 581 0.98 1.91 0.05 0.17 3.11 0.10 0.23 41,369 1.330
F Boundary South 7 616 744 0.92 1.89 0.04 0.13 2.98 0.06 0.18 22,737 0.731
F Zone Total 126 287 248 0.91 2.01 0.05 0.15 3.12 0.08 0.18 393,578 12.654
Waterberg Total 139 224 118 0.94 2.02 0.05 0.21 3.22 0.09 0.18 447,564 14.390
NOTES:
1. The estimated Mineral Reserves have an effective date of 04 September 2019.
2. A 2.5 g/t 4E stope cut-off grade was used for mine planning for the T Zone and the F Zone Mineral Reserves estimate. The cut-off grade considered April 2018 metal spot
prices.
3. Tonnes and grade estimates include planned dilution, geological losses, external overbreak dilution, and mining losses.
4. 4E elements are platinum, palladium, rhodium and gold.
5. Numbers may not add due to rounding.
6. Based on 100% Project Basis.
32PLG:NYSE.A
PTM:TSX
Reserves
Proven & Probable Mineral Reserve
Estimate at 2.5 g/t 4E cut-off
Total Estimated Mineral Reserve at 2.5 g/t 4E cut-off
Pt Pd Rh Au 4E Cu Ni 4E Metal
Zone Tonnes (g/t) (g/t) (g/t) (g/t) (g/t) (%) (%) Kg Moz
T Zone 16 900 564 1.18 2.04 0.03 0.80 4.05 0.18 0.09 68,391 2.199
F Central 70 131 337 0.88 2.02 0.05 0.14 3.09 0.07 0.18 216,349 6.956
F South 15 653 961 1.06 2.03 0.05 0.15 3.29 0.04 0.13 51,411 1.653
F North 53 621 900 0.88 2.09 0.05 0.16 3.18 0.10 0.20 170,828 5.492
F Boundary North 18 288 434 0.98 1.93 0.05 0.17 3.13 0.10 0.23 57,216 1.840
F Boundary South 12 910 859 0.97 2.06 0.05 0.15 3.23 0.07 0.19 41,756 1.342
F Zone Total 170 606 492 0.91 2.04 0.05 0.15 3.15 0.08 0.19 537,560 17.283
Waterberg Total 187 507 056 0.94 2.04 0.05 0.21 3.24 0.09 0.18 605,951 19.482
NOTES:
1. The estimated Mineral Reserves have an effective date of September 4, 2019.
2. A 2.5 g/t 4E stope cut-off grade was used for mine planning for the T Zone and the F Zone Mineral Reserves estimate. The cut-off grade considered April 2018 metal spot
prices.
3. Tonnes and grade estimates include planned dilution, geological losses, external overbreak dilution, and mining losses.
4. 4E elements are platinum, palladium, rhodium and gold.
5. Numbers may not add due to rounding.
33PLG:NYSE.A
PTM:TSX
Project Capital Breakdown
ZAR Total USD Total
Cost Area
(ZAR million Real) (US$ million Real)
Underground Mining 6,097 406
Concentrator 2,580 172
Shared Services and Infrastructure 682 45
Regional Infrastructure 1,229 82
Site Support Services 234 16
Project Delivery Management 654 44
Other Capitalised Costs 331 22
Provisions 1,298 87
Total Project Capital (excl. Capitalised OpEx) 13,105 874
Capitalised Operating Costs 3,453 230
Total Project Capital (incl. Capitalised OpEx) 16,559 1,104
Peak Funding (Spot Prices) 9,255 617
NOTES:
1. Project Capital is defined as all required capital expenditure until the Project achieves 70% of planned steady-state production. This is projected to occur from January
2020 to December 2025.
2. A US$/ZAR exchange rate of 15.00 is used in all cost conversions.
3. Post December 2025, the DFS estimates stay-in-business or sustaining capital for the LOM at US$ 1.44 billion (ZAR 21.6 billion).
4. The DFS estimates peak funding at US$ 617 million (ZAR 9.26 billion) at Spot Prices, and US$ 667 million (ZAR 10.26 billion) at Three Year Trailing Prices. This
includes all spend offset by revenue.
34PLG:NYSE.A
PTM:TSX
Price Deck Assumptions
Spot Prices Three Year Trailing Prices
Parameter Unit
(Sept 4, 2019) (Sept 4, 2019)
US$ / ZAR (Long-term Real) US$/ZAR (Real July 2019) 15.00 15.95
Platinum US$/oz (Real July 2019) 980 931
Palladium US$/oz (Real July 2019) 1,546 1,055
Gold US$/oz (Real July 2019) 1,548 1,318
Rhodium US$/oz (Real July 2019) 5,036 1,930
Basket Price (4E) US$/oz (Real July 2019) 1,425 1,045
Copper US$/lb (Real July 2019) 2.56 2.87
Nickel US$/lb (Real July 2019) 8.10 5.56
Smelter Payability: 4E Metal % Gross Sale Value 85% 85%
Smelter Payability: Copper % Gross Sale Value 73% 73%
Smelter Payability: Nickel % Gross Sale Value 68% 68%
35PLG:NYSE.A
PTM:TSX
Operating Costs
On-Site Operating Cost Rates per Area in ZAR and USD
Area Average LOM (ZAR/t milled) Average LOM (US$/t milled)
Mining 345 23.01
Milling & Processing 132 8.79
Engineering & Infrastructure 116 7.76
General & Admin 19 1.25
Total OPEX Cost 612 40.80
36PLG:NYSE.A
PTM:TSX
Operating Costs
Total Cash Cost Rates in USD/4E Ounce
Spot Prices 3-Year Trailing Average Prices
Cost Area
(US$/4E oz Real) (US$/4E oz Real)
On-Site Costs 487 457
Smelting, Refining and Transport Costs 302 457
Royalties & Production Taxes 88 54
Less By-Product Credits (236) (184)
Total Project Operating Costs 640 554
37PLG:NYSE.A
PTM:TSX
Sensitivity Analysis
NPV - Discount Rate
Metric Discount Rate Unit of Measure Spot Prices Three Year Trailing Prices
Undiscounted US$ million 6,613 3,489
4% US$ million 2,390 1,106
Net Present Value 6% US$ million 1,516 623
US$ (Post-Tax) 8% US$ million 982 333
10% US$ million 641 152
12% US$ million 415 35
Undiscounted ZAR million 99,201 56,021
4% ZAR million 35,857 17,979
Net Present Value 6% ZAR million 22,747 10,259
ZAR (Post-Tax) 8% ZAR million 14,736 5,616
10% ZAR million 9,618 2,710
12% ZAR million 6,220 829
38PLG:NYSE.A
PTM:TSX
Sensitivity Analysis
Scenario 1 (Spot Prices)
Payback
Increase/ NPV @ 8% NPV @ 8% IRR
Parameters Period(1)
(Decrease) (US$ million) (ZAR million) (% Real)
(years)
(20%) 408 6,122 13.7 11.0
(10%) 695 10,423 17.3 9.4
Metal Prices - 982 14,736 20.7 8.4
10% 1,272 19,079 23.9 7.8
20% 1,564 23,458 27.0 7.4
(20%) 437 6,550 14.1 10.8
(10%) 709 10,630 17.5 9.3
4E Head Grade - 982 14,736 20.7 8.4
10% 1,257 18,857 23.7 7.8
20% 1,533 22,991 26.6 7.5
(20%) 1,141 17,114 26.4 7.4
(10%) 1,062 15,925 23.3 7.8
Project CapEx - 982 14,736 20.7 8.4
10% 903 13,547 18.6 9.0
20% 824 12,358 16.9 9.7
(20%) 1,273 19,098 23.3 7.9
(10%) 1,128 16,917 22.1 8.1
OpEx - 982 14,736 20.7 8.4
10% 837 12,555 19.3 8.7
20% 692 10,374 17.8 9.1
NOTE: ¹From the date of first construction.
39You can also read