Why trees grow at night - Research - DORA 4RI
←
→
Page content transcription
If your browser does not render page correctly, please read the page content below
Research

Why trees grow at night
Roman Zweifel1 , Frank Sterck2 , Sabine Braun3 , Nina Buchmann4 , Werner Eugster4 , Arthur
Gessler1 , Matthias H€a ni1 , Richard L. Peters1,5 , Lorenz Walthert1 , Micah Wilhelm1 , Kasia
Zieminska1,6 and Sophia Etzold1
1
Swiss Federal Institute for Forest, Snow and Landscape Research WSL, Birmensdorf 8903, Switzerland; 2Forest Ecology and Management Group, Wageningen University, Wageningen 6708
PB, the Netherlands; 3Institute for Applied Plant Biology, Witterswil 4108, Switzerland; 4Department of Environmental Systems Science, Institute of Agricultural Sciences, ETH Zurich,
Zurich 8092, Switzerland; 5Laboratory of Plant Ecology, Ghent University, Ghent 9000, Belgium; 6Department of Plant Ecology and Evolution, Uppsala University, Uppsala SE-751 05,
Sweden

                                                            Summary
Author for correspondence:                                   The timing of diel stem growth of mature forest trees is still largely unknown, as empirical
Roman Zweifel                                               data with high temporal resolution have not been available so far. Consequently, the effects
Email: roman.zweifel@wsl.ch
                                                            of day–night conditions on tree growth remained uncertain.
                                                             Here we present the first comprehensive field study of hourly-resolved radial stem growth
Received: 18 March 2021                                     of seven temperate tree species, based on 57 million underlying data points over a period of
Accepted: 7 June 2021
                                                            up to 8 yr.
                                                             We show that trees grow mainly at night, with a peak after midnight, when the vapour
New Phytologist (2021) 231: 2174–2185                       pressure deficit (VPD) is among the lowest. A high VPD strictly limits radial stem growth and
doi: 10.1111/nph.17552                                      allows little growth during daylight hours, except in the early morning. Surprisingly, trees also
                                                            grow in moderately dry soil when the VPD is low. Species-specific differences in diel growth
Key words: cell turgor threshold, climate                   dynamics show that species able to grow earlier during the night are associated with the high-
change, day–night radial stem growth,                       est number of hours with growth per year and the largest annual growth increment.
dendrometer, ecophysiology, photoperiod,                     We conclude that species with the ability to overcome daily water deficits faster have
wood and bark formation, xylogenesis.                       greater growth potential. Furthermore, we conclude that growth is more sensitive than car-
                                                            bon uptake to dry air, as growth stops before stomata are known to close.

                                                                                                  for several tree species (Lazzarin et al., 2019; Cabon et al., 2020;
Introduction
                                                                                                  Peters et al., 2021). These water potentials vary strongly with the
Species-specific responses of tree growth to environmental condi-                                 time of day and climate change effects may therefore greatly dif-
tions are crucial for understanding forest dynamics in a world                                    fer between day and night.
with a rapidly changing climate (Babst et al., 2019; Bastos et al.,                                  Despite the current lack of hourly-resolved growth data, the
2020; McDowell et al., 2020). However, knowledge about the                                        theoretical background to explain the mechanisms of cell division
physiological and environmental drivers of tree growth is still                                   and cell expansion in a tree stem is well established (Woodruff &
limited by the temporal resolution of dendrochronological meth-                                   Meinzer, 2011). At the core of the proposed mechanism is the
ods. Such data are often coarse and are obtained typically with an                                soil–plant–atmosphere continuum including the cohesion-
annual resolution of the underlying tree ring samples (Schwein-                                   tension theory (Dixon & Joly, 1894), which connects soil water
gruber, 1996; Babst et al., 2018) or, in less frequent cases, small                               dynamics with tree hydraulics and atmospheric water demand
wood samples obtained at (bi-)weekly intervals (Zweifel et al.,                                   and determines the water potential in the cambium where the
2006; Delpierre et al., 2016; Huang et al., 2020; Peters et al.,                                  new wood and bark cells are formed (Woodruff & Meinzer,
2021). Daily or even hourly-resolved growth responses of mature                                   2011). Vapour pressure deficit (VPD) and soil water potential
forest trees have been rarely recorded (Schurr et al., 2006), most                                (SWP) become the key drivers of the water potential gradient
data covers only short periods and were monitored in single                                       that determines the water flow through the tree (Steppe et al.,
stands (Ziaco & Biondi, 2018; Kn€    usel et al., 2019; G€
                                                         uney et al.,                             2006; Novick et al., 2016; Carminati & Javaux, 2020). These
2020).                                                                                            two variables reflect the water potentials in the air and soil as well
   However, there is an urgent need for growth information with                                   as integrate over other environmental variables, for example, tem-
sub-daily resolution, since the average conditions over a week or                                 perature and relative humidity.
a year might affect growth differently than within a specific hour.                                  The essentials about the physiological relationship between
Growth is not a continuous, linear process but is strongly deter-                                 tree water relations and growth dates back to the 1960s, when
mined by thresholds of plant water potentials as has been shown                                   Lockhart (1965) described how a turgor threshold of the
2174      New Phytologist (2021) 231: 2174–2185                                                                                                                          Ó 2021 The Authors
         www.newphytologist.com                                                                                                             New Phytologist Ó 2021 New Phytologist Foundation
                                                                                This is an open access article under the terms of the Creative Commons Attribution License, which permits use,
                                                                                                    distribution and reproduction in any medium, provided the original work is properly cited.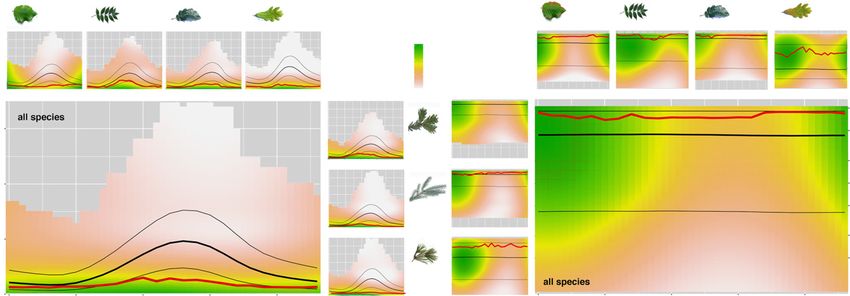
New
Phytologist                                                                                                                              Research 2175

meristem must be crossed before cell expansion and cell division            radius and air and soil conditions (Fig. 1). The key hypotheses of
is promoted. Many later studies supported this theory (Steppe               this study address the sensitivity of growth to VPD and SWP as
et al., 2006; Muller et al., 2011; Lazzarin et al., 2019; Cabon             well as the dependence of stem growth on the time of day:
et al., 2020; Peters et al., 2021). Lockhart’s theory implicitly con-       (1) We expect diel stem growth to increase overnight and
siders growth not only as a function of the carbon source but also          decrease during the day because transpiration reduces water
of the water conditions since varying environmental conditions              potential and turgor pressure in the cambium, thus inhibiting cell
may independently determine carbon uptake and turgor pressure               division and cell expansion.
(Fatichi et al., 2014).                                                     (2) We expect stem growth to be favoured under humid condi-
    The turgor threshold theory also enabled the development of a           tions and thus improved under conditions of low VPD and high
method to extract hourly stem radial growth data from continu-              SWP. Furthermore, we expect that stem growth always responds
ous, high-precision dendrometer measurements (Fig. 1; Support-              similarly to environmental conditions, regardless of the time of
ing Information Fig. S1). Dendrometer data consist of radial                day.
increment due to growth and tree water related shrinkage and                (3) We expect stem growth to be species-specific as species are
expansion of mainly the bark, which need to be separated prior              known to have different sensitivities to VPD and SWP (e.g.
to analysing stem growth. A recent study (Zweifel et al., 2016)             stomatal regulation) and other factors (e.g. circadian rhythm).
presented a separation method (zero-growth approach) based on
empirical and theoretical evidence that radial stem growth is sup-
                                                                            Materials and Methods
pressed when tree stems are shrinking due to the transpiration-
induced lowering of the turgor pressure. In short, growth is
                                                                            Sites and setup
equivalent to an incremental increase in stem radius when the
measured radius is larger than it was at any point in the past. The         The 50 sites studied are part of TreeNet (www.treenet.info), a
authors estimated that > 95% of the growth could be attributed              network where stem radius changes of trees are measured contin-
to the correct hour, making for a very robust and credible, but             uously using high-precision point dendrometers, in parallel with
not perfect, separation approach.                                           environmental information of air (VPD) and soil (SWP) in Swiss
    There remain uncertainties with potential hygroscopic effects           forests since 2011 (Fig. 1). Most forests were managed sustain-
of the bark of some tree species when the stem surface is moist-            ably since 1876 and are either deciduous, evergreen or mixed.
ened by rain (Oberhuber et al., 2020). Further, the zero-growth                Four angiosperms (Fagus sylvatica, Fraxinus excelsior, Quercus
approach does not consider the still largely unknown bark degra-            pubescens, Quercus petrea) and three gymnosperms (Picea abies,
dation processes (Gricar et al., 2015; G€     uney et al., 2020), espe-     Pinus sylvestris, Abies alba) were analysed between 2011 and 2018
cially after frost in the winter period (Zweifel & H€asler, 2000;           (Fig. 1). All of them fulfilled the minimum criteria of appearing
Charrier et al., 2017). Uncertainties also remain due to technical          at > 3 sites with > 2 yr of data per time series and a minimum of
issues, for example, the electronic and mechanical temperature              two individuals per site. Further, only vital, mature and domi-
behaviour of dendrometers, the way the sensor is anchored in the            nant trees that grew more than 100 µm yr 1 were included. The
tree, or the way the raw data is cleaned from outliers and shifts           total number of trees per species ranged from 7 to 62. All analyses
(Haeni et al., 2020). As there is so far no alternative method              were based on hourly-resolved data. Further characteristics of
capable of measuring radial stem growth with a similarly high res-          species and sites are listed in Supporting Information Table S1.
olution on mature forest trees, the zero-growth approach lacks an
ultimate quality control. The application of another recently
                                                                            Environmental conditions
developed empirical approach to separate growth from dendrom-
eter data (Mencuccini et al., 2017) did not offer an alternative, as        Air temperature (TEMP) and relative humidity (RelH) was
the remaining uncertainties are the same and the approach addi-             obtained either from weather stations located at the sites (sources:
tionally needs sap flow data not available in this infrastructure.          treenet.info and lwf.ch) or from nearby (mean distance: 8.3 km,
    Meanwhile, the zero-growth approach has become widely accepted          maximum: 15.4 km) MeteoSwiss stations (meteoswiss.ad-
and applied (Dietrich & Kahmen, 2019; Schafer et al., 2019; Eitel           min.ch). VPD was calculated from TEMP and RelH.
et al., 2020; G€ uney et al., 2020; Lamacque et al., 2020; Pappas et al.,      SWP (MPS-2/MPS-6; Decagon Devices, Pullman, WA, USA)
2020; Sellier & Segura, 2020). Accordingly, growth is defined as the        was measured at 10–20 cm soil depth at each of the 50 sites
radial stem increase above a previously reached stem radial maximum         (treenet.info) and corrected for soil temperature (Walthert &
(Fig. S1). All stem size changes below this dynamicallyincreasing max-      Schleppi, 2018). These topsoil water potentials (SWP values)
imum were attributed to the water conditions of the trees and removed       were cross-checked with SWP measurements over 2 m profiles at
from the growth data. Growth is understood as irreversible stem radial      five sites (Fig. S2).
increment, including new bark and wood cells and neglecting any cell
maturation processes (e.g. lignification) (Cuny et al., 2015; Rathgeber
                                                                            Dendrometer measurements
et al.,2016).
    Here, we present the first comprehensive study of hourly-               Point dendrometers (ZN11-T-IP and ZN11-T-WP, Natkon,
resolved stem growth data from a large, technically homogenous              Oetwil am See, Switzerland, Fig. 1) were mounted on the stem at
network of 170 trees at 50 sites, continuously measuring stem               breast height. The dendrometers consisted of a carbon-fibre

Ó 2021 The Authors                                                                                            New Phytologist (2021) 231: 2174–2185
New Phytologist Ó 2021 New Phytologist Foundation                                                                       www.newphytologist.com
New
2176 Research                                                                                                                                    Phytologist

     Fig. 1 Location and characteristics of the 50 TreeNet sites in Switzerland (www.treenet.info). Seven tree species including data of 170 individually
     measured trees (Supporting Information Table S1) were investigated with a total of 57 million underlying data points at a 10-min resolution (species-
     specific sums, panel top right) that were aggregated to hourly averages for analyses. The background colour of the map indicates the average annual
     precipitation. The site dots are colour-coded according to the mean annual temperature shown in the boxplot panel (lower left). The boxplots indicate the
     median (horizontal bar) mean annual temperature, with the boxes representing the 25–75% quartile range and the whiskers the lowest and highest value
     within 1.59 the interquartile (IQR, 75–25%) range. Circles define outliers beyond the 1.59IQR. Mean annual temperature and precipitation cover a large
     gradient from 4.5 to 11.9°C and from 540 to 1700 mm, respectively. The photograph shows a point dendrometer mounted on a beech tree and the panel
     below gives the corresponding growth performance over 8 yr, highlighting the years with the lowest and the largest stem radial growth.

     frame with three stainless steel threaded rods which served as                 Switzerland) at 10 min intervals or better. The logging resolution
     anchors in the (heart) wood of the tree stem. A metal sensing pin              was < 1 µm and the temperature sensitivity of the applied den-
     was gently pressed against the surface of the bark by a spring. The            drometers (including all components and logger) was < 0.3 µm
     electronic transducer detected changes in the position of the pin              °C 1 and was thus negligible.
     and thus stem radius changes measured over the bark. The outer-
     most dead layer of bark under the pin was carefully removed to
                                                                                    Stem radius fluctuations and growth calculations
     minimize the effect of hygroscopic swelling. Special care was
     taken to avoid damaging the living bark underneath.                            Dendrometer data combine two major processes of the tree stem
        The dendrometer data were recorded and transmitted with                     physiology: irreversible growth and reversible swelling and
     DecentLab logging devices (DecentLab GmbH, D€             ubendorf,            shrinkage (Fig. S1). Here we use the so called ‘zero growth’

     New Phytologist (2021) 231: 2174–2185                                                                                                 Ó 2021 The Authors
     www.newphytologist.com                                                                                   New Phytologist Ó 2021 New Phytologist Foundation
New
Phytologist                                                                                                                         Research 2177

concept for stem radius partitioning into periods with and with-       regression (loess) function that interpolates growth in relation to
out growth, which assumes no growth during periods of stem             time of day and environmental conditions. This interpolation
shrinkage and is explained in detail elsewhere (Zweifel et al.,        model covered on average 70% of the underlying data variation
2016). Following this concept, the accumulative growth (GRO)           of individual species. Uncertainty analyses were performed using
increases in periods when the stem radius exceeds its previous         a bootstrapping procedure in which a selection of data was ran-
maximum (GRO > 0). During the remaining time, stems either             domly resampled 1000 times and the coefficient of variation was
shrink or expand below this maximum and the deviation to the           calculated over these data.
maximum is called tree water deficit (TWD > 0), or the stem
radius exactly meets its previous maximum (TWD = 0,
                                                                       Results
GRO = 0).
                                                                       Stem growth at night
Stem growth period and growth hours
                                                                       Over a diel cycle, all tree species grew mainly at night, with the
The stem growth period was defined as the period of the year           highest contribution to total stem growth just before dawn and
when radial increments were detected and was determined sepa-          the lowest contribution to growth during midday and in the
rately for each site and species (based on the average of all trees    afternoon (Fig. 2a), which supported hypothesis (1). The proba-
per species and site). The first and last 5% of the stem growth        bility for growth (Fig. 2b), quantified as number of hours with
period were excluded to avoid outliers influencing the timing of       growth relative to the total number of hours in the stem growth
the growth periods. Hours with growth were flagged as ‘growth          period, largely explained the diel growth pattern (72% in a mul-
hours’, summed up for each individual tree and year (‘growth           tiple regression model), while hourly growth rates (Fig. 2c)
hours per year’), and further aggregated to species-specific           remained relatively stable over the diel cycle and explained much
median growth hours per year.                                          less (26%). In addition to the general pattern for all species, the
                                                                       hourly contribution to annual growth (Fig. 2d), growth probabil-
                                                                       ity (Fig. 2e) and growth rate (Fig. 2f) showed species-specific fea-
Data treatment and statistical methods
                                                                       tures, for example, the timing of maximum and minimum stem
All analyses and plots were made with R statistical software           growth as listed in Table 1. For simplicity, from here on we use
(R_Core_Team, 2019). The raw dendrometer data of each tree             the term ‘stem growth’ to refer to the hourly, relative contribu-
(10-min resolution) over the full length of the time series were       tion of growth to annual growth (Fig. 2a,d) and ‘growth rate’ for
quality checked and processed with the R-package TREENETPROC           the stem growth rate per hour (Fig. 2c,f).
(Haeni et al., 2020). For analyses or calculations that were based
on annual values we included annual time series that covered
                                                                       Stem growth in relation to dryness in air and soil
> 90% of the stem growth period only.
   Statistical analyses of diel, hourly resolved data were based on    In general, main growth was limited to a VPD < 0.4 kPa and a
aggregated data considering the nested data structure. The aggre-      SWP > 900 kPa corresponding to the greenish area in Fig. 3(a),
gation process underwent three steps. First, the daily growth pat-     covering more than 75% of total growth. The result was found to
tern for each tree individual was calculated as the relative           be robust in terms of a low uncertainty for growth within the rel-
contribution of a given hour to the total annual growth (in per-       evant VPD and SWP ranges (Fig. 3b). The species-specific VPD
centage; the 24 h of a day equal to 100%) in order to normalize        thresholds for main growth ranged within a narrow band of val-
the highly varying absolute annual growth between individual           ues for all species, whereas the SWP threshold considerably varied
trees and to aggregate the data over several years. Second, these      across species (Fig. S3). Quercus pubescens grew at the lowest
relative growth numbers were averaged per site and species. And        SWP by far, whereas Abies alba covered moist soil conditions
thirdly, the data were pooled into (1) a growth response of all        only (Table S2). Further, the available SWP for all sites (mea-
species and (2) aggregated into a species-specific response pattern.   sured at 10–20 cm soil depth) largely represented the temporal
The VPD and SWP data were treated in the same way. All steps           dynamics of five available soil profiles of 2 m depth. However,
included medians with 25% and 75% quantiles. Based on these            the lower boundary for main growth was shifted by about 200–
aggregated data sets, growth probability (%) was quantified as the     300 kPa upwards between the data used in this study (Fig. 3) and
number of hours with growth relative to the total number of            the data from the 2 m soil profile (Fig. S2). The median SWP
hours in the stem growth phase. Hourly growth rates in absolute        were hardly differing (Table S2).
units (µm h 1) were calculated accordingly, but not normalized            VPD and SWP together explained on average 81% of the diel
for variations in annual increments.                                   growth variation of all species in a multiple regression model
   Multiple linear regression models were applied to test the rela-    (Table S3). A model that included all available environmental
tionships between VPD and SWP and the daily growth cycle at            variables (relative humidity, air temperature, net radiation, SWP
hourly resolution of these aggregated data sets. Contour diagrams      and the respective pairwise interactions) explained only slightly
of hourly growth in relation to VPD and SWP were made with             more, namely 88% (Table S4).
the R-packages GRIDEXTRA (Auguie & Antonov, 2017) and RE-                 The explanatory power of SWP for diel growth varied consid-
SHAPE2 (Wickham, 2020), and are based on a local polynomial            erably among species (Table S3) between 0% (Quercus petraea)

Ó 2021 The Authors                                                                                       New Phytologist (2021) 231: 2174–2185
New Phytologist Ó 2021 New Phytologist Foundation                                                                  www.newphytologist.com
New
2178 Research                                                                                                                                    Phytologist

     Fig. 2 Diel growth of seven temperate tree species. Boxplots show median, 25 and 75 percentiles and the SD of the pooled data for all species (a–c). Lines
     show the medians of each species (d–f). The relative contribution of a specific hour to the annual growth is shown in (a, d). The probability for growth
     quantified as number of hours with growth relative to the total number of hours in the stem growth period is shown in (b, e) and the median hourly growth
     rates of hours with growth are shown in (c, f).

     Table 1 Species-specific features of diel growth in relation to annual growth.

                                  GRO.hr              Time.GRO.max              Time.GRO.min            R2VPD               h.GRO.yr               GRO.yr
                                  (µm h 1)            (time of day)             (time of day)           (adj R2)            (h)                    (µm)

     Abies alba                   1.64                2                         16                      0.60                746                    1817
     Fagus sylvatica              0.94                1                         13                      0.81                606                    1159
     Fraxinus excelsior           2.02                2                         17                      0.72                572                    1439
     Picea abies                  2.50                4                         15                      0.65                468                    1507
     Pinus sylvestris             2.29                6                         15                      0.50                301                     795
     Quercus petrea               1.14                4                         14                      0.94                540                    1044
     Quercus                      1.69                6                         14                      0.68                280                     656
      pubescens

     Listed are the median hourly growth rates calculated for hours with growth (GRO.hr), time of day when the diel contribution to annual growth was at its
     maximum (Time.GRO.max) and at its minimum (Time.GRO.min). Adjusted R2 (R2VPD) are listed for the linear regression of the two time series. h.GRO.yr
     represents the median total number of hours with growth per year, while GRO.yr represents the median radial increment per year.

     and 27% (Abies alba), and was significantly higher for the
                                                                                      Diel dynamics of stem growth in relation to vapour
     conifers (20%) than for the deciduous species (5%). Growth
                                                                                      pressure deficit and soil water potential
     decreased for a given VPD with decreasing SWP in some species
     (Picea abies, Abies alba, Quercus petraea), while interestingly it               The general relationship between the diel growth and the envi-
     increased in other species up to a certain SWP ( 30 to                           ronmental variables VPD and SWP appeared robust across all
       150 kPa) and only decreased thereafter (Fig. S3). Or in other                  species (main panels, Fig. 4), resembled the patterns for individ-
     words, not all species had the greatest growth under the wettest                 ual species (small panels, Fig. 4), and was largely independent of
     soil conditions (measured in 10–20 cm).                                          the time of the season (Fig. S5). Diel growth responded more

     New Phytologist (2021) 231: 2174–2185                                                                                                  Ó 2021 The Authors
     www.newphytologist.com                                                                                    New Phytologist Ó 2021 New Phytologist Foundation
New
Phytologist Research 2179
Fig. 3 Hourly-resolved, radial stem growth and the corresponding uncertainty analysis in the measured space of vapour pressure deficit (VPD) and soil
water potential (SWP) across all species. (a) Growth was quantified as the relative hourly contribution to the total annual growth (per grid element) and
ranged from white (no growth, 0%), over red (marginal growth, 0.02%) to dark green (high growth, 0.06%). (b) The coefficient of variation (CoV) of the
uncertainty analysis indicated the robustness of the results between very good (values < 10, dark blue), good (10 to < 20), and satisfactory (20–50), to
poor (> 50, light blue to white). The interpolation output of the contour diagram was restricted to the effectively measured range of environmental
variables. Grey areas indicate no data. Species-specific growth responses can be found in the Supporting Information Fig. S3.
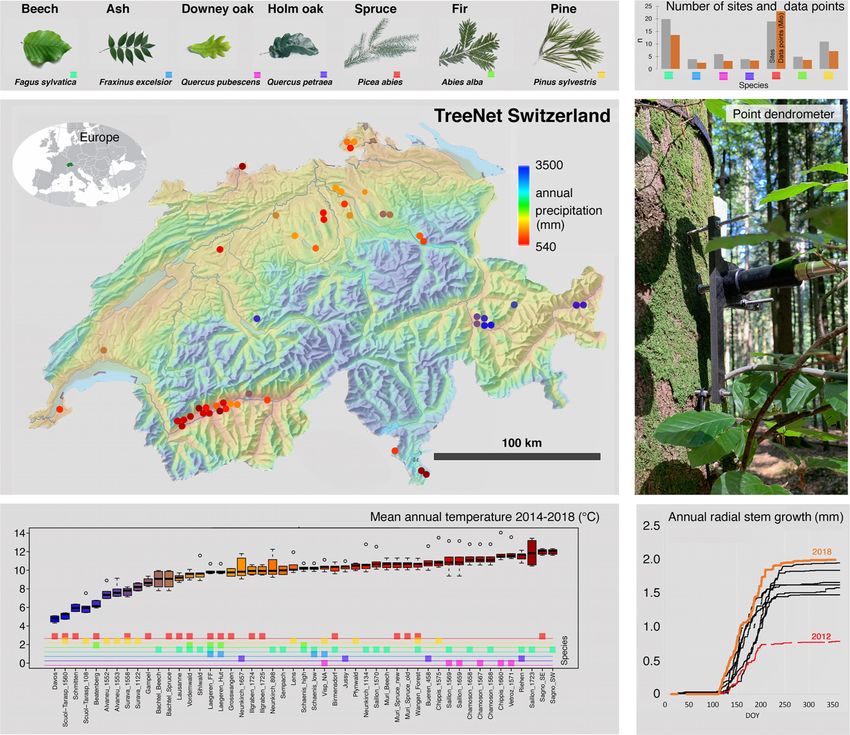
Fig. 4 Diel radial stem growth in relation to (a) vapour pressure deficit (VPD) and (b) soil water potential (SWP). Growth is colour-coded and ranges from
white (no growth, 0%), through red (little growth, 0.02%) to dark green (high growth, 0.06%). The main panel shows the general response over all
species whereas the small panels show the species-specific responses (same axis). The bold black line indicates the median VPD and SWP conditions in the
stem growth period (thin black lines indicate 25%- and 75%-quantiles). By contrast, the bold red line shows the same but for hours with growth only. A
plot with the underlying measurement data can be found in Supporting Information Fig. S4. Growth is quantified as the relative growth contribution to the
total annual growth and is based on aggregated data sets considering the nested design of trees and species within sites. The interpolation output of the
contour diagram was restricted to the effectively measured range of VPD and SWP. Grey areas indicate no data.
consistently to VPD, while the growth response to SWP was generally drier than required for growth, allowing only a limited
strongly depending on the time of day. A particular SWP resulted number of hours with growth throughout the entire stem growth
in higher or lower growth depending on the actual time of day, period. Quercus pubescens and Pinus sylvestris had the fewest hours
with nocturnal conditions allowing growth over a much larger with growth (c. 300), while Fagus sylvatica and Abies alba had
SWP range compared to daylight hours. more than double (Table 1).
In all species, the median VPD for hours with growth (bold
red lines, Fig. 4) was consistently lower than the median VPD of
Timing of peak growth as indicator for annual growth
all hours in the entire growth period (bold black line, Fig. 4).
Especially during daylight hours, the difference between the two Despite the robust 24-h growth pattern across all species and
lines increased, while the same deviation for SWP was less depen- sites, there were clear species-specific differences where the
dent on the time of day. However, both the soil and the air were growth of some species peaked earlier at night than of others
Ó 2021 The Authors New Phytologist (2021) 231: 2174–2185
New Phytologist Ó 2021 New Phytologist Foundation www.newphytologist.comNew
2180 Research Phytologist
Fig. 5 Time of day of maximum growth in relation to (a) the number of hours with growth and (b) the radial stem increment per year. Shown are the
medians (circles) and the range between the 25%- and 75%-quantiles (lines) of each species (colour-coded). Dashed lines show the linear regression. **,
P < 0.01; □, P < 0.1.
(Fig. 2d; Table 1). Fagus sylvatica started to increase (13:00 h) with the observation that it takes several hours after nightfall for
and reached the peak (01:00 h) of its median diel growth earlier stems to replenish and to compensate for the tree water deficit
than all other species, which had growth peaks between 02:00 h caused by the imbalance between transpiration and water uptake
and 06:00 h in the early morning and growth minima during during daylight hours. It is this water deficit, which must be com-
midday and early afternoon, between 14:00 h and 16:00 h pensated for before growth processes are proposed to become
(Table 1). Of all species, Pinus sylvestris showed the most pro- likely (Zweifel et al., 2016). Stem growth also occurred during
nounced growth peak (highest amplitude, Fig. 2d), followed by daylight hours (Fig. 2), but with a consistently lower relative con-
Picea abies and Quercus pubescens, indicating that growth was tribution to annual growth. Overall, these results are consistent
more restricted to these specific hours. By contrast, Quercus with our hypotheses, which emphasize the importance of tree
petraea and especially Fraxinus excelsior had the least pronounced water relations and their determination by atmospheric and soil
growth maxima and minima, indicating that growth was more dryness, in line with the turgor pressure threshold concept for
evenly distributed over the 24 h than in other species. growth (Lockhart, 1965; Peters et al., 2021).
Strikingly, the species-specific temporal growth peaks were
very closely negatively related with the annual, species-specific
Different effects of vapour pressure deficit and soil water
number of hours with growth (adj.R2 = 0.77; Fig. 5a; Table 1)
potential on growth
and also with the annual radial stem growth (adj.R2 = 0.4;
Fig. 5b). Species with their growth peak earlier in the night gen- Radial stem growth was associated with high mean SWP ( 6 to
erally had more hours with growth per year (Fagus sylvatica, Abies 65 kPa) and low mean VPD (0.11–0.24 kPa, Table S2),
alba, Fraxinus excelsior) and also generally grew more than those emphasizing the commonly known negative influence of dry air
species with a growth maximum later in the night (Pinus sylvestris, and soil on growth processes (Zweifel et al., 2006; Pappas et al.,
Quercus pubescens). 2020). However, these daily mean values did not account for diel
dynamics and they did not reflect how differently SWP and VPD
were generally related to stem growth at an hourly resolution
Discussion
(Figs 3, 4). VPD consistently limited the main growth (> 75% of
annual growth) to a range < 0.4 kPa (Fig. 3), largely independent
Consistent diel growth patterns across species
of species (Fig. S3) and time of day (Fig. 4), while SWP showed a
We found that the trees grew mainly at night, with species- much wider and more species-specific range of main growth
specific growth peaks between 01:00 h and 06:00 h (Figs 4, 5; (> 900 kPa). Especially at night (Fig. 4), stem growth consis-
Table 1), when the trees are presumed to be best replenished with tently occurred even at lowered SWP, suggesting that growth is
water and thus likely to provide the best conditions to exceed the possible under moderate soil dryness if VPD is low enough at the
turgor threshold for cell division and cell expansion (Schurr et al., same time. The more linear relationship between VPD and stem
2006; Cabon et al., 2020). This timing of growth was consistent growth (over 24 h) than that between SWP and growth (Fig. 4)
New Phytologist (2021) 231: 2174–2185 Ó 2021 The Authors
www.newphytologist.com New Phytologist Ó 2021 New Phytologist FoundationNew
Phytologist Research 2181
also underlines recent findings that VPD increasingly limits tree stomata is, therefore, associated with an even higher VPD that
growth due to an increasingly warmer climate (Novick et al., significantly exceeds that for potential stem growth.
2016; Grossiord et al., 2020; Peters et al., 2021). We interpret the two different sensitivities of growth and
Increased VPD also restricted stem growth under wet soil con- stomata to VPD as indicating that growth processes are generally
ditions, because high atmospheric water demand on a sunny day more sensitive to atmospheric drought than carbon assimilation,
increased transpiration faster than root water uptake, leading to as suggested by recent studies (Muller et al., 2011; Korner, 2015),
tree water deficit (Hinckley & Bruckerhoff, 1975; Zweifel et al., but with the novel aspect that stem growth depends mainly on
2005) and presumably reduced turgor pressure below the growth nocturnal conditions, while assimilation depends on daytime
threshold in the cell-dividing tissue, i.e. the stem cambium conditions. As VPD rapidly increases in the morning, carbon
(Steppe et al., 2006; Cabon et al., 2020). Because the observed assimilation remains active much longer than growth during day-
VPD threshold for main growth was so low and VPD generally light hours. This makes physiological sense from three different
increases so rapidly with daylight, growth inhibition occurred on points of view: First, carbon assimilation of trees is only possible
any sunny day (Fig. 4). Growth in the afternoon was only during sunlight hours and would become very inefficient if the
observed when VPD remained low, that is, on rainy or cloudy stomata were already starting to close with the rising sun. Second,
days. This was sometimes even the case when little rain fell dur- growth does not necessarily have to take place in daylight, as our
ing a period with dry soils (Fig. S6). However, the additional results clearly show (Figs 2, 4). And third, an organism that shuts
meteoric water was not sufficient to moisten the soil to the depth down its carbon sink before its carbon source could potentially
where the soil sensors were installed (10–20 cm), but may have reduce the risk of resource depletion during prolonged drought
increased water uptake by the topmost roots near the soil surface. stress (Rowland et al., 2015). However, stem growth is not the
In addition, small rain events moisten the surface of a tree, reduce only carbon sink in a tree, and it is likely that other organs are
transpiration and can rehydrate the plant via water uptake sinks at different times and could therefore alter the carbon
through the leaves (Goldsmith et al., 2017) and thus have the reserve dynamics independently.
potential to increase negative water potentials and could also raise Since the two processes of growth and carbon assimilation are
turgor pressure above the growth threshold from above. so clearly associated with different VPD ranges, they are also tem-
The importance of humid air for the physiological perfor- porally separated into daylight hours for carbon assimilation and
mance of a tree has also been demonstrated for the redwood tree night hours for growth. Our results thus imply a temporal decou-
giants (Simonin et al., 2009). Our results suggest the importance pling of the processes of carbon source and sink dynamics for
of small rain events not only for these giants, but most likely also growth even within the 24-h cycle, as recently proposed for the
for the growth of temperate tree species, particularly in an seasonal carbon balance (Korner, 2015; Gharun et al., 2020).
increasingly drier environment (McDowell et al., 2020), as also Thus, growth seems not primarily source-controlled by the actual
recently suggested by Dietrich & Kahmen (2019). Low VPD is carbon uptake, but rather a process that is highly dependent on
most likely not directly responsible for growth, but it seems to be tree water relations and the current environmental conditions, i.e.
a strong indicator for leaf surface wetness, which induces the nec- soil moisture and air humidity.
essary relaxation of low water potentials. However, SWPs that
were too low (Fig. 3) did not allow for growth either. We assume
Species-specific diel timing of growth
that under such conditions the tree’s growth physiology cannot
be sufficiently stimulated by atmospheric moisture alone. Over- Despite the generality of the daily growth trends, the seven
all, our results suggest that under moderately dry soil conditions, species studied consistently differed in the timing of the growth
information on air humidity is essential to accurately estimate peaks (Table 1; Fig. 5), and it was striking that the earlier a noc-
stem growth. turnal growth peak of a species was reached, the higher the num-
ber of hours with growth per year and the annual radial growth
of the stem were (Fig. 5).
Stem growth is more drought-sensitive than carbon
Interestingly, we did not find a consistent grouping of species
assimilation
in Fig. 5 with respect to wood types (gymnosperms,
A VPD > 0.4 kPa strongly reduced stem growth and for a VPD angiosperms), wood anatomy (ring-porous, diffuse-porous, tra-
> 1 kPa it was only marginal (Figs 3, 4). The low VPD threshold cheids) or foliage type (evergreen needles, deciduous leaves).
for growth thus seems to be in marked contrast to the initial However, the ranking of species along the linear regression line
stomatal response to VPD, which is known to start at a VPD of between time of day of maximum growth and the annual number
> 0.5 kPa for probably all tree species (Oren et al., 1999; of hours with growth was at least partly explainable by the respec-
Grossiord et al., 2020) and could reach values of up to > 2 kPa in tive SWP and VPD ranges for growth (Table S2). The drier the
more drought-adapted species, for example, Quercus (Gil- average site conditions where a species occurred, the fewer hours
Pelegrin et al., 2017). Moreover, above the VPD threshold for with growth were measured, which is consistent with the gener-
the initial response, the entirety of the stomata do not suddenly ally known limitation of growth by drought (McDowell &
close completely but gradually limit CO2 uptake as VPD contin- Sevanto, 2010; Korner, 2015; Pappas et al., 2020). This was
ues to increase (Hetherington & Woodward, 2003). This implies especially true for the two most extreme species in our study,
that the suppression of carbon assimilation by fully closed Abies alba (growing mostly under humid conditions) and Quercus
Ó 2021 The Authors New Phytologist (2021) 231: 2174–2185
New Phytologist Ó 2021 New Phytologist Foundation www.newphytologist.comNew
2182 Research Phytologist
pubescens (growing under driest conditions). Though, this was expected if a species closed its stomata completely regardless of
not consistently true for all species between these two extremes environmental conditions, for example, initiated by a circadian
(Tables 1, S2), which might also be due to averaging the wide rhythm. Such a mechanism also has the potential to explain the
range of conditions that some of the species covered (e.g. Pinus unusual diel growth pattern of Fagus sylvatica and possibly other
sylvestris, Fig. 1). species.
The very close linear relationship between the timing of the
diel growth peak and the annual number of hours with growth
Potential limitations of the results
(adj.R2 = 0.77) suggests a general mechanistic reason governing
it. We speculate that those species that are able to grow earlier at Any result is only as good as its underlying data quality and
night (Fig. 2) generally have more hours available under suitable premises. This work relies on technically correct measurements
conditions per night and therefore have a better chance of accu- of radial stem size changes in micrometre resolution, consistent
mulating more hours with growth over the season. However, the and reproducible handling of the partially erroneous dendrome-
results also showed that the species with an earlier growth peak ter raw data (Haeni et al., 2020) and on the zero-growth
(Fagus sylvatica, Abies alba, Fraxinus excelsior) also reduced their approach that separates the dendrometer data into irreversible
growth earlier (Fig. 2) and therefore did not take full advantage radial growth due to new cells and reversible swelling and shrink-
of the generally moistest conditions around dawn. By contrast, ing due to water relations in the tree (Zweifel et al., 2016).
species with a late growth peak (Pinus sylvestris, Quercus The homogeneous technical design of the network (www.treene
pubescens) may not have had enough time to grow long enough t.info) with the use of only one type of high-precision point den-
due to the environmental constraints, resulting in pronounced drometers, the uniform hardware for recording the data, the auto-
growth peaks around dawn (Fig. 2), a reduced number of grow- matic data transfer to a central database and the automated
ing hours per night and per growing season, and thus reduced routine for uniform cleaning and quality checking of the raw data
absolute annual stem growth (Fig. 5). helped to optimize the reliability of the data. However, the
remaining technical uncertainties due to undetected data outliers
despite the automated cleaning procedure and manual data check-
What alters the species-specific nocturnal growth peaks?
ing, or the remaining temperature sensitivity of the measuring
The generally drier conditions under which some of the species instruments despite a setup developed to minimize this effect, can
grew could be part of the answer. However, we speculate on other never be completely avoided. In this work, it can be assumed that
reasons as well. First, the species-specific morphological differ- such effects are levelled out by the aggregation steps of the huge
ences, for example, bark thickness or water transport capacity of data set, or affect all measurements in the same systematic way and
the wood (Steppe et al., 2006) could play a role. Fagus sylvatica, are thus of little relevance to the results presented. Also not to be
as the species with the earliest growth peak, has by far the completely excluded are potential artefacts due to episodic hygro-
thinnest bark tissue of the species studied (Ilek & Kucza, 2014) scopic swelling of the bark when the stem surface is wetted by rain
and therefore may need less water and time to replenish its (Oberhuber et al., 2020). However, this potential effect was mini-
shrunken tissue. Further, an efficient water transport system such mized by using point dendrometers (not band dendrometers) and
as the ring-porous wood of Fraxinus excelsior could help to accel- removing the dead outermost bark layer under the measuring pin.
erate the replenishment of the tree’s water deficit (Brinkmann The still largely unknown processes of bark decomposition (Gricar
et al., 2016; Klesse et al., 2020) and thus induce a faster increase et al., 2015) are mainly assumed to occur during winter and there-
in cambium turgor after nightfall. Second, the increase of turgor fore also have little relevance for this work.
pressure could additionally be enhanced by osmoregulation, a Essential for the quality of the results is the reliability of the
process actively altering a cambium cell’s turgor even during peri- zero-growth approach. The approach builds on the widely
ods when water potentials in the xylem are low due to increased accepted turgor threshold theory for cell growth (Lockhart, 1965;
transpiration, as has recently been shown for several tree species Steppe et al., 2006; Muller et al., 2011; Lazzarin et al., 2019;
(Zweifel et al., 2014; Barraclough et al., 2019; Lazzarin et al., Cabon et al., 2020; Peters et al., 2021) and is based on the
2019). And third, the circadian rhythm has been shown to play assumption that the turgor threshold for growth cannot be
an important role in explaining species-specific phenological exceeded once a tree stem starts to shrink (Zweifel et al., 2016).
traits, for example, bud burst or the molecular regulation of The approach has been shown to be largely reliable based on sev-
annual growth (Singh et al., 2017; de Dios & Gessler, 2018; eral indirect tests and theoretical considerations on a handful of
Huang et al., 2020). Fagus sylvatica is known to follow the circa- temperate tree species, but lacks an ultimate test with an indepen-
dian rhythm (de Dios et al., 2015) more closely than other dent measurement method. Therefore, a residual uncertainty
species. We, therefore, speculate that there might also be an influ- about the accuracy of the approach remains. Any deviation of the
ence of the circadian clockwork on diel growth. Our assumption initial stem shrinkage from the stop of cell growth would affect
is based on the unique, temporally irregular pattern of the growth the results presented. However, even if the time at which a tree
response to VPD of Fagus sylvatica (Fig. 4). Fagus is the only stem begins to grow, determined by the zero-growth approach,
species where the otherwise constant relationship between VPD were not absolutely precise, this would hardly affect the growth
and growth disappeared during the night. Such a pattern suggests response curves shown, since stem shrinkage occurs quite rapidly
a decoupling of growth from VPD and would for example be at dawn, which means that crossing the threshold for growth
New Phytologist (2021) 231: 2174–2185 Ó 2021 The Authors
www.newphytologist.com New Phytologist Ó 2021 New Phytologist FoundationNew
Phytologist Research 2183
would only be delayed for a short period of probably less than an LW, MW, SE. Visualization: RZ, RLP, SE, KZ. Funding acqui-
hour. Such a systematic shift in initial growth would not affect sition: RZ, NB, WE, LW, SE. Project administration: RZ, SE.
the daily VPD-GRO or SWP-GRO patterns, but could in the Supervision: RZ, WE, SB, SE. Writing – original draft: RZ, FS,
worst case lead to slightly shifted VPD and SWP ranges for SB, NB, WE, AG, MH, RLP, LW, MW, KZ, SE.
growth. However, this reasoning does not cover the objection if
someone disputes the correctness of the turgor threshold theory
ORCID
for growth, which is the most critical premise of this article.
Sabine Braun https://orcid.org/0000-0003-4268-7659
Nina Buchmann https://orcid.org/0000-0003-0826-2980
Conclusions
Sophia Etzold https://orcid.org/0000-0002-5383-2228
Hourly-resolved growth data opened a new dimension in the Werner Eugster https://orcid.org/0000-0001-6067-0741
analysis of stem growth responses to changing environmental Arthur Gessler https://orcid.org/0000-0002-1910-9589
conditions. Diel growth dynamics as a function of VPD and Matthias H€ani https://orcid.org/0000-0003-3977-2166
SWP showed robust general patterns as well as small but consis- Richard L. Peters https://orcid.org/0000-0002-7441-1297
tent, species-specific deviations from them. The dependence of Frank Sterck https://orcid.org/0000-0001-7559-6572
growth on very low atmospheric water demand (low VPD) and Lorenz Walthert https://orcid.org/0000-0002-1790-8563
its temporal decoupling from periods of photosynthesis suggests Micah Wilhelm https://orcid.org/0000-0002-5022-3195
that carbon allocation to radial stem growth is mainly sink-driven Kasia Zieminska https://orcid.org/0000-0001-7750-4758
on a diel scale. It also suggests that growth depends primarily on Roman Zweifel https://orcid.org/0000-0001-9438-0582
tree water conditions and only secondarily on current carbon
allocation, at least in the short term.
Data availability
The higher drought sensitivity of the growth process compared
to the carbon assimilation process may explain why even starving All underlying data is made available in a data repository (https://
trees do not exhaust their carbon reserves under drought stress, www.pangaea.de).
since in a dry period, carbon assimilation seems possible for
longer than radial stem growth. The fact that the timing of peak
References
growth within the 24-h cycle has such strong explanatory power
for the overall growth performance of a species suggests a subtly Auguie B, Antonov A. 2017. Miscellaneous functions for ‘grid’ graphics. CRAN.
[WWW document] URL https://rdrr.io/cran/gridExtra/ [accessed 9 June
balanced interplay between the different carbon source and sink 2021].
dynamics and highlights the close link between a tree’s water rela- Babst F, Bodesheim P, Charney N, Friend AD, Girardin MP, Klesse S, Moore
tions and its growth. The findings that trees grow mainly at night DJP, Seftigen K, Bj€orklund J, Bouriaud O et al. 2018. When tree rings go
and that VPD, in addition to SWP, has a strongly limiting influ- global: challenges and opportunities for retro- and prospective insight.
ence on growth is key to better understand climate change effects Quaternary Science Reviews 197: 1–20.
Babst F, Bouriaud O, Poulter B, Trouet V, Girardin MP, Frank DC. 2019.
on forest growth dynamics. Twentieth century redistribution in climatic drivers of global tree growth.
Science Advances 5: 1–9.
Barraclough AD, Zweifel R, Cusens J, Leuzinger S. 2019. Disentangling the net:
Acknowledgements concomitant xylem and over-bark size measurements reveal the phloem-
The authors thank Nicolas De Girardi, Roger K€ochli and K€athi generated turgor signal behind daytime stem swelling in the mangrove
Avicennia marina. Functional Plant Biology 46: 393–406.
Liechti for their fieldwork within the TreeNet network and Bastos A, Ciais P, Friedlingstein P, Sitch S, Pongratz J, Fan L, Wigneron Jp,
acknowledge the technical support from the Swiss Long-term Weber U, Reichstein M, Fu Z et al. 2020. Direct and seasonal legacy effects of
Forest Ecosystem Research Programme LWF as well as data pro- the 2018 heat wave and drought on European ecosystem productivity. Science
vision by the National Air Pollution Monitoring Network Advances 6: eaba2724.
NABEL, ICOS-CH and MeteoSwiss. Dendrometer data was Brinkmann N, Eugster W, Zweifel R, Buchmann N, Kahmen A. 2016.
Temperate tree species show identical response in tree water deficit but
provided by the project TreeNet. different sensitivities in sap flow to summer soil drying. Tree Physiology 36:
Funding bodies: Swiss National Science Foundation SNF 1508–1519.
grants 20FI21_148992 and 20FI20_173691 (ICOS-CH: NB, Cabon A, Fernandez-de-U~ na L, Gea-Izquierdo G, Meinzer FC, Woodruff DR,
SE, WE). Swiss National Science Foundation SNF grant Martınez-Vilalta J, De Ca ceres M. 2020. Water potential control of turgor-
P2BSP3_184475 (RLP). Federal Office for the Environment driven tracheid enlargement in Scots pine at its xeric distribution edge. New
Phytologist 225: 209–221.
FOEN grants 18.0031.PJ/E2C9DDCC1 (MW, RZ), Carminati A, Javaux M. 2020. Soil rather than xylem vulnerability controls
00.25992A/E3D4E3424 (SE, RZ), 00.25992A/08B6EC6C3 stomatal response to drought. Trends in Plant Science 25: 868–880.
(SE, LW), 18.0031.PJ/E2C9DDCC1 (RZ). Charrier G, Nolf M, Leitinger G, Charra-Vaskou K, Losso A, Tappeiner U,
Ameglio T, Mayr S. 2017. Monitoring of freezing dynamics in trees: a
simple phase shift causes complexity. Plant Physiology 173: 2196–2207.
Author contributions Cuny HE, Rathgeber CBK, Frank D, Fonti P, M€a kinen H, Prislan P, Rossi S,
del Castillo EM, Campelo F, Vavrcık H et al. 2015. Woody biomass
Conceptualization: RZ, FS, SE. Methodology: RZ, FS, NB, WE, production lags stem-girth increase by over one month in coniferous forests.
AG, MH, RLP, LW, MW, KZ, SE. Investigation: RZ, SB, MH, Nature Plants 1: 1–6.
Ó 2021 The Authors New Phytologist (2021) 231: 2174–2185
New Phytologist Ó 2021 New Phytologist Foundation www.newphytologist.comNew
2184 Research Phytologist
Delpierre N, Berveiller D, Granda E, Dufrene E. 2016. Wood phenology, not Korner C. 2015. Paradigm shift in plant growth control. Current Opinion in
carbon input, controls the interannual variability of wood growth in a Plant Biology 25: 107–114.
temperate oak forest. New Phytologist 210: 459–470. Lamacque L, Charrier G, Farnese FD, Lemaire B, Ameglio T, Herbette S. 2020.
Dietrich L, Kahmen A. 2019. Water relations of drought-stressed temperate trees Drought-induced mortality: branch diameter variation reveals a point of no
benefit from short drought-intermitting rainfall events. Agricultural and Forest recovery in Lavender species. Plant Physiology 183: 1638–1649.
Meteorology 265: 70–77. Lazzarin M, Zweifel R, Anten N, Sterck FJ. 2019. Does phloem osmolality affect
de Dios VR, Gessler A. 2018. Circadian regulation of photosynthesis and diurnal diameter changes of twigs but not of stems in Scots pine? Tree
transpiration from genes to ecosystems. Environmental and Experimental Botany Physiology 39: 275–283.
152: 37–48. Lockhart JA. 1965. An analysis of irreversible plant cell elongation. Journal of
de Dios VR, Roy J, Ferrio JP, Alday JG, Landais D, Milcu A, Gessler A. 2015. Theoretical Biology 8: 264–275.
Processes driving nocturnal transpiration and implications for estimating land McDowell NG, Allen CD, Anderson-Teixeira K, Aukema BH, Bond-
evapotranspiration. Scientific Reports 5. Lamberty B, Chini L, Clark JS, Dietze M, Grossiord C, Hanbury-Brown A
Dixon HH, Joly J. 1894. On the ascent of sap. Philosophical Transactions of the et al. 2020. Pervasive shifts in forest dynamics in a changing world. Science
Royal Society of London B: Biological Sciences 186: 563–576. 368: 1–10.
Eitel JUH, Griffin KL, Boelman NT, Maguire AJ, Meddens AJH, Jensen J, McDowell NG, Sevanto S. 2010. The mechanisms of carbon starvation: how,
Vierling LA, Schmiege SC, Jennewein JS. 2020. Remote sensing tracks daily when, or does it even occur at all? New Phytologist 186: 264–266.
radial wood growth of evergreen needleleaf trees. Global Change Biology 26: Mencuccini M, Salmon Y, Mitchell P, H€oltt€a T, Choat B, Meir P, O’Grady A,
4068–4078. Tissue D, Zweifel R, Sevanto S et al. 2017. An empirical method that
Fatichi S, Leuzinger S, Korner C. 2014. Moving beyond photosynthesis: fromcarbon separates irreversible stem radial growth from bark water content changes in
source tosink-driven vegetationmodeling.New Phytologist201: 1086–1095. trees: theory and case studies. Plant, Cell & Environment 40: 290–303.
Gharun M, H€ortnagl L, Paul-Limoges E, Ghiasi S, Feigenwinter I, Burri S, Muller B, Pantin F, Genard M, Turc O, Freixes S, Piques M, Gibon Y. 2011.
Marquardt K, Etzold S, Zweifel R, Eugster W et al. 2020. Physiological Water deficits uncouple growth from photosynthesis, increase C content, and
response of Swiss ecosystems to 2018 drought across plant types and elevation. modify the relationships between C and growth in sink organs. Journal of
Philosophical Transactions 375: 1–10. Experimental Botany 62: 1715–1729.
Gil-Pelegrin E, Saz MA, Cuadrat JM, Peguero-Pina JJ, Sancho-Knapik D. Novick KA, Ficklin DL, Stoy PC, Williams CA, Bohrer G, Oishi A, Papuga SA,
2017. Oaks under Mediterranean-type climates: functional response to summer Blanken PD, Noormets A, Sulman BN et al. 2016. The increasing importance
aridity. In: Gil-Pelegrin E, Peguero-Pina JJ, Sancho-Knapik D, eds. Oaks of atmospheric demand for ecosystem water and carbon fluxes. Nature Climate
physiological ecology. Exploring the functional diversity of Genus Quercus L. Cham, Change 6: 1023–1027.
Switzerland: Springer, 137–193. Oberhuber W, SehrtM, KitzF.2020. Hygroscopic propertiesof thin dead outer bark
Goldsmith GR,Lehmann MM, CernusakLA,ArendM, SiegwolfRTW. 2017. layersstrongly influencestemdiameter variations on shortand long time scalesin
Inferring foliar water uptake using stable isotopes of water.Oecologia 184: 763–766. Scotspine (Pinus sylvestris L.).Agriculturaland ForestMeteorology 290:1–7.
Gricar J, Jagodic S, Prislan P. 2015. Structure and subsequent seasonal changes Oren R, Sperry JS, Katul GG, Pataki DE, Ewers BE, Phillips N, Schafer KVR.
in the bark of sessile oak (Quercus petraea). Trees-Structure and Function 29: 1999. Survey and synthesis of intra- and interspecific variation in stomatal
747–757. sensitivity to vapour pressure deficit. Plant, Cell & Environment 22: 1515–1526.
Grossiord C, Buckley TN, Cernusak LA, Novick KA, Poulter B, Siegwolf Pappas C, Peters RL, Fonti P. 2020. Linking variability of tree water use and
RTW, Sperry JS, McDowell NG. 2020. Plant responses to rising vapor growth with species resilience to environmental changes. Ecography 43: 1386–
pressure deficit. New Phytologist 226: 1550–1566. 1399.
G€uney A, Zweifel R, Turkan S, Zimmermann R, Wachendorf M, Guney CO. Peters RL, Steppe K, Cuny HE, De Pauw DJW, Frank DC, Schaub M,
2020. Drought responses and their effects on radial stem growth of two co- Rathgeber CBK, Cabon A, Fonti P. 2021. Turgor – a limiting factor for radial
occurring conifer species in the Mediterranean mountain range. Annals of Forest growth in mature conifers along an elevational gradient. New Phytologist 229:
Science 77: 1–16. 213–229.
Haeni M, Kn€ usel S, Peters RL, Zweifel R. 2020. treenetproc – clean, process and R Core Team. 2019. R: A language and environment for statistical computing,
visualise dendrometer data. R package v.0.1.4. Github repository. [WWW v.3.6.2. Vienna, Austria: R Foundation for Statistical Computing. [WWW
document] URL https://github.com/treenet/treenetproc [accessed 9 June document] URL http://www.R-project.org/.
2021]. Rathgeber CBK, Cuny HE, Fonti P. 2016. Biological basis of tree-ring
Hetherington AM, Woodward FI. 2003. The role of stomata in sensing and formation: a crash course. Frontiers in Plant Science 7: 1–7.
driving environmental change. Nature 424: 901–908. Rowland L, da Costa ACL, Galbraith DR, Oliveira RS, Binks OJ, Oliveira
Hinckley TM, Bruckerhoff DM. 1975. The effects of drought on water relations AAR, Pullen AM, Doughty CE, Metcalfe DB, Vasconcelos SS et al. 2015.
and stem shrinkage of Quercus alba. Canadian Journal of Botany – Revue Death from drought in tropical forests is triggered by hydraulics not carbon
Canadienne de Botanique 53: 62–72. starvation. Nature 528: 119–122.
Huang J-G, Ma Q, Rossi S, Biondi F, Deslauriers A, Fonti P, Liang E, M€a kinen Schafer C, Rotzer T, Thurm EA, Biber P, Kallenbach C, Pretzsch H. 2019.
H, Oberhuber W, Rathgeber CBK et al. 2020. Photoperiod and temperature Growth and tree water deficit of mixed Norway spruce and European beech at
as dominant environmental drivers triggering secondary growth resumption in different heights in a tree and under heavy drought. Forests 10: 1–20.
Northern Hemisphere conifers. Proceedings of the National Academy of Sciences, Schurr U, Walter A, Rascher U. 2006. Functional dynamics of plant growth and
USA 117: 20645–20652. photosynthesis – from steady-state to dynamics – from homogeneity to
Ilek A, Kucza J. 2014. Hydrological properties of bark of selected forest tree heterogeneity. Plant, Cell & Environment 29: 340–352.
species. Part I: the coefficient of development of the interception surface of Schweingruber FH. 1996. Tree rings and environment. Dendroecology. Berne,
bark. Trees-Structure and Function 28: 831–839. Switzerland: Paul Haupt Publishers.
Klesse S, Arx G, Gossner MM, Hug C, Rigling A, Queloz V. 2020. Amplifying Sellier D, Segura R. 2020. Radial growth anisotropy and temporality in fast-
feedback loop between growth and wood anatomical characteristics of Fraxinus growing temperate conifers. Annals of Forest Science 77: 1–12.
excelsior explains size-related susceptibility to ash dieback. Tree Physiology 41: Simonin KA, Santiago LS, Dawson TE. 2009. Fog interception by Sequoia
683–696. sempervirens (D. Don) crowns decouples physiology from soil water deficit.
Kn€ usel S, Conedera M, Zweifel R, Bugmann H, Etzold S, Wunder J. 2019. Plant, Cell & Environment 32: 882–892.
High growth potential of Ailanthus altissima in warm and dry weather Singh RK, Svystun T, AlDahmash B, Jonsson AM, Bhalerao RP. 2017.
conditions in novel forests of southern Switzerland. Trees—Structure and Photoperiod- and temperature-mediated control of phenology in trees – a
Function 33: 395–409. molecular perspective. New Phytologist 213: 511–524.
New Phytologist (2021) 231: 2174–2185 Ó 2021 The Authors
www.newphytologist.com New Phytologist Ó 2021 New Phytologist FoundationYou can also read