Whole-Blood Transcriptome Analysis of Feedlot Cattle With and Without Bovine Respiratory Disease
←
→
Page content transcription
If your browser does not render page correctly, please read the page content below
ORIGINAL RESEARCH
                                                                                                                                              published: 08 March 2021
                                                                                                                                       doi: 10.3389/fgene.2021.627623

                                              Whole-Blood Transcriptome Analysis
                                              of Feedlot Cattle With and Without
                                              Bovine Respiratory Disease
                                              Janelle Jiminez 1 , Edouard Timsit 2,3,4 , Karin Orsel 2 , Frank van der Meer 5 , Le Luo Guan 1
                                              and Graham Plastow 1*
                                              1
                                                Department of Agricultural, Food and Nutritional Science, Livestock Gentec, University of Alberta, Edmonton, AB, Canada,
                                              2
                                                Department of Production Animal Health, Faculty of Veterinary Medicine, University of Calgary, Calgary, AB, Canada,
                                              3
                                                Simpson Ranch Chair in Beef Cattle Health and Wellness, University of Calgary, Calgary, AB, Canada, 4 Ceva Santé
                                              Animale, Libourne, France, 5 Department of Ecosystem and Public Health, Faculty of Veterinary Medicine, University
                                              of Calgary, Calgary, AB, Canada

                                              Bovine respiratory disease (BRD) is one of the main factors leading to morbidity
                                              and mortality in feedlot operations in North America. A complex of viral and
                                              bacterial pathogens can individually or collectively establish BRD in cattle, and
                            Edited by:        to date, most disease characterization studies using transcriptomic techniques
                Fabiana Quoos Mayer,
                                              examine bronchoalveolar and transtracheal fluids, lymph node, and lung tissue as
      Institute of Veterinary Research
     Desidério Finamor (IPVDF), Brazil        well as nasopharyngeal swabs, with limited studies investigating the whole-blood
                       Reviewed by:           transcriptome. Here, we aimed to identify differentially expressed (DE) genes involved in
                      Ricardo Zanella,        the host immune response to BRD using whole blood and RNA sequencing. Samples
 The University of Passo Fundo, Brazil
                         Jose Vargas,
                                              were collected from heifers (average arrival weight = 215.0 ± 5.3 kg) with (n = 25)
 The University of Passo Fundo, Brazil        and without (n = 18) BRD at a commercial feedlot in Western Canada. RNAseq
                  *Correspondence:            analysis showed a distinct whole-blood transcriptome profile between BRD and non-
                     Graham Plastow
                                              BRD heifers. Further examination of the DE genes revealed that those involved in
                 plastow@ualberta.ca
                                              the host inflammatory response and infectious disease pathways were enriched in
                   Specialty section:         the BRD animals, while gene networks associated with metabolism and cell growth
         This article was submitted to
                                              and maintenance were downregulated. Overall, the transcriptome profile derived from
                  Livestock Genomics,
               a section of the journal       whole blood provided evidence that a distinct antimicrobial peptide-driven host immune
                  Frontiers in Genetics       response was occurring in the animals with BRD. The blood transcriptome of the
       Received: 09 November 2020             BRD animals shows similarities to the transcriptome profiles obtained from lung and
        Accepted: 08 February 2021
         Published: 08 March 2021
                                              bronchial lymph nodes in other studies. This suggests that the blood transcriptome
                             Citation:
                                              is a potential diagnostic tool for the identification of biomarkers of BRD infection
          Jiminez J, Timsit E, Orsel K,       and can be measured in live animals and used to further understand infection and
         van der Meer F, Guan LL and
                                              disease in cattle. It may also provide a useful tool to increase the understanding of the
       Plastow G (2021) Whole-Blood
    Transcriptome Analysis of Feedlot         genes involved in establishing BRD in beef cattle and be used to investigate potential
      Cattle With and Without Bovine          therapeutic applications.
                 Respiratory Disease.
            Front. Genet. 12:627623.          Keywords: bovine respiratory disease, differentially expressed genes (DEGs), host immune response, innate
    doi: 10.3389/fgene.2021.627623            immunity, RNA sequencing

Frontiers in Genetics | www.frontiersin.org                                         1                                           March 2021 | Volume 12 | Article 627623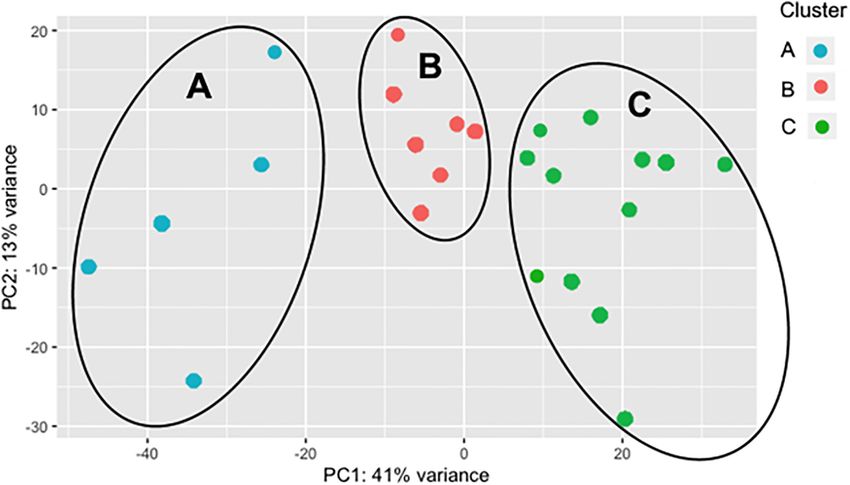
Jiminez et al.                                                                                                                   Differential Gene Expression in BRD

INTRODUCTION                                                                              of resistance or resilience markers for future application in
                                                                                          breeding or management.
Bovine respiratory disease (BRD) is one of the main causes
of morbidity and mortality in beef cattle in North America
(USDA, 2011). Beef cattle of all ages can be affected with                                MATERIALS AND METHODS
BRD; however, they are most affected on or soon after
entry into the feedlot (Babcock et al., 2010). This timing                                Ethics Statement
of infection is most likely due to the animal’s exposure to                               This study was conducted in accordance to the Canadian Council
a wide range of pathogens that takes place at a time when                                 of Animal Care (2009) guidelines and recommendations (CCAC,
various stressors (weaning, transportation, and commingling)                              2009). All experimental procedures were reviewed and approved
negatively affect their immune system (Caswell, 2014;                                     by the University of Calgary Veterinary Sciences Animal Care
Timsit et al., 2016).                                                                     Committee (AC15-0109).
   Although respiratory pathogens (mainly viruses and bacteria)
and factors predisposing cattle to BRD are relatively well
understood (Taylor et al., 2010), the host response and its                               Animals
relationship with disease outcomes to BRD, such as the host’s                             Mixed-breed beef heifers at high risk of developing BRD (i.e.,
ability to maintain performance regardless of pathogen burden,                            recently weaned, commingled, and auction-market derived)
needs to be further investigated (Van Eenennaam et al., 2014;                             were enrolled between November 2015 and January 2016 at
Mulder and Rashidi, 2017). For instance, in cattle infected                               a commercial feedlot in Southern Alberta, Canada. At on-
with respiratory pathogens, it is currently difficult to determine                        arrival processing, heifers received a subcutaneous injection of
which cattle will exhibit visual and clinical signs of BRD or                             a long-acting macrolide (tulathromycin, Draxxin, 2.5 mg/kg,
even require an antimicrobial treatment (Timsit et al., 2011b;                            Zoetis, Kirkland, QC, Canada) and were weighed and vaccinated
Wolfger et al., 2015). Transcriptome analysis can lead to                                 against infectious bovine herpes virus-1 (BoHV-1), bovine viral
insights into disease processes, and biomarkers to assess disease                         diarrhea virus (BVDV) (types I and II), bovine parainfluenza-3
states, progression, and prognosis. Thus far, transcriptomic                              (PI3V), bovine respiratory syncytial virus (BRSV), Mannheimia
techniques have examined bronchoalveolar fluids, lung tissue,                             haemolytica, Histophilus somni, and clostridial pathogens. They
and sputum samples of cattle with or without BRD (Aich                                    were also dewormed with a pour-on ivermectin solution. In
et al., 2009; Rai et al., 2015; Behura et al., 2017; Johnston                             addition, they received a prostaglandin F2α analog to induce
et al., 2019), but there is much less information on the                                  abortion, as per standard feedlot procedure. Heifers were fed
whole-blood transcriptome (Lindholm-Perry et al., 2018; Sun                               in large outdoor dirt-floor pens with approximately 250–300
et al., 2020). In comparison with lung tissue biopsies, blood                             animals per pen. They were fed twice daily, a concentrate
is easier to obtain and can be collected repeatedly throughout                            barley-based receiving/growing diet formulated to meet or exceed
the production period and can give real-time results, instead                             nutrient requirements. This diet contained 25 ppm of monensin
of postmortem conclusions. Furthermore the host immune                                    (Rumensin 200, Elanco, Guelph, ON, Canada) and 35 ppm
response detected in the blood can reflect those responses                                of chlortetracycline (Aureomycin 220, Zoetis). Each morning
occurring at the site of infection (Kawayama et al., 2016;                                before feeding, bunks were visually inspected, and feed deliveries
Vinther et al., 2016).                                                                    were adjusted to ensure that sufficient feed was available for
   Therefore, the objective of this study was to use RNA                                  ad libitum consumption. At approximately 30 days after arrival,
sequencing to analyze the whole-blood transcriptome of feedlot                            cattle received another vaccination against infectious BoHV-1,
cattle with or without BRD. We hypothesized that animals                                  BVDV types I and II, PI3V, BRSV, and a growth implant. Finally,
exhibiting BRD would show a specific pattern of response                                  cattle were individually weighed at approximately 120 days on
in their blood transcriptome and that such patterns will                                  feed (DOF). Average daily gain (ADG) was calculated using the
provide further insight into the host immune response.                                    difference between arrival weight and weight at blood sampling,
Furthermore, variation in the blood transcriptome of animals                              divided by the DOF.
with and without BRD could potentially provide markers
                                                                                          Case Definition
                                                                                          Animals were retrospectively identified as BRD positive based
Abbreviations: ADG, average daily gain; ALAS, aminolevulinic acid synthase;
BoHV-1, bovine herpes virus-1; BRD, bovine respiratory disease; BRSV, bovine
                                                                                          on clinical examination and serum haptoglobin concentration.
respiratory syncytial virus; BVDV, bovine viral diarrhea virus; CATH, cathelicidin;       Heifers with at least one visual BRD sign, a rectal temperature
CFB, complement factor B; CPM, counts per million; DE, differentially expressed;          ≥40◦ C, abnormal lung sounds detected at auscultation, a serum
DEFB, beta-defensin; DOF, days on feed; EBD, enteric beta defensin; FDR,                  haptoglobin concentration ≥0.25 g/L, and no prior treatment
false discovery rate; GLM, general linear model; GZM, granzyme; HB, globin;
HP, haptoglobin; IL, interleukin; LCN, lipocalin; LTF, lactoferrin; MHC, major            against BRD or other diseases during the feeding period (i.e., first
histocompatibility complex; MMP, matrix metallopeptidase; NB, non-BRD; PCA,               BRD occurrence) were defined as BRD cases. Heifers that had no
principal component analysis; PCR, polymerase chain reaction; PI3V, bovine                visual signs of BRD, a rectal temperature
Jiminez et al. Differential Gene Expression in BRD
healthy controls, which were classified as non-BRD (NB) animals and adapter ligation were performed for each library. Following
for transcriptome analysis. these steps, libraries were polymerase chain reaction (PCR)
amplified, validated using the Bioanalyzer (Agilent Technologies
Study Design Inc., Cedar Creek, TX, United States), and finally normalized and
Heifers were observed daily by experienced pen checkers for pooled. Unique indices were used for all samples, and libraries
detection of clinical illness during the first 60 days from entry. were pooled and sequenced paired end (2 × 100 bp) on four
Cattle with one or more visual signs of BRD (e.g., depression, separate lanes on a HiSeq 4000 platform, and sequencing was
nasal or ocular discharge, cough, tachypnea, or dyspnea) were performed at McGill University and Genome Quebec Innovation
removed from the pens by pen checkers and, if not previously Center (Montreal, QC, Canada). In total, 43 samples were used to
treated for BRD or another disease during the feeding period, generate paired-end sequences, and their raw reads were used for
were clinically examined by an experienced veterinarian (ET) and downstream analyses.
a blood sample collected. For every heifer suspected of having
BRD, one or two visually healthy cattle (no visual signs of BRD Transcriptome Data Analysis
or other disease) were selected as pen-matched contemporary Raw reads were analyzed for quality and adapter sequence
controls (for convenience, these animals were close to the gate presence using FastQC (v0.11.8), and adapter sequences
or to the apparently sick animal, etc.) examined as for the BRD were removed using Trimmomatic (v0.39). These cleaned-up
animals (if not previously treated for BRD or another disease sequences were mapped and aligned to the Bos taurus reference
during the feeding period). genome (ARS-UCD1.2.98) using STAR (v2.7.1a) with default
Clinical examinations included assessment of visual signs settings (Dobin et al., 2013), and read counts were generated
of respiratory disease (cf. above), determination of respiratory using FeatureCounts (SubRead v1.6.4). The counts were then
rate and rectal temperature, and a complete lung auscultation analyzed using the Bioconductor packages EdgeR and DESeq in
using a conventional stethoscope to detect abnormal lung sounds the R (v3.5.2) software environment. Counts per million (CPM)
(e.g., increased bronchial sounds, crackles, and wheezes). Two was used to evaluate expression, and transcripts with CPM > 2
blood samples from each animal were collected at the same time were considered as expressed.
by jugular vein puncture to determine (i) serum haptoglobin
concentration [plastic serum tubes; Becton Dickinson, ON
(Timsit et al., 2011a)] and (ii) the whole-blood transcriptome Differential Gene Expression Analysis
(Tempus tubes; Thermo Fisher Scientific, ON). Heifers with Differential gene expression results were obtained using EdgeR
at least one visual BRD sign and a rectal temperature ≥40◦ C to compare animals with BRD (n = 25) with NB (n = 18) using
received an antibiotic treatment intramuscularly in combination the following parameters: P-value < 0.05 were adjusted to a 0.01
with non-steroidal anti-inflammatory drugs (e.g., 40 mg/kg of cutoff (P-adj), with a log fold change (Log2FC) > 2, with log
florfenicol and 2.2 mg/kg of flunixin, 2 ml/15 kg, Resflor, Merck CPM > 2. The data were also filtered with the “keep” command
Animal Health) after sample collection, in accordance with to keep samples with CPM ≥ 2 in at least 18 samples, as the
feedlot treatment protocols. number of samples in the NB group was 18 (Robinson et al.,
2010). This value represents genes that are expressed in all the
Determination of Serum Haptoglobin samples measured, and the dataset was normalized with the
trimmed mean of M-values (TMM) normalization. To test for
Concentration differential expression between the BRD and NB animals, the
Serum haptoglobin concentrations were determined in duplicate factors of “brd” and “pen” were used to test the difference in
using a commercially available kit (Tridelta Phase Range expression between the animals. The NB animals were set as the
Haptoglobin assay, Tridelta Development) as described (Timsit reference in this design model, and the read count data were fitted
et al., 2011a). The working range was 0.0–2.5 g/L. to a negative binomial general linear model (GLM) representing
the design. Prior to fitting the model, the “Common,” “Trended,”
Total RNA Isolation and mRNA Library and “Tagwise” negative binomial dispersion were estimated, and
Preparation the biological coefficient of variation was calculated at 78% with
Total RNA was isolated from bovine blood using a Preserved a dispersion ratio of 0.61. Statistical tests were then performed
Blood RNA Purification Kit (Norgen Biotek Corp, Thorold, ON, for the coefficient relating to the BRD animals, and the top
Canada), and the quality of RNA was measured using the 2200 differentially expressed (DE) genes (DEGs) between the BRD
RNA ScreenTape TapeStation System (Agilent Technologies Inc., and NB samples were ranked by P-value and absolute log2FC.
Cedar Creek, TX, United States) producing RNA integrity (RIN) In total, three different DEG analyses were performed: the
values ranging from 8.0 to 9.8. To prepare the mRNA cDNA total DEGs with read counts from both the BRD and NB
libraries, 1.0 µg of total RNA was used from each sample using animals (total DEGs, n = 43, coef = pen); BRD DEGs (n = 25,
the TruSeq RNA Library Preparation kit v2 (Illumina, San Diego, coef = cluster); and NB DEGs (n = 18, coef = pen). A “cluster”
CA, United States). Poly A-containing mRNA was enriched coefficient was also added for the BRD animals representing the
from the total RNA using poly-T oligo attached beads and three subgroups of the BRD samples differentiated by principal
fragmented for first-strand cDNA synthesis, followed by second- component analysis (PCA) determination of clustered samples
strand synthesis. The ends were repaired, and 30 end adenylation (Cluster; n = 3).
Frontiers in Genetics | www.frontiersin.org 3 March 2021 | Volume 12 | Article 627623Jiminez et al. Differential Gene Expression in BRD
Ingenuity Pathway Analysis BRD cattle were separated from the NB profiles with 54% of the
Network and pathway analyses were analyzed using Ingenuity variation attributed to PC1 (Figure 1). Four samples appear as
Pathway Analysis (IPA)1 (Qiagen, 2000–2019) software. This core outliers in the PCA plot: two BRD samples and two NB samples
analysis tool was used to identify gene pathways, disease, and (Figure 1). As might be expected from this result, the number
networks using the gene expression data calculated by EdgeR. of DEGs in the NB group was relatively small (n = 33 DEGs;
Input files of expression data included DEGs from all animals total transcripts = 11, 787), whereas thousands of DEGs were
(n = 43) and the BRD-only animals (n = 25). identified within the BRD samples, which had a total of 13,404
transcripts identified.
Statistical Analyses
Statistical analysis used the R software package. P-values ≤ 0.05
Identification of the Differentially
were used to indicate significance, while false discovery rate Expressed Genes Between Bovine
(FDR) values were set at 0.05 for the adjusted P-values, unless Respiratory Disease and Non-bovine
otherwise stated. Both EdgeR and IPA incorporate statistical Respiratory Disease Animals
analyses into their analysis packages, and those values were To investigate the host response due to BRD infection, the top
reported. For ADG, rectal temperatures, and DOF, a Wilcoxon ranked DEGs were identified by comparing the DEGs between
rank sum test with continuity correction was used to compare the NB and BRD samples. Table 1 shows the genes with the
the BRD and NB animal values in the Dplyr package. highest logFC values using the NB animal expression as the
reference. Major immune genes such as interleukin (IL)1 receptor
2 (IL1R2), complement factor B (CFB), and IL3 receptor subunit
RESULTS alpha (IL3RA) were identified in the top 10 upregulated DEGs,
with TNF alpha induced protein 6 (TNFAIP6) and IL12B evident
Confirmation of Disease Status in the top 30 upregulated DEGs. Furthermore, haptoglobin (HP),
Forty-four heifers (average arrival weight = 215.0 ± 5.3 kg) were lipocalin (LCN2), serpin peptidase inhibitor (SERPINB4), and
enrolled to the study and were clinically examined and sampled S100 calcium-binding proteins (S100A9 and S100A8) were also
between November 11 and December 11, 2015. Of these, 25 were among the top expressed genes in the BRD animals (Table 1).
classified as BRD positive and 18 were classified as NB based on The top downregulated DEGs when comparing the BRD with NB
clinical examination and serum haptoglobin concentration. One animals (Table 2) belonged to hemoglobin synthesis pathways,
control heifer was removed from the study, as it had a serum including alpha globin (HBA), beta globin (HBB), mu globin
haptoglobin concentration of 3.6 g/L (i.e., ≥0.25 g/L). Heifers (HBM), and aminolevulinic acid synthase (ALAS2). The enriched
with BRD had higher (P < 0.001) average rectal temperatures genes (upregulated in the BRD animals) belong to immune
of 40.6 ± 0.03◦ C, than NB heifers averaging 39.3 ± 0.14◦ C response pathways, as well as gastrointestinal, inflammatory,
(Supplementary Table 1). Furthermore, the ADG in the NB infectious, and respiratory disease pathways (not shown).
heifers was considerably higher (P < 0.001) than in the BRD
heifers, which on average gained less weight (P < 0.001) from the Analysis of Bovine Respiratory Disease
time they arrived to the feedlot to the time they were enrolled in Clusters and Differentially Expressed
the study (Supplementary Table 1).
Genes
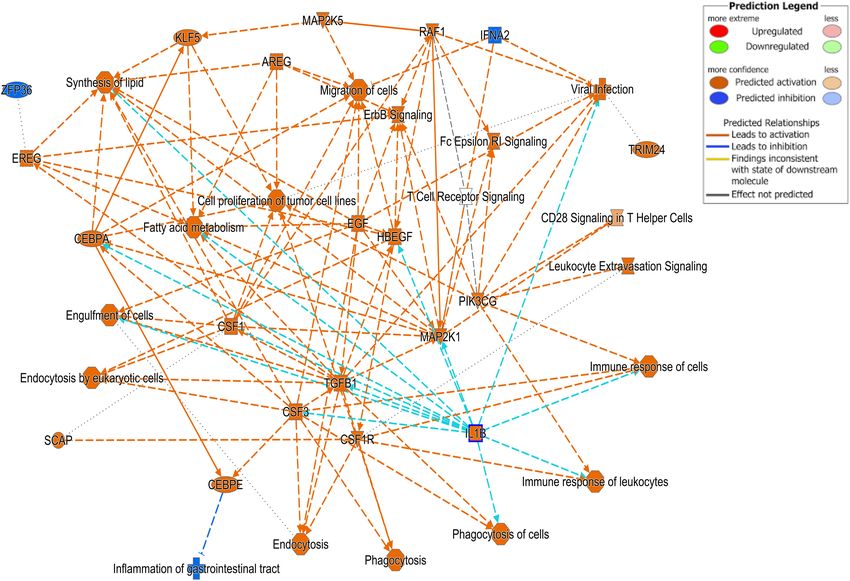
As the BRD samples were more dispersed in the PCA than those
Total Gene Expression Data Summary of from NB (Figure 1), gene expression in the 25 BRD animals
All Bovine Respiratory Disease Animals was investigated further. Three distinct subsets or clusters were
Compared With All Non-bovine identified within the BRD samples (Figure 2). These clusters were
Respiratory Disease Animals not associated with serum haptoglobin level or rectal temperature
A total of 1.51 billion raw reads were generated for the mRNA at clinical examination (Supplementary Table 1).
libraries, and after trimming, an average of 31 M reads per sample Differentially expressed gene values were calculated within
was used for alignment (Supplementary Table 2). The read- the BRD samples (n = 25) and compared with one another for
mapping rates ranged from 75.27 to 92.09%, and on average DEG profile, with cluster used as the coefficient to determine
approximately 25 M reads were uniquely mapped per sample DEGs; log2FC > 2, P-adj < 0.05. A total of 13,404 DEGs
(Supplementary Table 3). In total, EdgeR analysis identified were identified in these samples (Table 2). As Cluster A
11,966 genes, with 3,075 downregulated and 3,236 upregulated appeared to be the most distinct, Cluster A read counts were
when comparing the BRD with NB samples (n = 43) using compared with those in Clusters B and C. With the use of
BRD as the coefficient to determine DEGs; 6,311 total DEG, logFC > 2, P-value < 0.05, P-adj < 0.01, when compared with
log2FC > 2, P-adj < 0.05. To explore the difference between the A, 109 DEGs common to Clusters B and C were identified
expression profiles of the NB and BRD samples, PCA was used (34 upregulated and 74 downregulated). There were 273 DEGs
to analyze the differences and similarities between the samples. unique to Cluster C and 18 to Cluster B when compared
The PCA showed that whole-blood transcriptome profiles of with Cluster A. The top upregulated genes unique to Cluster
B included multidrug resistance protein 4, duodenase-1, and
1
http://www.ingenuity.com trefoil factor 2, while the top downregulated genes were all from
Frontiers in Genetics | www.frontiersin.org 4 March 2021 | Volume 12 | Article 627623Jiminez et al. Differential Gene Expression in BRD FIGURE 1 | Principal component analysis (PCA) plot comparing differences in total differentially expressed (DE) gene populations between bovine respiratory disease (BRD) and non-BRD (NB) animals. PCA plot displaying differing clustering patterns between heifers displaying clinical signs of BRD (blue) and non-BRD animals (red). Plot was designed using normalized counts (n = 43), using the variable stabilization transformation for the PlotPCA tool in DEGSeq. TABLE 1 | Top enriched total differentially expressed (DE) genes identified when comparing all bovine respiratory disease (BRD) with all non-BRD (NB) animals. Gene name Gene description LogFC P-Adjust LRG1 Leucine-rich alpha-2-glycoprotein 1 [Source: VGNC Symbol; Acc: VGNC:30980] 7.84 5.55E-29 SERPINB4 Bos taurus serpin peptidase inhibitor, clade B like (LOC786410), mRNA. [Source: RefSeq mRNA; Acc:NM_001206713] 6.14 1.18E-19 IL1R2 Interleukin 1 receptor type 2 [Source: VGNC Symbol; Acc: VGNC:30132] 5.82 2.71E-20 EREG Epiregulin [Source: VGNC Symbol; Acc: VGNC:28575] 5.37 3.14E-22 THY1 thy-1 cell surface antigen [Source: VGNC Symbol; Acc: VGNC:35856] 5.26 8.05E-20 CFB Complement factor B [Source: NCBI gene; Acc: 514076] 4.74 1.05E-28 DCSTAMP Dendrocyte expressed seven transmembrane protein [Source: VGNC Symbol; Acc: VGNC:27925] 4.25 1.80E-22 BMX BMX non-receptor tyrosine kinase [Source: VGNC Symbol; Acc: VGNC:26529] 4.14 2.65E-30 DPYS Dihydropyrimidinase [Source: VGNC Symbol; Acc: VGNC:28194] 4.11 9.58E-19 IL3RA Interleukin 3 receptor subunit alpha [Source: NCBI gene; Acc: 100299249] 4.10 1.17E-31 ADGRG3 Adhesion G protein-coupled receptor G3 [Source: VGNC Symbol; Acc: VGNC:25667] 4.01 8.40E-37 TNFAIP6 TNF alpha induced protein 6 [Source: VGNC Symbol; Acc: VGNC:36156] 3.64 7.16E-17 MMP9 Matrix metallopeptidase 9 [Source: VGNC Symbol; Acc: VGNC:31531] 3.58 1.94E-14 CLEC1B C-type lectin domain family 1 member B [Source: VGNC Symbol; Acc: VGNC:58366] 3.50 3.98E-13 PLA2G4F Phospholipase A2 group IVF [Source: VGNC Symbol; Acc: VGNC:32962] 3.47 3.30E-25 LCN2 Lipocalin 2 [Source: VGNC Symbol; Acc: VGNC:30814] 3.45 2.62E-15 IL12B Interleukin 12B [Source: VGNC Symbol; Acc: VGNC:30111] 3.45 1.44E-19 S100A9 S100 calcium-binding protein A9 [Source: VGNC Symbol; Acc: VGNC:34247] 3.42 2.30E-21 S100A8 S100 calcium-binding protein A8 [Source: VGNC Symbol; Acc: VGNC:34246] 3.42 2.11E-19 RAB20 RAB20, member RAS oncogene family [Source: NCBI gene; Acc: 615760] 3.33 3.22E-32 HP Haptoglobin [Source: NCBI gene; Acc: 280692] 3.29 2.42E-15 DEFB10 Beta-defensin 10 [Source: NCBI gene; Acc: 100141457] 3.28 2.52E-14 HBB Hemoglobin, beta [Source: NCBI gene; Acc: 280813] −3.74 9.97E-25 ALAS2 50 -Aminolevulinate synthase 2 [Source: VGNC Symbol; Acc: VGNC:25804] −3.80 3.14E-32 HBA2 Hemoglobin, alpha 2 [Source: NCBI gene; Acc: 512439] −4.86 3.14E-22 HBA1 Hemoglobin, alpha 1 [Source: NCBI gene; Acc: 100140149] −4.88 2.13E-22 Frontiers in Genetics | www.frontiersin.org 5 March 2021 | Volume 12 | Article 627623
Jiminez et al.                                                                                                                    Differential Gene Expression in BRD

  FIGURE 2 | Principal component analysis (PCA) displaying clustering of bovine respiratory disease (BRD) samples. Cluster dendrogram identifying groups in the
  BRD population (n = 25) that are similar to one another based on gene expression. The BRD data is further subdivided into three distinct clusters.

TABLE 2 | Summary of differentially expressed (DE) genes between bovine                genes in this comparison include LCN2, S1008A, and CFB,
respiratory disease (BRD) clusters.
                                                                                       with bovine cathelicidin antimicrobial peptide (CAMP) having
                                              Cluster comparison1                      the highest experimental log ratio value as identified through
                                                                                       IPA (Table 6).
Item                                 *B–A              *C–A               *C–B

Total transcripts                   13,404            13,404              13,404
                                                                                       Comparison With Related Studies
↑ Expression                         1,739            3,806                581
                                                                                       In order to determine the validity of our results, finding
↓ Expression                         1,670            3,464               1,472
                                                                                       similarities in gene expression to related studies was also a goal
Total DEG                            3,409            7,270               2,053
                                                                                       of our analysis. Three studies in particular also investigated
No significant changes               9,995            6,134               11,351
                                                                                       gene expression in response to cattle with BRD using the
                                                                                       blood and bronchial lymph node transcriptome. The work
1 Cluster with (*) annotation is upregulated compared with opposite cluster.           done by Johnston et al. (2019) showed similarities to our
Transcripts in B upregulated compared with A. Transcripts in C upregulated when
compared with A. Transcripts in C upregulated when compared with B.
                                                                                       work in the clear separation observed when plotting the gene
                                                                                       expression pattern between control and infected animals, and
                                                                                       also in the identification of genes related to acute phase protein
the keratin family (Table 3). For Cluster C, upregulated genes                         expression (Supplementary Table 4). Additionally, Sun et al.
included cornifin B-like, solute carrier family 6, and serine protease                 (2020) identified enriched expression of genes belonging to heme
50, while thy-1 cell surface antigen and leucine-rich alpha-2-                         biosynthesis, acute phase response signaling, and granzyme B
glycoproteins were downregulated (Table 3). When compared                              signaling, which was also observed in our results (Supplementary
with animals in Cluster B and C, animals in Cluster A showed                           Table 4). Finally, Scott et al. (2020), who also investigated
increased expression of genes encoding bovine antimicrobial                            the blood transcriptome, found similarities with the highly
peptides. Specifically, cathelicidin-2 (CATH2), CATH3, CATH5,                          upregulated genes found here including CATH2, LRG1, and CFB,
and CATH6 were upregulated in Cluster A (Table 4). These genes                         as well as decreased expression of ALOX15 and GZMB.
had high logFC values (>log2), and genes for other antimicrobial
peptides such as enteric beta defensin (EBD) and beta-defensin
4A (DEFB4) were also upregulated in Cluster A, when compared                           DISCUSSION
with those in B and C. Genes downregulated in Cluster A
when compared with Cluster B and C are shown in Table 5.                               Most previous studies investigating BRD have used fluids and
Further analysis using the core analysis function in IPA shows                         tissues located at the main sites of infection for BRD pathogens,
the pathway involved in viral infection as one of the top disease                      such as bronchial lymph nodes (Tizioto et al., 2015; Johnston
pathways according to z-score in the comparison between Cluster                        et al., 2019), lung tissue (Rai et al., 2015; Chen et al., 2016;
A animals with Clusters B and C (Figure 3). The highly activated                       Behura et al., 2017), and lymph fluid (Gershwin et al., 2015), and

Frontiers in Genetics | www.frontiersin.org                                        6                                         March 2021 | Volume 12 | Article 627623
Jiminez et al. Differential Gene Expression in BRD
TABLE 3 | Unique genes of interest in Clusters B and C.
Cluster B Cluster C
Upregulated Downregulated Upregulated Downregulated
LOC521568: Multidrug KRT85: Keratin 85 LOC507527: Cornifin-B-like THY1: thy-1 cell surface antigen
resistance associated protein 4 KRT83: Keratin 83
LOC508858: KRT33B: Keratin, type 1 SLC6A15: Solute carrier family 6 LOC51110: Serpin peptidase
Duodenase 1 cuticular Ha3-I-like ANK1: Ankyrin 1 inhibitor, clade B like
SV2C: Synaptic vesicle KRT33A: Keratin 33A KRT25: Keratin 25 PLIN5: Perilipin 5
glycoprotein PRSS50: Serine protease 50
VSIG2: V-set and KRT86: Keratin 86 ALPL: Alkaline phosphatase,
immunoglobulin domain BOLA-DQB: Major biomineralization associated
containing 2 histocompatibility complex, class II,
TFF2: Trefoil factor 2 DQ beta LRG1: Leucine-rich
alpha-2-glycoprotein
TABLE 4 | Top enriched bovine respiratory disease (BRD) differentially expressed (DE) genes in Cluster A compared with Clusters B and C.
Gene name Gene description LogFC P-Adjust
CATHL2 Cathelicidin 2 [Source: NCBI gene; Acc: 282165] 8.91 1.03E-33
CD177 CD177 molecule [Source: VGNC Symbol; Acc: VGNC:27006] 8.35 1.17E-34
CATHL6 Cathelicidin 6 [Source: NCBI gene; Acc: 317651] 7.71 2.28E-33
CATHL3 Cathelicidin 1 [Source: NCBI gene; Acc: 282164] 7.37 2.77E-26
CATHL5 Cathelicidin 5 [Source: NCBI gene; Acc: 282167] 7.04 1.48E-28
NGP Neutrophilic granule protein-like [Source: NCBI gene; Acc: 788112] 5.77 1.12E-13
LTF Lactotransferrin [Source: VGNC Symbol; Acc: VGNC:31077] 5.57 1.01E-30
MS4A3 Membrane spanning 4-domains A3 [Source: VGNC Symbol; Acc: VGNC:58392] 5.54 1.49E-16
EBD Enteric beta-defensin [Source: NCBI gene; Acc: 281743] 5.42 4.90E-20
ORM1 Orosomucoid 1 [Source: NCBI gene; Acc: 497200] 5.10 2.85E-23
DEFB4A Defensin, beta 4A [Source: NCBI gene; Acc: 286836] 5.01 4.34E-20
PGLYRP1 Peptidoglycan recognition protein 1 [Source: VGNC Symbol; Acc: VGNC:32791] 5.01 6.43E-29
MMP8 Matrix metallopeptidase 8 [Source: VGNC Symbol; Acc: VGNC:31530] 5.00 2.50E-18
CCL14 Chemokine (C-C motif) ligand 14 [Source: NCBI gene; Acc: 616723] 4.57 1.16E-22
FLT4 fms related tyrosine kinase 4 [Source: VGNC Symbol; Acc: VGNC:29044] 4.51 9.30E-13
EFNB2 Ephrin B2 [Source: VGNC Symbol; Acc: VGNC:28360] 4.34 2.04E-23
IL1R2 Interleukin 1 receptor type 2 [Source: VGNC Symbol; Acc: VGNC:30132] 4.32 8.21E-16
MMP27 Matrix metallopeptidase 27 [Source: VGNC Symbol; Acc: VGNC:54886] 4.25 8.38E-08
RETN Resistin [Source: VGNC Symbol; Acc: VGNC:33877] 4.13 1.63E-18
FOLR3 Folate receptor 3 [Source: NCBI gene; Acc: 516067] 4.07 6.08E-07
HSPG2 Heparan sulfate proteoglycan 2 [Source: VGNC Symbol; Acc: VGNC:29988] 3.82 2.72E-22
LCN2 Lipocalin 2 [Source: VGNC Symbol; Acc: VGNC:30814] 3.75 6.71E-18
MMP9 Matrix metallopeptidase 9 [Source: VGNC Symbol; Acc: VGNC:31531] 3.65 2.20E-12
TMEM217 Transmembrane protein 217 [Source: VGNC Symbol; Acc: VGNC:36039] 3.53 2.21E-16
LBP Lipopolysaccharide-binding protein [Source: VGNC Symbol; Acc: VGNC:56192] 3.48 4.27E-10
RAB3IL1 RAB3A interacting protein like 1 [Source: VGNC Symbol; Acc: VGNC:33655] 3.46 2.11E-09
ALOX5 Arachidonate 5-lipoxygenase [Source: VGNC Symbol; Acc: VGNC:25844] 3.34 3.28E-13
SERPINB2 Serpin family B member 2-like [Source: NCBI gene; Acc: 281376] 3.29 7.61E-11
BPI Bactericidal permeability increasing protein [Source: NCBI gene; Acc: 280734] 3.20 6.12E-08
CCL24 C-C motif chemokine ligand 24 [Source: VGNC Symbol; Acc: VGNC:26950] 3.18 5.34E-10
ITGA9 Integrin subunit alpha 9 [Source: VGNC Symbol; Acc: VGNC:30320] 3.18 4.25E-13
RGL1 Ral guanine nucleotide dissociation stimulator like 1 [Source: VGNC Symbol; Acc: VGNC:33903] 3.13 1.13E-19
EREG Epiregulin [Source: VGNC Symbol; Acc: VGNC:28575] 3.11 6.57E-12
SERPINB4 Bos taurus serpin peptidase inhibitor, clade B like (LOC786410), mRNA. [Source: RefSeq mRNA; Acc: NM_001206713] 3.07 1.15E-06
have reported various immune-related genes enriched at each (Lindholm-Perry et al., 2018; Scott et al., 2020) use RNA extracted
site of infection. In addition, these studies have collected these from blood for gene expression analysis despite the relative
fluids and tissues at postmortem examination. Only a few studies ease of its sampling from live animals. We therefore applied
Frontiers in Genetics | www.frontiersin.org 7 March 2021 | Volume 12 | Article 627623Jiminez et al. Differential Gene Expression in BRD TABLE 5 | Genes downregulated in Cluster A when compared with Clusters B and C. Gene name Gene description LogFC P-Adjust TAC3 Tachykinin 3 [Source: VGNC Symbol; Acc: VGNC:35556] −5.16 7.22E-08 LOC100139881 Mast cell protease 2 [Source: NCBI gene; Acc: 100139881] −3.76 4.82E-05 FOLH1B Folate hydrolase 1B [Source: NCBI gene; Acc: 505865] −3.52 5.78E-03 LOC100847119 Immunoglobulin lambda-1 light chain-like [Source: NCBI gene; Acc: 100847119] −3.48 4.12E-04 NRIP3 Nuclear receptor interacting protein 3 [Source: VGNC Symbol; Acc: VGNC:32264] −3.30 4.99E-04 LARP6 La ribonucleoprotein domain family member 6 [Source: VGNC Symbol; Acc: VGNC:30793] −3.06 3.09E-07 BREH1 Retinyl ester hydrolase type 1 [Source: NCBI gene; Acc: 497207] −2.95 1.30E-08 GABRD Gamma-aminobutyric acid type A receptor delta subunit [Source: VGNC Symbol; Acc: VGNC:29198] −2.91 2.94E-05 SEMA3G Semaphorin 3G [Source: VGNC Symbol; Acc: VGNC:34432] −2.82 1.72E-09 KLHDC8A Kelch domain containing 8A [Source: VGNC Symbol; Acc: VGNC:30639] −2.79 1.07E-08 ADGRA1 Adhesion G protein-coupled receptor A1 [Source: VGNC Symbol; Acc: VGNC:55933] −2.79 2.59E-06 PRG3 Proteoglycan 3 [Source: NCBI gene; Acc: 617374] −2.75 1.68E-02 WNT5A Wnt family member 5A [Source: VGNC Symbol; Acc: VGNC:36960] −2.73 2.99E-06 GATA2 GATA-binding protein 2 [Source: VGNC Symbol; Acc: VGNC:29266] −2.68 1.51E-04 GZMB Granzyme B (granzyme 2, cytotoxic T-lymphocyte-associated serine esterase 1) [Source: NCBI gene; Acc: 281731] −2.65 7.07E-04 KCNIP3 Potassium voltage-gated channel interacting protein 3 [Source: NCBI gene; Acc: 513316] −2.61 2.09E-12 WC1.1 Antigen WC1.1 [Source: NCBI gene; Acc: 786796] −2.59 1.58E-06 GCSAML Germinal center associated signaling and motility like [Source: HGNC Symbol; Acc: HGNC:29583] −2.56 3.99E-04 PRRS50 Serine protease 50 [Source: NCBI gene; Acc: 518845] −2.49 2.03E-05 CD163L1 CD163 molecule-like 1 [Source: NCBI gene; Acc: 338056] −2.49 9.03E-11 TGFB2 Transforming growth factor beta 2 [Source: VGNC Symbol; Acc: VGNC:35802] −2.48 7.07E-04 CD1E CD1e molecule [Source: VGNC Symbol; Acc: VGNC:27008] −2.45 1.74E-04 CXCL12 C-X-C motif chemokine ligand 12 [Source: VGNC Symbol; Acc: VGNC:27848] −2.44 6.06E-12 LY6G6C Lymphocyte antigen 6 family member G6C [Source: VGNC Symbol; Acc: VGNC:31090] −2.43 8.71E-09 KCNQ4 Potassium voltage-gated channel subfamily Q member 4 [Source: VGNC Symbol; Acc: VGNC:30489] −2.40 4.37E-08 SLC6A15 Solute carrier family 6 member 15 [Source: VGNC Symbol; Acc: VGNC:34918] −2.39 1.71E-02 BOLA-DQB Major histocompatibility complex, class II, DQ beta [Source: NCBI gene; Acc: 282495] −2.38 7.68E-03 CYGB Cytoglobin [Source: VGNC Symbol; Acc: VGNC:50268] −2.36 7.37E-08 ANK1 Ankyrin 1 [Source: NCBI gene; Acc: 353108] −2.35 5.22E-03 RTN4RL1 Reticulon 4 receptor like 1 [Source: VGNC Symbol; Acc: VGNC:34207] −2.34 4.80E-08 ENPP1 Ectonucleotide pyrophosphatase/phosphodiesterase 1 [Source: VGNC Symbol; Acc: VGNC:28504] −2.33 3.33E-08 CHCHD6 Coiled-coil-helix-coiled-coil-helix domain containing 6 [Source: VGNC Symbol; Acc: VGNC:27274] −2.33 3.33E-08 HRH4 Histamine receptor H4 [Source: VGNC Symbol; Acc: VGNC:29956] −2.33 8.85E-07 a functional genomics approach to investigate changes in the modulating bacterial infection and contributes to the progression whole-blood transcriptome, making two different comparisons; of lung disease (Roehrig et al., 2006; Ali et al., 2017). During the first examined the difference in gene expression between all bacterial infection, neutrophils maintain iron homeostasis by the BRD and NB animals, while the second explored the larger releasing LCN2 and lactoferrin (LTF) to sequester free iron variation observed among the BRD animals. (Ali et al., 2017) and protect the lung from oxidative stress As anticipated, we found that gene expression profiles in whole induced by iron and HBA and HBB molecules (Tubsuwan blood varied between animals diagnosed with BRD and those not et al., 2011). Furthermore, LCN2 decreases iron availability exhibiting clinical signs of BRD. Analysis of the differential gene to limit the growth of pathogenic bacteria (Xiao et al., 2017; expression between phenotypically healthy cattle (NB) and those Pokorska et al., 2019). Pasteurella multocida express outer with BRD showed that, as with the tissues at infection sites, the membrane protein receptors for iron-binding proteins, and major pathways activated in cattle with BRD were also associated the expression of these proteins increases during conditions with the host immune response. of iron restriction (Prado et al., 2005). Animals with BRD The BRD animals also had lower expression of genes involved show decreased expression of genes for hemoglobin and iron- in hemoglobin synthesis. For example, HBA1, HBA2, HBB, and binding proteins and regulators and an increase in genes ALAS2 were all downregulated in the BRD animals. These for iron maintenance proteins (i.e., LCN2 and LTF) that are genes are involved in erythropoiesis and are regulated by released from neutrophils as a response to infection. In both iron availability (Chiabrando et al., 2014). Iron homeostasis comparisons of gene expression (BRD vs. NB and within the is involved in oxygen transport, cellular respiration, and BRD animals), LCN2 expression was increased while in the BRD metabolic processes (Ali et al., 2017). The regulation of vs. NB comparison, expression of genes encoding iron-binding iron concentration in blood also plays an important role in proteins was lowered. Frontiers in Genetics | www.frontiersin.org 8 March 2021 | Volume 12 | Article 627623
Jiminez et al.                                                                                                                     Differential Gene Expression in BRD

  FIGURE 3 | Ingenuity Pathway Analysis (IPA). Cell signaling pathways involved in the viral response pathway identified as one of the top disease pathways according
  to z-score in the comparison between Cluster A animals and Clusters B and C.

   Bovine respiratory disease is multifactorial (Taylor et al.,                       with previous investigations. For example, S100A8, S100A9, and
2010), and etiological diagnosis of BRD is difficult if not                           matrix metallopeptidase 9 were highly expressed in all of the
impossible to reach in a field setting (Pardon and Buczinski,                         specific challenges independent of pathogen (Rai et al., 2015;
2020). Major BRD pathogens such as Mannheimia haemolytica,                            Tizioto et al., 2015). An increase in expression of S100A8
P. multocida, Haemophilus somnus, or Mycoplasma bovis can                             and S100A9 is also associated with toll-like receptor 4 (TLR4)
be isolated from both healthy and sick animals (Angen et al.,                         binding (Wang et al., 2016). TLR4 forms complexes that lead
2009; Timsit et al., 2017, 2018). Furthermore, multiple BRD                           to recruitment of members of IL1 receptor signaling to sites
pathogens (i.e., viruses and bacteria) are often detected at the                      of infection (Bhattacharyya et al., 2013). Interestingly we also
same time in the same animal (Angen et al., 2009; Fulton et al.,                      found upregulation of IL1R2 and IL1RAP in the blood of the
2009), and it is impossible to determine which ones are causing                       BRD animals. Expression of IL1 and IL1RAP become elevated
lung lesions and associated clinical signs without performing                         in the host when intracellular pathogens are present (Peters
a postmortem examination (Fulton and Confer, 2012). This                              et al., 2013), and both viral and bacterial pathogens can often
explains why identification of the individual microbial and viral                     increase the expression of this cytokine to promote a cytotoxic
species was not performed in this study.                                              T cell-mediated response. We also found increased expression of
   Although identification of the individual microbial and viral                      SERPINB4, which encodes a protein located in the skin, mucous
species was not performed in this study, we may be able to                            membranes, and respiratory system to prevent pathogens from
infer what agents were present by comparing the gene expression                       crossing epithelial barriers (Geiger et al., 2015).
results with those from specific challenge studies. For example,                         A second comparison analyzed the differences within the BRD
Tizioto et al. (2015) performed single pathogen challenges with                       samples and compared the differences between the identified
the common pathogens in the BRD complex and examined                                  clusters. Expression of several genes encoding antimicrobial
gene expression in bronchial lymph nodes of these animals                             peptides was increased in Cluster A compared with Clusters
(Tizioto et al., 2015). The patterns of enriched genes in the blood                   B and C. These included the genes such as LTF, and
transcriptome in this study share similar gene characteristics                        several encoding cathelicidins (CATH2, CATH3, CATH5, and

Frontiers in Genetics | www.frontiersin.org                                       9                                           March 2021 | Volume 12 | Article 627623
Jiminez et al. Differential Gene Expression in BRD TABLE 6 | Ingenuity Pathway Analysis (IPA) list of genes predicted to affect viral infection in Cluster A compared with B and C. ID Genes in dataset Prediction Expr log ratio Findings ENSBTAG00000024852 CAMP Affected 8.561 Affects (1) ENSBTAG00000001292 LTF Affected 4.952 Affects (6) ENSBTAG00000002635 PGLYRP1 Affected 4.617 Affects (1) ENSBTAG00000016991 EFNB2© Increased 4.548 Increases (4) ENSBTAG00000017294 ORM1 Affected 4.39 Affects (1) ENSBTAG00000004716 RETN Increased 3.478 Increases (2) ENSBTAG00000014149 LCN2 Increased 3.092 Increases (3) ENSBTAG00000020676 MMP9 Affected 2.699 Affects (9) ENSBTAG00000014046 BPI Affected 2.617 Affects (1) ENSBTAG00000020319 ALOX5 Affected 2.536 Affects (3) ENSBTAG00000017866 CD36 Increased 2.528 Increases (7) ENSBTAG00000006354 HP Affected 2.511 Affects (1) ENSBTAG00000005952 CEBPE Affected 2.251 Affects (1) ENSBTAG00000008059 CHRM3 Affected 2.106 Affects (3) ENSBTAG00000048591 THBD Affected 2.057 Affects (2) ENSBTAG00000007169 P2RX1 Increased 2.052 Increases (2) ENSBTAG00000039050 P2RY2 Increased 2.051 Increases (1) ENSBTAG00000008951 ALPL Affected 1.991 Affects (3) ENSBTAG00000001034 IL18R1 Decreased 1.966 Decreases (2) ENSBTAG00000012640 S100A8 Increased 1.932 Increases (4) ENSBTAG00000021994 CACNA2D4 Affected 1.908 Affects (3) ENSBTAG00000046152 MGAM Affected 1.883 Affects (1) ENSBTAG00000054057 NRG1 Affected 1.817 Affects (1) ENSBTAG00000053072 EFHC2 Increased 1.78 Increases (1) ENSBTAG00000014906 VCAN Affected 1.764 Affects (1) ENSBTAG00000040151 GCH1 Affected 1.723 Affects (1) ENSBTAG00000038490 CLEC4A Increased 1.593 Increases (22) ENSBTAG00000012019 IRS2 Affected 1.544 Affects (1) ENSBTAG00000020580 TCN1 Affected 1.538 Affects (1) ENSBTAG00000046158 CFB Increased 1.519 Increases (2) ENSBTAG00000018517 VLDLR Increased 1.499 Increases (1) ENSBTAG00000006505 S100A9 Increased 1.489 Increases (6) ENSBTAG00000019059 ATG16L2 Increased 1.487 Increases (2) ENSBTAG00000012185 CLEC4E Affected 1.474 Affects (1) ENSBTAG00000038048 MRC1 Increased 1.471 Increases (1) ENSBTAG00000016414 VDR Increased 1.468 Increases (27) ENSBTAG00000010763 DUSP16 Increased 1.468 Increases (2) ENSBTAG00000014636 ZFHX3 Affected 1.428 Affects (1) ENSBTAG00000006817 CBL Decreased 1.417 Decreases (3) ENSBTAG00000016206 MAOA Affected 1.413 Affects (1) ENSBTAG00000012052 PADI4 Increased 1.401 Increases (2) ENSBTAG00000008592 FCGR1A Decreased 1.382 Decreases (13) ENSBTAG00000047338 DCBLD1 Increased 1.327 Increases (1) ENSBTAG00000018255 ACTN1 Affected 1.318 Affects (1) ENSBTAG00000047238 ITGAM Increased 1.318 Increases (2) ENSBTAG00000045565 NHSL2 Affected 1.316 Affects (1) ENSBTAG00000013201 ALOX5AP Affected 1.295 Affects (1) ENSBTAG00000012638 S100A12 Increased 1.264 Increases (3) © 2000–2021 QIAGEN. All rights reserved. Bolded rows identify genes predicted to have increased activity using the IPA analysis. CATH6). LTF functions as an antimicrobial molecule but Cathelicidins are defined as host defense peptides that are also has immunomodulatory qualities (Drago-Serrano et al., highly expressed in bovine granulocytes and located at mucosal 2017), suggesting a potential therapeutic role for this protein. surfaces in the lungs, lymphoid tissues, and intestines of the Frontiers in Genetics | www.frontiersin.org 10 March 2021 | Volume 12 | Article 627623
Jiminez et al.                                                                                                   Differential Gene Expression in BRD

host (Baumann et al., 2017). Expression of four of the seven              response (Tschopp et al., 2006), and it is one of the
known bovine cathelicidin genes, CATH2, 3, 5, and 6, was                  most potent cytokines with the longest duration of action
increased in the BRD animals. These peptides have been detected           (Tschopp et al., 2006). Therefore, the decreased expression
and isolated from sick animals and are generally not present              of GZMB suggests that the animals in Cluster A had a
in healthy tissues (Tomasinsig et al., 2002). Therefore, their            lowered host immune response to infection than the animals in
identification as the top genes with the greatest fold-change             Clusters B and C.
increases in the BRD Cluster A suggests a strong host immune
response in this group of affected animals. It has also been
reported that M. haemolytica causes the induction of bovine
beta-defensins, especially in animals with subacute and chronic
                                                                          CONCLUSION
infection (Fales-Williams et al., 2002), and we observed enteric          In conclusion, the results suggest that the blood transcriptome
beta-defensin as well as beta-defensin 4A among the top expressed         provides a useful resource to investigate the biology of BRD
genes in the BRD animals. It can be concluded that the                    in feedlot cattle. The whole-blood transcriptome may only give
expression of these defensin genes is indicative of chronic               a general overview of the health status, e.g., severe infection
infection (Bhattacharyya et al., 2013) or simply the result of the        from a systemic immune response compared with that from
host defense response stimulating helper T cell type 1 (TH1)              the response reported in tissues at the site of infection.
and helper T cell type 2 (TH2) responses to help clear infection          However, results from the BRD subsets (Clusters A, B, and C)
(Gurao et al., 2017).                                                     do show some similarities with gene expression results using
   The overall abundance of gamma delta T cells in ruminants              tissue and fluids isolated directly from the sites of infection,
is higher than in other species, and in non-ruminants, this               as well as other studies that also used RNA sequencing to
cell subset has been associated with increasing production of             identify BRD in tissues and blood. Analysis of the pathogens
TH2 cytokines (Plattner and Hostetter, 2011). Although this               present in the sampled animals may allow this commonality
association has not been observed in ruminants, it has been               to be explored further. For example, it may be that specific
reported that a CD163 relative, Workshop Cluster 1 (WC1), plays           pathways and genes expressed in whole blood are associated
an important role in gamma delta T cell regulation in cattle              with individual pathogens, which could assist in directing
(Herzig et al., 2010; Plattner and Hostetter, 2011), especially           targeted therapeutic treatments. Such transcriptome data may
in young calves. This T cell subset also facilitates protective           also provide information on potential therapeutic targets for
immunity following vaccinations (Davis et al., 1996; Guzman               BRD infection. Investigation of the WC1+ cell subset and
et al., 2012) and has been described to be involved in increased          cathelicidin antimicrobial peptides could be useful in this respect.
expression of major histocompatibility complex (MHC) class II             Gene expression analysis of whole blood from BRD and NB
on WC1+ cells through interaction with dendritic cells during             cases provides new insights for understanding host response to
Mycobacterium bovis infection (Price and Hope, 2009). When                infection and suggests that there is significant value in using
comparing Cluster A with Clusters B and C, expression of                  blood for BRD studies. This approach is supported by recent
WC1, WC1.1, WC1.3, and WC1-12 was significantly decreased                 results obtained by Scott et al. (2020) as well as Sun et al.
in Cluster A. Animals in Cluster A showed lowered expression              (2020); however, in the future, we could increase the validity of
of WC1 genes that directly promote antigen presentation and               our findings by screening more animals for the genes identified
regulation of alpha beta T cells and CD4/CD8 antigens on WC1+             in this study using qPCR. Furthermore, genes upregulated in
T cells (Ackermann et al., 2010). This suggests that the BRD              healthy animals may also be related to protective mechanisms
animals in Cluster A were displaying lower antigen presentation           that reduce an individual’s susceptibility to BRD, and this
and T cell regulation, suggesting that they may have been infected        warrants further investigation, as our findings put genes related to
with a greater pathogen load that hinders the host immune                 leukotriene biosynthesis and granzyme expression into this class
response in comparison with that in the animals in Clusters B             of protective genes.
and C. Furthermore, as there was also an increase in the host
antimicrobial response in Cluster A, these animals may also have
had a unique pathogen subset leading to BRD than the animals in
Clusters B and C.                                                         DATA AVAILABILITY STATEMENT
   Animals in Cluster A also exhibited a decrease in the
expression of GZMB, which has many established roles in                   The RNAseq data are available at NCBI Gene Expression
stimulating the cytotoxic T cell response and limiting viral              Omnibus (GEO) database under accession number GSE162156.
replication in the host (Johnston et al., 2019). Granzyme B,
in addition to leukotriene C4, IL4, and IL13, are involved
in mediating allergic and asthmatic reactions in humans                   ETHICS STATEMENT
(Plattner and Hostetter, 2011). Basophil granulocytes are
the major effector molecules in a TH2 immune response                     The animal study was reviewed and approved by University of
and are the source for leukotriene C4, IL4, and IL13. IL3                 Calgary Veterinary Sciences Animal Care Committee, AC15-
specifically leads to the synthesis of GZMB and contributes               0109. Written informed consent was obtained from the owners
to the basophil granule population in the TH2 immune                      for the participation of their animals in this study.

Frontiers in Genetics | www.frontiersin.org                          11                                     March 2021 | Volume 12 | Article 627623
Jiminez et al. Differential Gene Expression in BRD
AUTHOR CONTRIBUTIONS of the AMR–One Health Consortium, funded by the Major
Innovation Fund Program of the Alberta Ministry of Economic
GP, ET, and KO designed the project and obtained the funding. Development, Trade and Tourism.
ET designed the field trial and collected the samples. JJ
prepared and analyzed the sequencing data. LG provided advice
on RNAseq analysis. GP, JJ, and ET interpreted the results ACKNOWLEDGMENTS
and drafted the manuscript. All authors contributed to the
writing and revisions of the manuscript and approved the JJ thanks Eoin O’Hara and Arun Kommadath for help with
final manuscript. transcriptomic analyses. GP acknowledges the support of
Alberta Innovates.
FUNDING
This publication is the result of research supported by the SUPPLEMENTARY MATERIAL
“Genomic Approaches to the Control of Bovine Respiratory
Disease Complex (BRDC)” Grant, provided by Genome Alberta, The Supplementary Material for this article can be found
Calgary, AB, Canada, through the Applied Livestock Genomics online at: https://www.frontiersin.org/articles/10.3389/fgene.
Program 2014, project code A222. This research is also part 2021.627623/full#supplementary-material
REFERENCES TcR. Vet. Immunol. Immunopathol. 52, 275–283. doi: 10.1016/0165-2427(96)05
578-X
Ackermann, M. R., Derscheid, R., and Roth, J. A. (2010). Innate immunology of Dobin, A., Davis, C. A., Schlesinger, F., Drenkow, J., Zaleski, C., Jha, S., et al.
bovine respiratory disease. Vet. Clin. North Am. Food Anim. Pract. 26, 215–228. (2013). STAR: ultrafast universal RNA-seq aligner. Bioinformatics 29, 15–21.
doi: 10.1016/j.cvfa.2010.03.001 doi: 10.1093/bioinformatics/bts635
Aich, P., Babiuk, L. A., Potter, A. A., and Griebel, P. (2009). Biomarkers for Drago-Serrano, M. E., Campos-Rodríguez, R., Carrero, J. C., and de la Garza, M.
prediction of bovine respiratory disease outcome. Omi. A J. Integr. Biol. 13, (2017). Lactoferrin: balancing ups and downs of inflammation due to microbial
199–209. doi: 10.1089/omi.2009.0012 infections. Int. J. Mol. Sci. 18:501. doi: 10.3390/ijms18030501
Ali, M. K., Kim, R. Y., Karim, R., Mayall, J. R., Martin, K. L., Shahandeh, A., et al. Fales-Williams, A. J., Gallup, J. M., Ramírez-Romero, R., Brogden, K. A., and
(2017). Role of iron in the pathogenesis of respiratory disease. Int. J. Biochem. Ackermann, M. R. (2002). Increased anionic peptide distribution and intensity
Cell Biol. 88, 181–195. doi: 10.1016/j.biocel.2017.05.003 during progression and resolution of bacterial pneumonia. Clin. Diagn Lab.
Angen, O., Thomsen, J., Larsen, L. E., Larsen, J., Kokotovic, B., Heegaard, P. M. H., Immunol. 9, 28L–32L. doi: 10.1128/CDLI.9.1.28-32.2002
et al. (2009). Respiratory disease in calves: microbiological investigations Fulton, R. W., and Confer, A. W. (2012). Laboratory test descriptions for bovine
on trans-tracheally aspirated bronchoalveolar fluid and acute phase protein respiratory disease diagnosis and their strengths and weaknesses: gold standards
response. Vet. Microbiol. 137, 165–171. doi: 10.1016/j.vetmic.2008.12.024 for diagnosis, do they exist? Can. Vet. J. 53, 754–761.
Babcock, A. H., Renter, D. G., White, B. J., Dubnicka, S. R., and Scott, H. M. (2010). Fulton, R. W., Blood, K. S., Panciera, R. J., Payton, M. E., Ridpath, J. F., Confer,
Temporal distributions of respiratory disease events within cohorts of feedlot A. W., et al. (2009). Lung pathology and infectious agents in fatal feedlot
cattle and associations with cattle health and performance indices. Prev. Vet. pneumonias and relationship with mortality, disease onset, and treatments.
Med. 97, 198–219. doi: 10.1016/J.PREVETMED.2010.09.003 J. Vet. Diagn. Invest. 21, 464–477. doi: 10.1177/104063870902100407
Baumann, A., Kiener, M. S., Haigh, B., Perreten, V., and Summerfield, A. (2017). Geiger, M., Wahlmüller, F., and Furtmüller, M. (eds). (2015). The Serpin Family:
Differential ability of bovine antimicrobial cathelicidins to mediate nucleic Proteins with Multiple Functions in Health and Disease. Cham: Springer. doi:
acid sensing by epithelial cells. Front. Immunol. 8:59. doi: 10.3389/fimmu.2017. 10.1007/978-3-319-22711-5
00059 Gershwin, L. J., Van Eenennaam, A. L., Anderson, M. L., McEligot, H. A., Shao,
Behura, S. K., Tizioto, P. C., Kim, J., Grupioni, N. V., Seabury, C. M., Schnabel, M. X., Toaff-Rosenstein, R., et al. (2015). Single pathogen challenge with agents
R. D., et al. (2017). Tissue tropism in host transcriptional response to members of the bovine respiratory disease complex. PLoS One 10:e0142479. doi: 10.1371/
of the bovine respiratory disease complex. Sci. Rep. 7:17938. doi: 10.1038/ journal.pone.0142479
s41598-017-18205-0 Gurao, A., Kashyap, S. K., and Singh, R. (2017). β-defensins: an innate defense for
Bhattacharyya, S., Kelley, K., Melichian, D. S., Tamaki, Z., Fang, F., Su, Y., et al. bovine mastitis. Vet. World 10, 990–998. doi: 10.14202/vetworld.2017.990-998
(2013). Toll-like receptor 4 signaling augments transforming growth factor- Guzman, E., Price, S., Poulsom, H., and Hope, J. (2012). Bovine γδ T cells:
β responses: a novel mechanism for maintaining and amplifying fibrosis in cells with multiple functions and important roles in immunity. Vet. Immunol.
scleroderma. Am. J. Pathol. 182, 192–205. doi: 10.1016/j.ajpath.2012.09.007 Immunopathol. 148, 161–167. doi: 10.1016/J.VETIMM.2011.03.013
Caswell, J. L. (2014). Failure of respiratory defenses in the pathogenesis Herzig, C. T., Waters, R. W., Baldwin, C. L., and Telfer, J. C. (2010). Evolution of the
of bacterial pneumonia of cattle. Vet. Pathol. 51, 393–409. doi: 10.1177/ CD163 family and its relationship to the bovine gamma delta T cell co-receptor
0300985813502821 WC1. BMC Evol. Biol. 10:181. doi: 10.1186/1471-2148-10-181
CCAC (2009). CCAC Guidelines on: The Care and Use of Farm Animals in Research, Johnston, D., Earley, B., McCabe, M. S., Lemon, K., Duffy, C., McMenamy, M.,
Teaching, and Testing. Available online at: https://www.ccac.ca/Documents/ et al. (2019). Experimental challenge with bovine respiratory syncytial virus in
Standards/Guidelines/Farm_Animals.pdf (accessed November 1, 2020). dairy calves: bronchial lymph node transcriptome response. Sci. Rep. 9, 1–13.
Chen, J., Yang, C., Tizioto, P. C., Huang, H., Lee, M. O. K., Payne, H. R., et al. (2016). doi: 10.1038/s41598-019-51094-z
Expression of the bovine NK-Lysin gene family and activity against respiratory Kawayama, T., Kinoshita, T., Matsunaga, K., Kobayashi, A., Hayamizu, T.,
pathogens. PLoS One 11:e0158882. doi: 10.1371/journal.pone.0158882 Johnson, M., et al. (2016). Responsiveness of blood and sputum inflammatory
Chiabrando, D., Mercurio, S., and Tolosano, E. (2014). Heme and erythropoieis: cells in Japanese COPD patients, non-COPD smoking controls, and non-COPD
more than a structural role. Haematologica 99, 973–983. doi: 10.3324/haematol. nonsmoking controls. Int. J. Chron. Obstruct. Pulmon. Dis. 11, 295–303. doi:
2013.091991 10.2147/COPD.S95686
Davis, W. C., Brown, W. C., Hamilton, M. J., Wyatt, C. R., Orden, J. A., Khalid, Lindholm-Perry, A. K., Kuehn, L. A., McDaneld, T. G., Miles, J. R., Workman,
A. M., et al. (1996). Analysis of monoclonal antibodies specific for the γδ A. M., Chitko-Mckown, C. G., et al. (2018). Complete blood count data and
Frontiers in Genetics | www.frontiersin.org 12 March 2021 | Volume 12 | Article 627623You can also read