Weakly supervised end to end artificial intelligence in gastrointestinal endoscopy - Nature
←
→
Page content transcription
If your browser does not render page correctly, please read the page content below
www.nature.com/scientificreports
OPEN Weakly supervised end‑to‑end
artificial intelligence
in gastrointestinal endoscopy
Lukas Buendgens1, Didem Cifci1, Narmin Ghaffari Laleh1, Marko van Treeck1,
Maria T. Koenen1,2, Henning W. Zimmermann1, Till Herbold3, Thomas Joachim Lux4,
Alexander Hann4, Christian Trautwein1 & Jakob Nikolas Kather1,5,6*
Artificial intelligence (AI) is widely used to analyze gastrointestinal (GI) endoscopy image data. AI
has led to several clinically approved algorithms for polyp detection, but application of AI beyond
this specific task is limited by the high cost of manual annotations. Here, we show that a weakly
supervised AI can be trained on data from a clinical routine database to learn visual patterns of GI
diseases without any manual labeling or annotation. We trained a deep neural network on a dataset of
N = 29,506 gastroscopy and N = 18,942 colonoscopy examinations from a large endoscopy unit serving
patients in Germany, the Netherlands and Belgium, using only routine diagnosis data for the 42 most
common diseases. Despite a high data heterogeneity, the AI system reached a high performance
for diagnosis of multiple diseases, including inflammatory, degenerative, infectious and neoplastic
diseases. Specifically, a cross-validated area under the receiver operating curve (AUROC) of above 0.70
was reached for 13 diseases, and an AUROC of above 0.80 was reached for two diseases in the primary
data set. In an external validation set including six disease categories, the AI system was able to
significantly predict the presence of diverticulosis, candidiasis, colon and rectal cancer with AUROCs
above 0.76. Reverse engineering the predictions demonstrated that plausible patterns were learned
on the level of images and within images and potential confounders were identified. In summary, our
study demonstrates the potential of weakly supervised AI to generate high-performing classifiers and
identify clinically relevant visual patterns based on non-annotated routine image data in GI endoscopy
and potentially other clinical imaging modalities.
Artificial intelligence (AI) with deep convolutional neural networks has transformed image analysis in medi-
cine. While diagnosing diseases from image data was for decades the unquestioned territory of highly trained
domain experts, in 2017, the first application of deep learning in medical routine images changed this conception
fundamentally1. Clinically relevant tasks are now being solved by AI across multiple data modalities in medicine,
including dermatoscopy2, histopathology3, radiology4 and e ndoscopy5. These AI systems are expected to trans-
form patient care and provide improved outcomes for patients and resource savings for the healthcare system in
the future6. In particular, AI is expected to have a profound effect on diagnosis and treatment of diseases of the
gastrointestinal (GI) tract, including cancer of the gut and liver7,8, inflammatory diseases9 and other diseases of
major epidemiological importance.
Endoscopy of the upper and lower GI tract (gastroscopy and colonoscopy) is ubiquitously used to diagnose
and treat a wide range diseases. For example, colonoscopy is used to screen for and treat colorectal adenomas,
thereby preventing cancer10. The broad implementation of colonoscopy-based screening has had a major public
health impact and is currently being recommended by international medical guidelines11. AI has been suc-
cessfully used to automate this screening procedure by automatically delineating adenomas in colonoscopy
image data12–16. These approaches have to date yielded multiple commercially available deep learning-based
systems for polyp (adenoma) detection which are successfully being applied in endoscopy routine across the
1
Department of Medicine III, University Hospital RWTH Aachen, Pauwelsstrasse 30, 52074 Aachen,
Germany. 2Department of Medicine, Rhein-Maas-Klinikum, Würselen, Germany. 3Department of Visceral Surgery
and Transplantation, University Hospital RWTH Aachen, Aachen, Germany. 4Interventional and Experimental
Endoscopy (InExEn), Internal Medicine II, University Hospital Würzburg, Würzburg, Germany. 5Division of
Pathology and Data Analytics, Leeds Institute of Medical Research at St James’s, University of Leeds, Leeds,
UK. 6Medical Oncology, National Center for Tumor Diseases (NCT), University Hospital Heidelberg, Heidelberg,
Germany. *email: jkather@ukaachen.de
Scientific Reports | (2022) 12:4829 | https://doi.org/10.1038/s41598-022-08773-1 1
Vol.:(0123456789)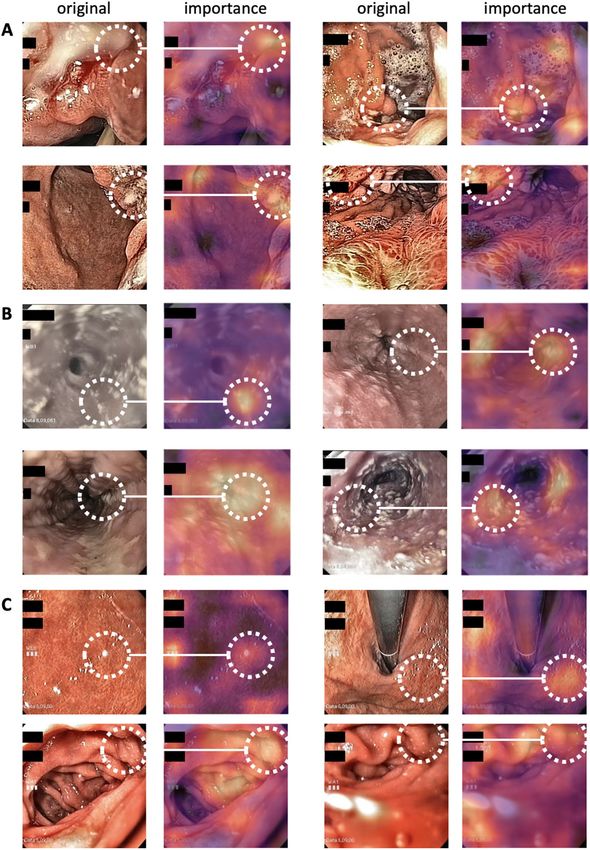
www.nature.com/scientificreports/
world. A broad body of evidence has demonstrated that these AI systems can improve diagnostic performance
while maintaining procedure t imes17. In addition to adenoma detection, AI has been used for other tasks in GI
endoscopy, including detection of helicobacter infection18, detection of gastric cancer19, precancerous lesions
of the esophagus20,21, automating standardized reporting of endoscopy procedures22 and a broad range of other
clearly defined disease detection t asks23.
Virtually all of these AI approaches use supervised workflows. This means that the pattern of interest is manu-
ally delineated in endoscopy images and these manual annotations are used as a ground truth to train an AI
system. A less laborious alternative to these region-specific annotations is to manually generate labels for images.
However, any form of manual annotations requires involvement of human experts whose time and effort is highly
limited and not scalable. Consequently, manual annotations are currently the bottleneck for development and
validation of AI systems in endoscopy. Considering that endoscopy is being used to treat a multitude of diseases,
supervised training of AI systems on all possible diseases is not feasible. In other words, the conventional AI
studies use a bottom-up approach—they aim at detecting pre-defined and manually segmented p athologies24 and
this approach is not scalable in practice. An alternative is a top-down approach, making use of the vastly diverse
imagery obtained by upper and lower gastrointestinal endoscopy and linking these to high-level descriptive data
in clinical routine. Such approaches have been successfully used in other fields of medical A I25,26 and—although
27
it bears the potential of biases and c onfounders —can be highly efficient at the same time discover previously
unknown or underappreciated visual patterns.
Therefore, in this study, we aimed to develop an AI system for detection of diseases in upper and lower GI
endoscopy just by using diagnostic information from routine reports, without using any dedicated manual
annotation of images. We deliberately included diagnostic categories related to known endoscopic image patterns
(such as “rectal cancer” [C20]) as well as clinical diagnoses present in the endoscopy reports (such as “abdominal
and pelvic pain” [R10]). We aimed to estimate the diagnostic performance that can be obtained by such weakly
supervised AI systems with respect to endoscopic and clinical diagnoses and investigated the explainability of
such systems as well as the potential susceptibility to biases in the dataset.
Methods
Ethics statement. This study was performed according to the Declaration of Helsinki. The retrospective
analysis of routine endoscopy images and the use of anonymized results for quality improvement and research
purposes was approved by the Clinical Advisory Board (CAB) board of University Hospital Aachen on 15th
April 2021 and the Ethics Board of the Medical Faculty of RWTH Aachen University on 30th April 2019 (EK
030/19). The Ethics Board of the Medical Faculty of RWTH Aachen University waived the need for informed
consent for this retrospective analysis of anonymized data. In addition, the retrospective analysis of routine
endoscopy images was approved by the ethics board of the University Hospital Wuerzburg on 28th January 2021
under the project title “Training of artificial intelligence with retrospectively collected anonymized endoscopy
images and endoscopy videos for better recognition and classification of pathologies using standardized termi-
nology” (ethics ID 2020011404).
Endoscopy data set. As a primary dataset for all analyses in this study, we obtained endoscopy reports
for all gastroscopy and colonoscopy exams at University Hospital of RWTH Aachen University which were per-
formed between January 2010 and April 2021 (colonoscopy, 23,439 examinations) and between January 2011
and April 2021 (gastroscopy, 39,989 examinations), respectively. We then obtained all endoscopy images which
were stored in the routine database Clinic WinData (E&L medical systems, Erlangen, Germany) and matched
images to reports by using a unique examination ID. This procedure yielded 18,942 colonoscopy examinations
with a total of 164,133 individual images and 29,506 gastroscopy examinations with a total of 209,041 images. No
other selection of data was performed. Most raw images had patient-related information (name, date of birth)
written on the images, although after cropping, most of this information was removed. All analyses were run on
an on-premise computing server within the University Hospital. All images which were exported for visualiza-
tion were manually anonymized by placing black bars on all patient-related information using Inkscape (https://
inkscape.org/). This anonymization was done after the actual analysis, solely for the purposes of creating the
figures in this publication. As an additional external validation set, we obtained routine images of endoscopy
examinations from the University Hospital Wuerzburg (Wuerzburg, Germany). This validation set comprised 40
gastroscopy examinations (among these, 10 examinations for each of the diagnosis categories B37, C15 and C16)
and 40 colonoscopy examinations (among these, 10 examinations for each of the categories C18, C20 and K57).
All data were stored in and extracted from the software Clinic WinData, Version 9.7.2 (E&L medical systems
GmbH, Erlangen, Germany).
Image preprocessing. All images were preprocessed with a custom-written script in Matlab R2021a
(Mathworks, Natick, USA). To remove black margins around the images, an automatic cropping procedure was
performed, which removed these margins and resulted in a square image. Specifically, 25 pixels were cropped
at the top and bottom, 40 pixels were cropped at the left side of the image and the image was cropped to a 1:1
ratio, aligned at the left side of the image. The parameters for the cropping were identical for the whole dataset
and thus did not introduce a selection bias. Subsequently, adaptive histogram normalization was performed
in 64 tiles of the image with a clip limit of 0.005 using the “adapthisteq” function. Images were then resized to
1024 × 1024 px and were stored on the disk. Before the deep learning process, images were resized to 512 × 512
px for transfer learning. On a subset of targets (C18, C20, K50, K51), we trained networks with an input size of
224 × 224 or 1024 × 1024 pixels and did not observe a consistent improvement in performance compared to the
baseline model with 512 × 512 px input size.
Scientific Reports | (2022) 12:4829 | https://doi.org/10.1038/s41598-022-08773-1 2
Vol:.(1234567890)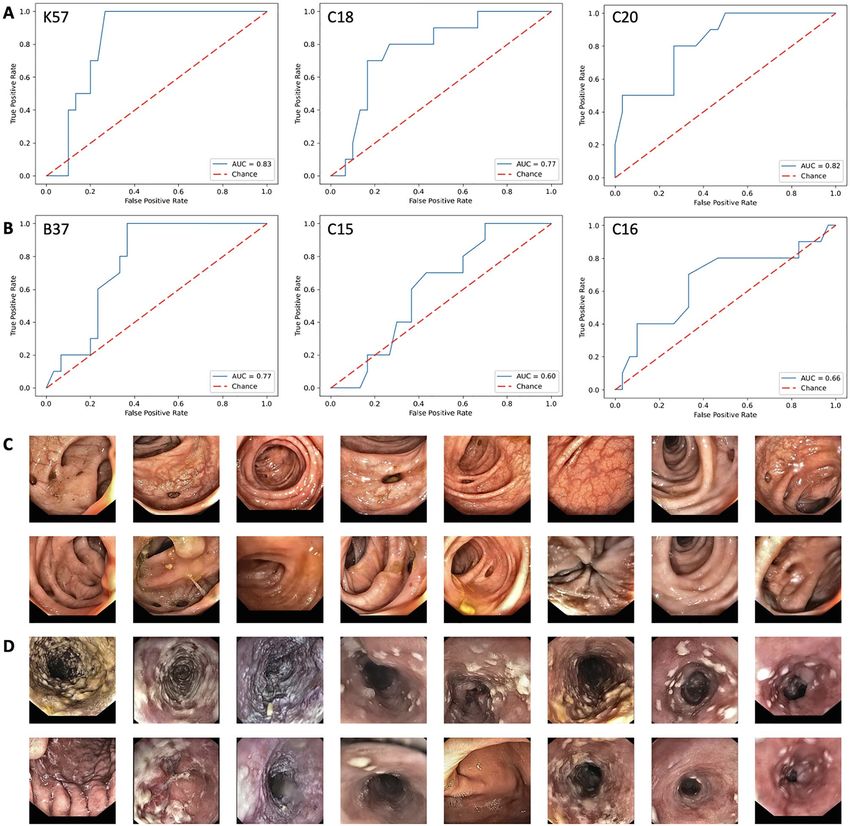
www.nature.com/scientificreports/

                                  ICD     Diagnosis                                        AUROC mean   AUROC 95% CI   N pos exams   N neg. exams   p-val
                                  K29     Gastritis and duodenitis                         0.698        0.007          9740          19,766         0.0000
                                  K44     Diaphragmatic hernia                             0.637        0.029          3725          25,781         0.0000
                                  K21     Gastro-oesophageal reflux disease                0.619        0.023          3497          26,009         0.0000
                                  K22     Other diseases of oesophagus                     0.621        0.023          2619          26,887         0.0000
                                  R10     Abdominal and pelvic pain                        0.672        0.033          1419          28,087         0.0000
                                  K25     Gastric ulcer                                    0.613        0.022          772           28,734         0.0000
                                          Malignant neoplasm of oesophagus (C15) or
                                  CXX                                                      0.761        0.048          763           28,743         0.0000
                                          stomach (C16)
                                  R13     Dysphagia                                        0.719        0.011          762           28,744         0.0000
                                  K26     Duodenal ulcer                                   0.694        0.039          626           28,880         0.0000
                                  C15     Malignant neoplasm of oesophagus                 0.773        0.051          536           28,970         0.0000
                                  B37     Candidiasis                                      0.703        0.126          469           29,037         0.0000
                                  K31     Other diseases of stomach and duodenum           0.612        0.059          401           29,105         0.0001
                                  I85     Oesophageal varices                              0.650        0.003          332           29,174         0.0000
                                  R12     Heartburn                                        0.587        0.107          312           29,194         0.0420
                                  R11     Nausea and vomiting                              0.648        0.068          279           29,227         0.0000
                                  C16     Malignant neoplasm of stomach                    0.693        0.066          245           29,261         0.0000
                                  K92     Other diseases of digestive system               0.697        0.030          222           29,284         0.0000
                                          Benign neoplasm of other and ill-defined parts
                                  D13                                                      0.593        0.142          210           29,296         0.0948
                                          of digestive system
                                          Neoplasm of uncertain or unknown behaviour
                                  D37                                                      0.595        0.092          136           29,370         0.0728
                                          of oral cavity and digestive organs
                                          Neoplasm of uncertain or unknown behaviour
                                  D48                                                      0.512        0.131          127           29,379         0.5610
                                          of other and unspecified sites
                                          Postprocedural disorders of digestive system,
                                  K91                                                      0.753        0.215          120           29,386         0.0000
                                          not elsewhere classified
                                  K57     Diverticular disease of intestine                0.543        0.196          93            29,413         0.4163
                                  K20     Oesophagitis                                     0.640        0.066          86            29,420         0.0136

                                 Table 1.  Target diseases and classifier performance for the gastroscopy dataset. All targets which reached an
                                 area under the receiver operating curve (AUC, mean ± standard deviation [std]) of above 0.70 are highlighted
                                 in bold. N pos./neg. exams = number of positive/negative examinations (with and without diagnosis,
                                 respectively). P-val. P-value for examination scores between groups.

                                 Ground truth labels. To create routine reports, endoscopists use predefined macros to generate diagnosis
                                 texts. These macros also create an international classification of diseases (ICD) code which is saved as part of the
                                 report. This results in a reliable ICD code for every examination set by a physician experienced in gastrointes-
                                 tinal endoscopy directly after the examination. We extracted all ICD10 codes from the reports and selected the
                                 most common codes (all codes which occurred more than 60 times), yielding 23 and 19 diagnosis codes in the
                                 gastroscopy and colonoscopy data set, respectively (Tables 1 and 2). We then used one-hot encoding to represent
                                 these diagnosis codes and used them as a ground truth for all subsequent analysis steps. All ground truth labels
                                 were defined on the level of examinations. If multiple ICD codes were present in each examination report, the
                                 examination was considered as “positive” for each ICD code and “negative” for all other ICD codes. Examina-
                                 tions had multiple images, all of which inherited the ground truth label of the parent examination.

                                 Deep learning. For each diagnosis code, we trained a deep convolutional neural network (ResNet-18) with
                                 a transfer learning workflow implemented in Python with Pytorch and Fastai. We used three-fold cross-valida-
                                 tion in the primary patient cohort, splitting the list of examinations into three partitions, training a network on
                                 two partitions, and testing on the third partition. This was repeated three times so that each examination was
                                 part of the test set exactly once. All images from the same examination were always in the same cross-validation
                                 fold. Subsequently, all statistics were averaged based on the results in each test partition. This workflow ensured
                                 that images from the same examination were never part of the training set and test set in the same experiment.
                                 We trained each diagnosis for a maximum of 40 epochs and stopped training once validation loss stops decreas-
                                 ing, by using 20% of all images in each training run as an internal validation set. Fine tuning method from Fastai
                                 was used during training, which first trains the newly added deep layers of the pretrained ResNet-18 (pretrained
                                 on ImageNet) while the shallow layers are freezed and subsequently trains all layers unfreezing all layers of the
                                 model with a discriminative learning rate, meaning that the learning rate gradually decreases towards the shal-
                                 low layers of the model. We used a mini batch size of 128, an initial learning rate of 2E-03. Usually, patients had
                                 5–10 images available, all of which were included in the analysis. For all patients who had more than 20 images,
                                 only 20 randomly selected images were used to avoid their over-representation in the data set. Because the distri-
                                 bution of ground truth labels among the examinations was highly imbalanced, we randomly undersampled the
                                 more abundant class until class balance was reached on an image level. For the test set, no such undersampling

Scientific Reports |   (2022) 12:4829 |                   https://doi.org/10.1038/s41598-022-08773-1                                                         3

                                                                                                                                                    Vol.:(0123456789)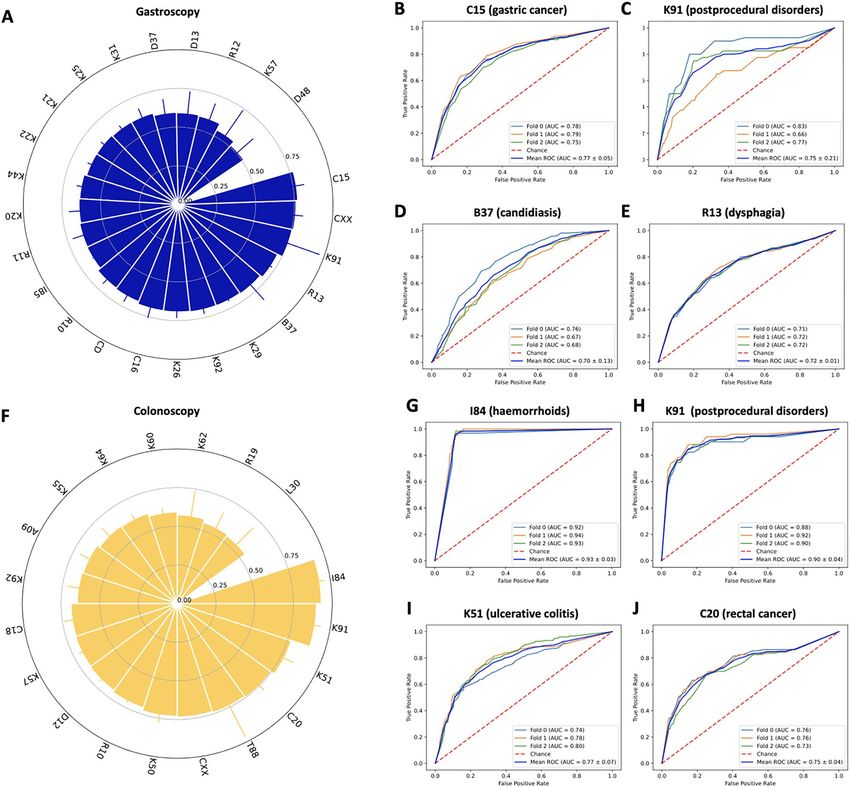
www.nature.com/scientificreports/
ICD Diagnosis AUROC mean AUROC 95% CI N pos exams N neg. exams p-val
K57 Diverticular disease of intestine 0.691 0.020 3403 15,538 0.0000
Benign neoplasm of colon, rectum, anus and
D12 0.694 0.013 3192 15,749 0.0000
anal canal
K64 Haemorrhoids and perianal venous thrombosis 0.613 0.033 1657 17,284 0.0000
R10 Abdominal and pelvic pain 0.707 0.013 800 18,141 0.0000
Malignant neoplasm of colon (C18) or rectum
CXX 0.733 0.005 631 18,310 0.0000
(C20)
K50 Crohn disease [regional enteritis] 0.729 0.053 514 18,427 0.0000
K51 Ulcerative colitis 0.775 0.068 447 18,494 0.0000
C18 Malignant neoplasm of colon 0.686 0.051 332 18,609 0.0000
C20 Malignant neoplasm of rectum 0.749 0.045 309 18,632 0.0000
Other gastroenteritis and colitis of infectious
A09 0.639 0.063 247 18,694 0.0001
and unspecified origin
K92 Other diseases of digestive system 0.646 0.073 239 18,702 0.0000
I84 Haemorrhoids 0.930 0.029 189 18,752 0.0000
K60 Fissure and fistula of anal and rectal regions 0.593 0.028 171 18,770 0.0233
Postprocedural disorders of digestive system,
K91 0.899 0.041 153 18,788 0.0000
not elsewhere classified
K55 Vascular disorders of intestine 0.620 0.067 151 18,790 0.0085
K62 Other diseases of anus and rectum 0.574 0.163 130 18,811 0.2370
Other symptoms and signs involving the diges-
R19 0.551 0.107 114 18,827 0.3459
tive system and abdomen
Other complications of surgical and medical
T88 0.740 0.226 82 18,859 0.0000
care, not elsewhere classified
L30 Other dermatitis 0.542 0.152 62 18,879 0.4652
Table 2. Target diseases and classifier performance for the colonoscopy dataset. All targets which reached an
area under the receiver operating curve (AUC, mean ± standard deviation [std]) of above 0.70 are highlighted
in bold. N pos./neg. exams = number of positive/negative examinations (with and without diagnosis,
respectively). P-val. P-value for examination scores between groups.
was performed. For deployment of trained models, a numerical (image-level soft prediction) and categorical
(image-level hard prediction) output was generated. The image-level hard predictions were aggregated on the
level of examinations and the fraction of positively predicted images was used as an examination-level prediction
score. This workflow followed a previously validated workflow which was used for weakly-supervised classifica-
tion of histology images25. For external validation experiments in the categories B37, C15 and C16 (gastroscopy)
and C18, C20 and K57 (colonoscopy), we trained a convolutional neural network on all images in the primary
cohort (Aachen) and evaluated the classification performance on a separate validation set (Wuerzburg) by using
the same procedures and hyperparameters as for the within-cohort experiments. All experiments were run on
a computing server in the clinical computing infrastructure. The server ran Windows Server 2019 and was
equipped with four NVIDIA RTX6000 GPUs.
Statistics. The primary statistical endpoint was the receiver operating curve (ROC) and the area under the
ROC (AUROC) obtained by comparing the examination-level prediction scores to the ground truth label for
each examination. 95% confidence intervals were calculated on the distribution of AUROCs for the three folds.
Furthermore, examination-level prediction scores were compared with an unpaired, two-tailed t-test between
examinations with “present” and “absent” (true and false) ground truth labels for each diagnosis category and
the p-value was reported. P-values were considered significant if they were below 0.05. No formal correction for
multiple testing was performed.
Explainability. To ensure explainability of the deep learning system, two approaches were used. First, for the
highest scoring images were extracted from the test sets. Highest scoring images were defined as the 2 images
with the highest image-level prediction score from the 10 examinations with the highest examination-level pre-
diction score. Second, on these images, Gradient-weighted Class Activation Mapping (Grad-CAM) was applied
to generate region-specific importance maps highlighting relevant image regions. Grad-CAM can utilize the
gradients of any layer belonging to a certain class to visualize heatmaps. In this study, we computed the gradients
of the last convolutional layer for each diagnosis and used their mean value within the feature map along with
activations to generate the Grad-CAM mappings.
Reader study. To improve explainability and identify potential biases in the system, we performed a sys-
tematic reader study, i.e. a manual review of the 60 highest scoring images (2 highest scoring images for each of
the 30 highest scoring examinations)28 for each of the 23 disease categories in the gastroscopy data set. A trained
observer with experience in endoscopy (> 600 gastroscopy, > 300 colonoscopy examinations) categorized each of
Scientific Reports | (2022) 12:4829 | https://doi.org/10.1038/s41598-022-08773-1 4
Vol:.(1234567890)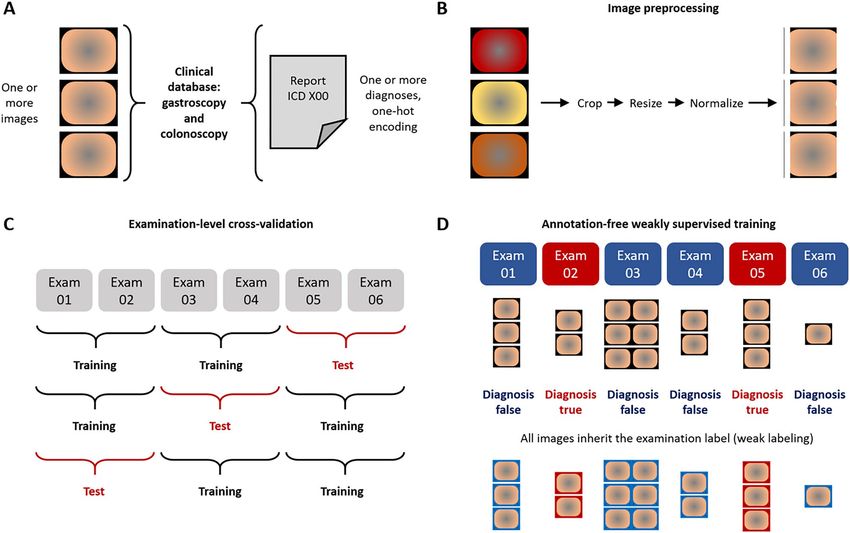
www.nature.com/scientificreports/

                                 Figure 1.  Outline of this study. (A) From a large clinical database of gastroscopy and colonoscopy examination,
                                 we retrieved images (left) and matched them to disease diagnoses obtained from the corresponding reports
                                 (right). (B) Images were slightly preprocessed by cropping, resizing and color-normalization by adaptive
                                 histogram equalization. (C) The experimental workflow relied on examination-level three-fold cross-validation,
                                 in which three artificial intelligence (AI) networks were trained for each disease category and the test set was
                                 rotated. (D) In the weakly supervised AI workflow, all images from a given examination (Exam) inherited the
                                 one-hot-encoded disease label. No image-level or pixel-level annotations were used.

                                 these 60 × 23 = 1380 images into one of five categories: (1) device (e.g. the endoscope [in retroflexion], forceps,
                                 clips, stent or other objects were visible on the image, or narrow band imaging was used), (2) artifact (e.g. out
                                 of focus images), (3) typical morphology (i.e. an image which showed a disease that was conceivably linked to
                                 the ground truth diagnosis label). All other images were classified as (4) non-typical morphology (i.e. images
                                 which did not fall into categories 1–3 and which either showed a normal, non-pathological scenery or an unre-
                                 lated disease). In addition, a category “missing image” was used in examinations which only had a single image.
                                 These categories assigned by the reader were used to determine the plausibility of predictions obtained by weakly
                                 supervised training.

                                 Results
                                 Weakly supervised AI can predict diseases from raw gastroscopy images. In this study, we used
                                 weakly supervised AI to diagnose 43 diseases in 373,174 routine images of gastrointestinal endoscopy (Fig. 1A–
                                 D), using the AUROC as the main statistical endpoint. We found that prediction of diagnosis in gastroscopy
                                 images in patients in the test set yielded high AUROCs (> 0.70) for five diseases (Fig. 2A). The AUROC was 0.773
                                 (95% confidence interval [CI] 0.051) for C15 (Malignant neoplasm of oesophagus), 0.761 (CI 0.048) for CXX
                                 (C15 or C16, malignancy of esophagus or stomach, Fig. 2B), 0.753 (95% CI 0.215) for K91 (Postprocedural dis-
                                 orders, Fig. 2C) and 0.703 (CI 0.126) for B37 (esophageal candidiasis, i.e., thrush, Fig. 2D). In addition to these
                                 clearly defined disorders with known morphological correlates, a high AUROC of 0.719 (CI 0.011) was reached
                                 for R13 (Dysphagia, Fig. 2E), which is associated with a wide range of esophageal and gastric disorders (Table 1).
                                 Five common diagnoses had more than 1000 positive patients per diagnosis class in the gastroscopy dataset: K29
                                 (Gastritis and duodenitis), K44 (Diaphragmatic hernia), K21 (Gastro-oesophageal reflux disease), K22 (Other
                                 diseases of oesophagus) and R10 (Abdominal and pelvic pain, Table 1). AI-based detection of these diagnosis
                                 classes in image data was achieved with AUROCs between 0.672 (for R10) and 0.698 (for K29, p-value < 0.0001
                                 for all, Table 1).

                                 Weakly supervised AI can predict diseases from raw colonoscopy images. Similarly, in the
                                 colonoscopy dataset, we trained the weakly supervised AI system to detect common diagnoses directly from
                                 non-annotated image data. We found that 8 out of 19 disease categories reached AUROCs above 0.70 and 2

Scientific Reports |   (2022) 12:4829 |               https://doi.org/10.1038/s41598-022-08773-1                                                  5

                                                                                                                                             Vol.:(0123456789)
www.nature.com/scientificreports/
Figure 2. Classification performance for end-to-end artificial intelligence in the gastroscopy and colonoscopy
data set. (A) Classifier performance in the gastroscopy data set as measured as the mean area under the receiver
operating curve (AUROC) of three cross-validation experiments for each disease category with 95% confidence
intervals. (B) Receiver operating curve (ROC) for C15, (C) for K91, (D) for B37 and (E) for R13. (F) AUROCs
for all disease categories in the colonoscopy data set and ROCs for (G) disease category I84, (H) for K91, (I) for
K51 and (J) for C20.
of them reached AUROCs close to 0.90 (Fig. 2F, Table 2). The best performance value was achieved for I84
(Haemorrhoids) with an AUROC of 0.930 (CI 0.029, Fig. 2G). However, the disease category I84 for Hemor-
rhoids only included 189 patients in the dataset because, while the broader category K64 (Haemorrhoids and
perianal venous thrombosis) included 1657 patients. K64 achieved an AUROC of 0.613 (CI 0.033, Table 2). The
second-best performance was achieved for K91 (Postprocedural disorders) with an AUROC of 0.899 (CI 0.041,
Fig. 2H). Similarly to K91, T88 (Other complications of surgical and medical care) reached an AUROC of 0.740
(CI 0.226). Notable diseases with a known association to specific morphological patterns which reached high
prediction performance values included K51 (Ulcerative colitis) with an AUROC of 0.775 (CI 0.068, Fig. 2I) and
C20 (Malignant neoplasm of rectum) with an AUROC of 0.749 (CI 0.045, Fig. 2J). Other notable disease catego-
ries which achieved high performance values included K50 (Crohn disease) with an AUROC of 0.729 (CI 0.053),
malignant neoplasm of colon or rectum (CXX, a combination of C18 and C20) with an AUROC of 0.733 (0.005)
and the unspecific diagnosis R10 (Abdominal and pelvic pain) which reached an AUROC of 0.707 (CI 0.013).
The AI system identifies plausible images and potential confounders. Like any AI systems,
weakly supervised approaches can be influenced by biases in the source data. To investigate if high classification
Scientific Reports | (2022) 12:4829 | https://doi.org/10.1038/s41598-022-08773-1 6
Vol:.(1234567890)www.nature.com/scientificreports/
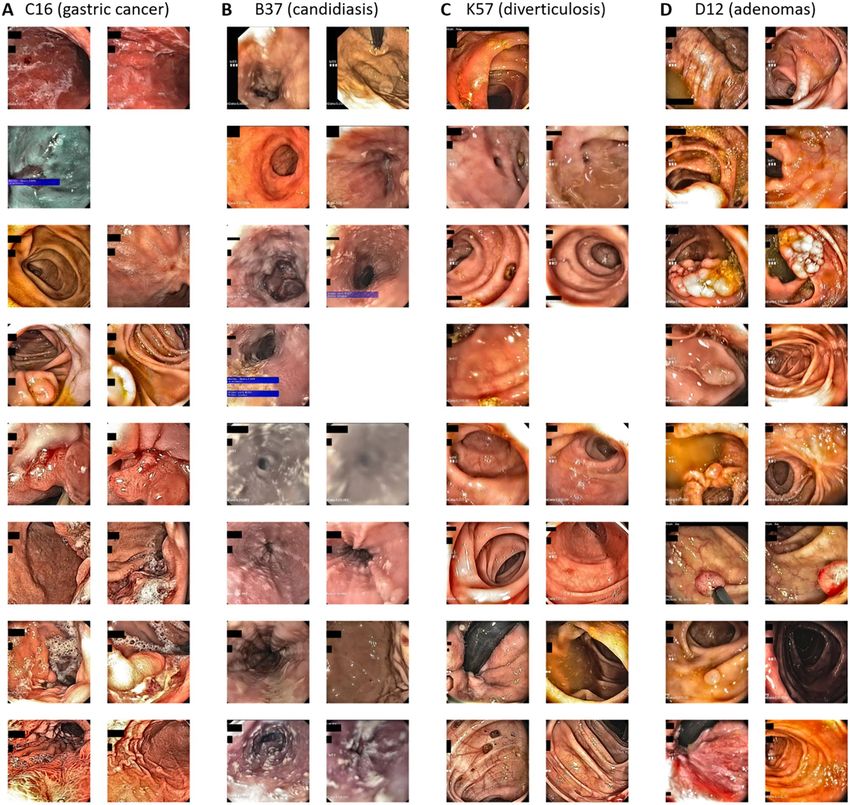
Figure 3. Highly scoring images identified by the artificial intelligence system in the gastroscopy and
colonoscopy data set. The two highest scoring images for the eight highest scoring patients are shown for the
gastroscopy dataset: (A) C16, (B) B37, and the colonoscopy data set: (C) K57 and (D) D12.
performance for disease categories was related to the detection of plausible patterns in images, we developed and
used two approaches: identification of highly predictive images and identification of highly predictive regions
within these images. First, we extracted and analyzed the two highest scoring images for the ten highest scor-
ing patients for four representative disease categories: C16 (gastric cancer, Fig. 3A), B37 (candidiasis, Fig. 3B),
K57 (diverticulosis, Fig. 3C) and D12 (adenomas, Fig. 3D). We found that in all of these categories, despite
the high degree of label noise in the original dataset, highly typical morphological patterns were present. For
example, a range of lesions which are highly suspect for malignancy were present in the gastric cancer (C16,
Fig. 3A) highly predictive images, including diffusely inflammatory patterns and localized polypoid lesions.
Also, for B37 (esophageal candidiasis), the highest scoring images (Fig. 3B) almost exclusively showed highly
typical morphological patterns, despite the fact that C16 and B37 had AUROCs of around 0.70 (Table 2). Next,
we investigated if these images were selected by the AI system because of the presence of plausible patterns in
these images. We used GradCAM to generate “importance maps” on the highest predictive images and manually
reviewed the maps (representative maps shown in Fig. 4A,B). Indeed, we found that for all diagnosis categories,
plausible image regions were highlighted by GradCAM, for example polypoid tumors for gastric cancer (C16,
Fig. 4A) and white lesions corresponding to thrush esophagitis for B37 (candidiasis, Fig. 4B). However, this
analysis also identified potential confounders: in the top left image of Fig. 4C, an artifact (light reflection) in the
gastric mucosa was erroneously assigned a high importance score for K29 (gastritis and duodenitis). Finally,
Scientific Reports | (2022) 12:4829 | https://doi.org/10.1038/s41598-022-08773-1 7
Vol.:(0123456789)www.nature.com/scientificreports/
Figure 4. Importance maps for highly predictive image regions in the gastroscopy dataset. (A) Representative
images with corresponding importance maps (generated by GradCAM) for C16 (gastric cancer). (B)
Representative images for B37 (candidiasis). (C) Representative images for K29 (Gastritis and duodenitis).
White circles indicate corresponding areas in the original image and the GradCAM heatmap.
we quantified the ability of the AI system to link plausible morphology to disease categories by systematically
reviewing the highest scoring 60 images (20 images from each of the three folds) for each disease category in the
gastroscopy dataset and classifying images as having a typical (or plausible) morphology, no typical morphol-
ogy or missingness, presence of endoscopic devices as potential confounders or image artifacts (Table 3). In
Scientific Reports | (2022) 12:4829 | https://doi.org/10.1038/s41598-022-08773-1 8
Vol:.(1234567890)www.nature.com/scientificreports/
ICD Diagnosis Typical Not typical Missing Device Artifact
B37 Candidiasis 0.68 0.18 0.03 0.07 0.03
K26 Duodenal ulcer 0.60 0.23 0.00 0.15 0.02
K20 Oesophagitis 0.57 0.32 0.02 0.08 0.02
K22 Other diseases of oesophagus 0.55 0.15 0.22 0.05 0.03
C15 Malignant neoplasm of oesophagus 0.50 0.13 0.13 0.18 0.05
K29 Gastritis and duodenitis 0.48 0.23 0.03 0.18 0.07
C16 Malignant neoplasm of stomach 0.48 0.33 0.05 0.13 0.00
K25 Gastric ulcer 0.47 0.33 0.10 0.08 0.02
K92 Other diseases of digestive system 0.47 0.35 0.03 0.15 0.00
D13 Benign neoplasm of other and ill-defined parts of digestive system 0.42 0.32 0.07 0.18 0.02
K21 Gastro-oesophageal reflux disease 0.42 0.38 0.02 0.18 0.00
CXX Malignant neoplasm of oesophagus or stomach 0.40 0.17 0.12 0.28 0.03
R11 Nausea and vomiting 0.38 0.37 0.08 0.13 0.03
K31 Other diseases of stomach and duodenum 0.37 0.35 0.02 0.22 0.05
Neoplasm of uncertain/unknown behaviour, oral cavity/digestive
D37 0.37 0.43 0.02 0.17 0.02
organs
R13 Dysphagia 0.28 0.47 0.12 0.10 0.03
I85 Oesophageal varices 0.27 0.48 0.03 0.20 0.02
D48 Neoplasm of uncertain/unknown behaviour of other/unspecified sites 0.25 0.43 0.07 0.23 0.02
K57 Diverticular disease of intestine 0.20 0.68 0.00 0.10 0.02
R12 Heartburn 0.18 0.65 0.05 0.10 0.02
K91 Postprocedural disorders of digestive system, not elsewhere classified 0.17 0.28 0.10 0.42 0.03
K44 Diaphragmatic hernia 0.12 0.57 0.00 0.30 0.02
R10 Abdominal and pelvic pain 0.10 0.75 0.08 0.05 0.02
Table 3. Results of the reader study in the gastroscopy data set. For each diagnosis category in the gastroscopy
dataset, the AI system selected 60 highly predictive images (2 highest scoring images from 10 highest scoring
patients in each of the 3 folds). These images were manually classified into five categories by a trained observer.
The fraction of images in each category in every category is shown.
this reader study, we found that for B37 (Candidiasis), K26 (Duodenal ulcer), K20 (Oesophagitis), K22 (Other
diseases of oesophagus) and C15 (Malignant neoplasm of oesophagus), more than 50% of the highly scoring
images were highly typical or plausible for the respective disease, which means that the AI system successfully
identified images associated with diseases from a large non-annotated database. For a number of ICD diagnoses,
a substantial proportion (> 20%) of highly predictive images showed medical devices (acting as potential biases,
Suppl. Fig. S1A–I), including retroverted endoscopes, stents and clips, in particular CXX (C15 or C16, malignant
neoplasm of esophagus or stomach, 28% of images with devices, Table 3), I85 (esophageal varices, 20%), K91
(postprocedural disorders, 42%) and K44 (diaphragmatic hernia, 30%). Together, these data show that without
any image- or pixel-level annotation, an AI system can identify plausible visual patterns linked to disease, but
manual review can identify some potential biases.
Generalizability to an external validation set. AI classifiers are prone to overfit to the training data-
set, in particular in weakly supervised settings in which latent biases might skew performance. Therefore, we
externally validated the performance of our proposed AI system on six diagnosis categories in gastroscopy and
colonoscopy examinations from a separate validation cohort. In the colonoscopy data set, this approach reached
AUROCs of 0.832 (p = 0.0044), 0.772 (p = 0.0182) and 0.825 (p = 0.0004) for K57 (diverticular disease), C18
(colon cancer) and C20 (rectal cancer), respectively (Fig. 5A, Suppl. Table S1), outperforming the within-cohort
classifiers (Table 2). In the gastroscopy data set, this approach reached AUROCs of 0.767 (p = 0.0097), 0.603
(p = 0.2989) and 0.667 (p = 0.145), for B37 (candidiasis), C15 (esophageal cancer) and C16 (gastric cancer),
respectively (Fig. 5B). In addition, a manual review of the highly scoring images as detected by the AI system
in the validation set revealed the presence of highly plausible patterns: for K57 (diverticulosis), all of the eight
highest scoring patients in the validation set showed the presence of a diverticulum (Fig. 5C). Similarly, all
images selected by the AI system for B37 (candidiasis) showed the typical presence of white esophageal lesions
(Fig. 5D). Together, these results demonstrate that the pathognomonic patterns learned by the AI system in the
weakly labeled training set were robustly generalizable to an external validation cohort.
Discussion
Weakly supervised AI creates new opportunities for endoscopy image analysis. Here, we show
that AI can detect some of the most common diseases in routine images of upper and lower gastrointestinal (GI)
endoscopy, including malignant, infectious and inflammatory diseases. Compared to previous studies of AI in
endoscopy which relied on laborious manual annotation of images, our approach relies only on examination-
Scientific Reports | (2022) 12:4829 | https://doi.org/10.1038/s41598-022-08773-1 9
Vol.:(0123456789)www.nature.com/scientificreports/
Figure 5. Classification performance in the external validation set. (A) Receiver operating curves (ROC) with
area under the curve (AUC) in the colonoscopy validation set for K57 (diverticulosis), C18 (colon cancer) and
C20 (rectal cancer). (B) ROC in the gastroscopy validation set for B37 (candidiasis), C15 (esophageal cancer)
and C16 (gastric cancer). (C) Highest scoring images (two each) in highest scoring patients (eight) as selected by
the AI model from the validation set for K57 (diverticulosis) (D) and B37 (candidiasis).
level labels extracted from routine endoscopy reports. For training, we use a non-annotated routine database
from a high-volume endoscopic center, including a multitude of endoscopic devices, spanning multiple years.
Neither the image data nor the report data were specifically intended for analysis by an AI system at the time of
the examination. Yet, the weakly supervised AI system achieves high predictive performance for identification
of diagnoses in endoscopy image data (Fig. 2). By making predictions explainable on an image and sub-image
scale, we show that the AI system learns highly plausible patterns at the level of images (Fig. 3) and regions
(Fig. 4). We show that the resulting classifiers are robust and generalize well to a separate validation cohort, in
which the classification performance in the original dataset is even surpassed for several diagnostic categories
(Fig. 5). Together, these findings are a strong proof of concept for the usefulness of weakly supervised AI systems
in clinical routine image data even in the absence of any expert-based annotations.
Our study extends the use of AI in gastroenterology from curated and highly selected datasets to the vast
amount of routine image data stored on clinical servers in endoscopy departments across the world. AI systems
in general, and weakly supervised systems in particular, are potentially susceptible to biases in the distribution
of ground truth l abels29. One of the most important prerequisites for medical AI is that it provides explainability
Scientific Reports | (2022) 12:4829 | https://doi.org/10.1038/s41598-022-08773-1 10
Vol:.(1234567890)www.nature.com/scientificreports/
to gain trust among users and allow identification of biases30. While our weakly supervised AI system achieved
high diagnostic performance and enables explainability, it is not immune to biases in the image dataset. In this
study, we identify potential confounders in our approach but also demonstrate that clinically relevant patterns
are correctly identified by our approach. In summary, we show for the first time that AI can learn visual patterns
of upper and lower GI pathology directly from examination labels in a weakly supervised way.
Limitations. The main limitations of our study are related to the fact that all images in this study were
originally not obtained with quantitative image analysis in mind, but were intended for human interpretation
and documentation. This resulted in a large variation in terms of image quality, the number of images per case
and the anatomic regions represented in these images. In this study, we compensate for these variations by using
hundreds of thousands of images. Another way to address these problems in the future is by routinely recording
any endoscopic examination, thereby limiting the bias introduced by human operators who choose when to save
an image to the archive. From a technical point of view, the structure of the current dataset can lead to label noise
and potential biases in the dataset which this study aimed to identify and quantify. Label noise limits this study
because all images in a given exam inherit the exam label, which we know is not correct. For example, a patient
with a diaphragmatic hernia will still have images of the normal duodenum in their file. Again, due to the high
number of cases, we empirically show that AI can compensate for this type of label noise and learn clinically
plausible image patterns. Another type of label noise is due to the imperfect nature of the diagnoses which were
made during the endoscopy procedure and not by histopathology, which should be the ultimate gold standard for
future validation studies. Our approach enabled us to also address unspecific diagnoses such as R12 (heartburn)
or R13 (dysphagia), which were among the most common diagnoses in the dataset. Unlike diagnoses with a clear
morphological correlation (such as K20, oesophagitis), it is unclear if prediction of such an unspecific diagnosis
is useful. Yet, in our study we demonstrate that even for diagnostic categories like R12 (heartburn) plausible
image features are learned by the AI system, including reflux esophagitis. Based on this finding we hypothesize
that AI systems could even detect disease states which are not (yet) obvious to the endoscopist, hence the unspe-
cific symptom-based diagnosis in the endoscopy report. Future studies are needed to validate this hypothesis.
Another potential limitation of our primary dataset is the presence of text information on some images, which
might in theory have been exploited by the trained models. We addressed this problem by evaluating classifiers
on a separate patient cohort without any text on the images. Yet, for future studies, endoscopy images should be
saved without any text overlay. In addition, our analysis was done on the level of examinations, not on the level of
patients and future studies. Finally, our weakly supervised approach enabled us to analyze a large, non-annotated
dataset but the performance could be inferior to a fully supervised approach. Future studies need to weigh the
advantages and disadvantages of such weakly supervised versus fully supervised approaches.
Outlook. In this study, we report that weakly supervised AI systems can achieve a high performance and
maintain explainability in end-to-end image analysis in GI endoscopy. This shows that manual annotations
are not necessarily a bottleneck for future clinical applications of AI. Thus, weakly supervised AI could enable
the analysis of large, multi-centric databases of millions of endoscopy examinations without being limited by
manual annotation. In addition, the capacity of AI systems to learn pathophysiologically relevant patterns from
non-annotated images shows that AI could enable mechanistic scientific insight in addition to yielding tools of
potential clinical usefulness. Future approaches could also be used to predict clinical features as well as genomic
findings and predict risk of malignancy in conjunction with other data elements such as clinical, radiology, and
whole slide images31. Our study provides a blueprint as well as the algorithms and open-source implementation
for future multicentric studies required to implement weakly supervised AI systems as diagnostic support tools
in endoscopy.
Data availability
The images used in this study contain patient-related data (names, date of birth) and this study was approved by
the institutional review board under the provision that all analyses are carried out within the clinical computing
servers of University Hospital Aachen. Therefore, the image data cannot be made available. If external parties
wish to use the dataset for validation of other AI models, they can contact the study principal investigators (LB
and JNK) who will seek approval by the institutional review board within four weeks.
Code availability
All source codes for the deep learning training and deployment are publicly available under an open-source
license at https://github.com/KatherLab/deepmed with an extensive user manual28.
Received: 26 October 2021; Accepted: 3 March 2022
References
1. Esteva, A. et al. Dermatologist-level classification of skin cancer with deep neural networks. Nature 542, 115–118 (2017).
2. Brinker, T. J. et al. Comparing artificial intelligence algorithms to 157 German dermatologists: The melanoma classification
benchmark. Eur. J. Cancer 111, 30–37 (2019).
3. Echle, A. et al. Deep learning in cancer pathology: A new generation of clinical biomarkers. Br. J. Cancer https://doi.org/10.1038/
s41416-020-01122-x (2020).
4. Hosny, A. et al. Artificial intelligence in radiology. Nat. Rev. Cancer 18, 500–510 (2018).
5. van der Sommen, F. et al. Machine learning in GI endoscopy: Practical guidance in how to interpret a novel field. Gut 69, 2035–2045
(2020).
Scientific Reports | (2022) 12:4829 | https://doi.org/10.1038/s41598-022-08773-1 11
Vol.:(0123456789)www.nature.com/scientificreports/
6. Wilhelm, D. et al. Artificial intelligence in visceral medicine. Visc. Med. 36, 471–475 (2020).
7. Calderaro, J. & Kather, J. N. Artificial intelligence-based pathology for gastrointestinal and hepatobiliary cancers. Gut 70, 1183–1193
(2021).
8. Kather, J. N. & Calderaro, J. Development of AI-based pathology biomarkers in gastrointestinal and liver cancer. Nat. Rev. Gas-
troenterol. Hepatol. https://doi.org/10.1038/s41575-020-0343-3 (2020).
9. Sundaram, S. et al. Artificial intelligence in inflammatory bowel disease endoscopy: Current landscape and the road ahead. Ther.
Adv. Gastrointest. Endosc. 14, 26317745211017810 (2021).
10. Brenner, H. et al. Does a negative screening colonoscopy ever need to be repeated?. Gut 55, 1145–1150 (2006).
11. Cardoso, R. et al. Colorectal cancer incidence, mortality, and stage distribution in European countries in the colorectal cancer
screening era: An international population-based study. Lancet Oncol. 22, 1002–1013 (2021).
12. Yamada, M. et al. Development of a real-time endoscopic image diagnosis support system using deep learning technology in
colonoscopy. Sci. Rep. 9, 14465 (2019).
13. Wang, P. et al. Effect of a deep-learning computer-aided detection system on adenoma detection during colonoscopy (CADe-DB
trial): A double-blind randomised study. Lancet Gastroenterol. Hepatol. 5, 343–351 (2020).
14. Mohan, B. P. et al. Real-time computer aided colonoscopy versus standard colonoscopy for improving adenoma detection rate: A
meta-analysis of randomized-controlled trials. EClin. Med. 29–30, 100622 (2020).
15. Wang, P. et al. Real-time automatic detection system increases colonoscopic polyp and adenoma detection rates: A prospective
randomised controlled study. Gut 68, 1813–1819 (2019).
16. Hann, A., Troya, J. & Fitting, D. Current status and limitations of artificial intelligence in colonoscopy. United Eur. Gastroenterol.
J. 9, 527–533 (2021).
17. Moore, M. & Sharma, P. Updates in artificial intelligence in gastroenterology endoscopy in 2020. Curr. Opin. Gastroenterol. 37,
428–433 (2021).
18. Bang, C. S., Lee, J. J. & Baik, G. H. Artificial intelligence for the prediction of helicobacter pylori infection in endoscopic images:
Systematic Review and meta-analysis of diagnostic test accuracy. J. Med. Internet. Res. 22, e21983 (2020).
19. Niu, P.-H. et al. Artificial intelligence in gastric cancer: Application and future perspectives. World J. Gastroenterol. 26, 5408–5419
(2020).
20. de Groof, J. et al. The Argos project: The development of a computer-aided detection system to improve detection of Barrett’s
neoplasia on white light endoscopy. United Eur. Gastroenterol. J. 7, 538–547 (2019).
21. de Groof, A. J. et al. Deep-learning system detects neoplasia in patients with barrett’s esophagus with higher accuracy than
endoscopists in a multistep training and validation study with benchmarking. Gastroenterology 158, 915–29.e4 (2020).
22. Abadir, A. P. et al. Artificial intelligence in gastrointestinal endoscopy. Clin. Endosc. 53, 132–141 (2020).
23. Pannala, R. et al. Emerging role of artificial intelligence in GI endoscopy. Gastrointest. Endosc. 92, 1151–1152 (2020).
24. Min, J. K., Kwak, M. S. & Cha, J. M. Overview of deep learning in gastrointestinal endoscopy. Gut Liver 13, 388–393 (2019).
25. Kather, J. N. et al. Pan-cancer image-based detection of clinically actionable genetic alterations. Nat. Cancer 1, 789–799 (2020).
26. Fu, Y. et al. Pan-cancer computational histopathology reveals mutations, tumor composition and prognosis. Nat. Cancer 1, 1–11
(2020).
27. Howard, F. M. et al. The impact of digital histopathology batch effect on deep learning model accuracy and bias. BioRxiv https://
doi.org/10.1101/2020.12.03.410845 (2020).
28. van Treeck, M. et al. DeepMed: A unified, modular pipeline for end-to-end deep learning in computational pathology. BioRxiv
https://doi.org/10.1101/2021.12.19.473344 (2021).
29. Hao, D. et al. Inaccurate labels in weakly-supervised deep learning: Automatic identification and correction and their impact on
classification performance. IEEE J. Biomed. Health Inf. 24, 2701–2710 (2020).
30. Schmitz, R. et al. Artificial intelligence in GI endoscopy: Stumbling blocks, gold standards and the role of endoscopy societies.
Gut https://doi.org/10.1136/gutjnl-2020-323115 (2020).
31. Boehm, K. M. et al. Harnessing multimodal data integration to advance precision oncology. Nat. Rev. Cancer https://doi.org/10.
1038/s41568-021-00408-3 (2021).
Acknowledgements
The authors would like to thank E&L medical systems GmbH (Erlangen, Germany), in particular Christian
Zankl, Udo Geissler and Wolfgang Lordieck for providing a custom-written program to export endoscopy images
from the routine clinical archive, based on the diagnostic documentation and picture acquisition system Clinic
WinData. The authors are also grateful to the department of Information Technology at University Hospital
Aachen, particularly to Maria Helene Moers for technical assistance.
Author contributions
Study concept and design: L.B., J.N.K.; acquisition of data: L.B., M.T.K., H.W.Z., T.H., T.J.L., A.H., C.T., J.N.K.;
analysis and interpretation of data: L.B., D.C., N.G.L., M.v.T., J.N.K.; drafting of the manuscript: J.N.K.; critical
revision of the manuscript for important intellectual content: L.B., D.C., N.G.L., M.v.T., M.T.K., H.W.Z., T.H.,
T.J.L., A.H., C.T.; statistical analysis: J.N.K., M.v.T., D.C.; obtained funding: C.T., J.N.K.; technical, or material
support: D.C., N.G.L.; study supervision: C.T., A.H.
Funding
JNK is supported by the German Federal Ministry of Health (DEEP LIVER, ZMVI1-2520DAT111) and the
Max-Eder-Programme of the German Cancer Aid (Grant #70113864). CT is supported by the German Research
Foundation (DFG) (SFB CRC1382, SFB-TRR57).
Competing interests
JNK declares consulting services for Owkin, France and Panakeia, UK. No other potential conflicts of interest
are reported by any of the authors.
Additional information
Supplementary Information The online version contains supplementary material available at https://doi.org/
10.1038/s41598-022-08773-1.
Correspondence and requests for materials should be addressed to J.N.K.
Scientific Reports | (2022) 12:4829 | https://doi.org/10.1038/s41598-022-08773-1 12
Vol:.(1234567890)www.nature.com/scientificreports/
Reprints and permissions information is available at www.nature.com/reprints.
Publisher’s note Springer Nature remains neutral with regard to jurisdictional claims in published maps and
institutional affiliations.
Open Access This article is licensed under a Creative Commons Attribution 4.0 International
License, which permits use, sharing, adaptation, distribution and reproduction in any medium or
format, as long as you give appropriate credit to the original author(s) and the source, provide a link to the
Creative Commons licence, and indicate if changes were made. The images or other third party material in this
article are included in the article’s Creative Commons licence, unless indicated otherwise in a credit line to the
material. If material is not included in the article’s Creative Commons licence and your intended use is not
permitted by statutory regulation or exceeds the permitted use, you will need to obtain permission directly from
the copyright holder. To view a copy of this licence, visit http://creativecommons.org/licenses/by/4.0/.
© The Author(s) 2022
Scientific Reports | (2022) 12:4829 | https://doi.org/10.1038/s41598-022-08773-1 13
Vol.:(0123456789)You can also read


