Spectrally blue hydrated parent body of asteroid (162173) Ryugu
←
→
Page content transcription
If your browser does not render page correctly, please read the page content below
ARTICLE
                   https://doi.org/10.1038/s41467-021-26071-8                OPEN

                  Spectrally blue hydrated parent body of asteroid
                  (162173) Ryugu
                  Eri Tatsumi 1,2,3 ✉, Naoya Sakatani 4, Lucie Riu 5, Moe Matsuoka 5, Rie Honda6, Tomokatsu Morota 3,
                  Shingo Kameda 4, Tomoki Nakamura7, Michael Zolensky8, Rosario Brunetto 9, Takahiro Hiroi 10,
                  Sho Sasaki11, Sei’ichiro Watanabe 12, Satoshi Tanaka5,13, Jun Takita14, Cédric Pilorget9, Julia de León 1,2,
                  Marcel Popescu15, Juan Luis Rizos 1,2, Javier Licandro1,2, Ernesto Palomba16, Deborah Domingue17,
                  Faith Vilas17, Humberto Campins18, Yuichiro Cho 3, Kazuo Yoshioka 3, Hirotaka Sawada5, Yasuhiro Yokota5,
1234567890():,;

                  Masahiko Hayakawa5, Manabu Yamada 19, Toru Kouyama 20, Hidehiko Suzuki21, Chikatoshi Honda22,
                  Kazunori Ogawa 5, Kohei Kitazato 22, Naru Hirata 22, Naoyuki Hirata23, Yuichi Tsuda5,13,
                  Makoto Yoshikawa5,13, Takanao Saiki5, Fuyuto Terui5, Satoru Nakazawa 5, Yuto Takei 5,
                  Hiroshi Takeuchi 5,13, Yukio Yamamoto 5,13, Tatsuaki Okada 3,5, Yuri Shimaki 5, Kei Shirai23 &
                  Seiji Sugita 3,19

                  Ryugu is a carbonaceous rubble-pile asteroid visited by the Hayabusa2 spacecraft. Small
                  rubble pile asteroids record the thermal evolution of their much larger parent bodies.
                  However, recent space weathering and/or solar heating create ambiguities between the
                  uppermost layer observable by remote-sensing and the pristine material from the parent
                  body. Hayabusa2 remote-sensing observations find that on the asteroid (162173) Ryugu both
                  north and south pole regions preserve the material least processed by space weathering,
                  which is spectrally blue carbonaceous chondritic material with a 0–3% deep 0.7-µm band
                  absorption, indicative of Fe-bearing phyllosilicates. Here we report that spectrally blue
                  Ryugu’s parent body experienced intensive aqueous alteration and subsequent thermal
                  metamorphism at 570–670 K (300–400 °C), suggesting that Ryugu’s parent body was
                  heated by radioactive decay of short-lived radionuclides possibly because of its early for-
                  mation 2–2.5 Ma. The samples being brought to Earth by Hayabusa2 will give us our first
                  insights into this epoch in solar system history.

                  1 Institutode Astrofísica de Canarias (IAC), La Laguna, Tenerife, Spain. 2 Department of Astrophysics, University of La Laguna, La Laguna, Tenerife, Spain.
                  3 The University of Tokyo, Bunkyo, Tokyo, Japan. 4 Rikkyo University, Toshima, Tokyo, Japan. 5 Institute of Space and Astronautical Science (ISAS), Japan
                  Aerospace Exploration Agency (JAXA), Sagamihara, Kanagawa, Japan. 6 Kochi University, Kochi, Kochi, Japan. 7 Tohoku University, Sendai, Miyagi, Japan.
                  8 NASA Johnson Space Center, Houston, TX, USA. 9 Université Paris-Saclay, CNRS, Institut d’Astrophysique Spatiale, Orsay, France. 10 Brown University,

                  Providence, RI, USA. 11 Osaka University, Toyonaka, Osaka, Japan. 12 Nagoya University, Nagoya, Aichi, Japan. 13 SOKENDAI (The Graduate University for
                  Advanced Studies), Hayama, Kanagawa, Japan. 14 Hokkaido Kitami Hokuto High School, Kitami, Hokkaido, Japan. 15 Astronomical Institute of the Romanian
                  Academy, Bucharest, Romania. 16 NAF, Instituto di Astrofisica e Planetologia Spaziali, Rome, Italy. 17 Planetary Science Institute, Tucson, AZ, USA.
                  18 University of Central Florida, Orland, FL, USA. 19 Planetary Exploration Research Center (PERC), Chiba Institute of Technology, Narashino, Chiba, Japan.
                  20 National Institute of Advanced Industrial Science and Technology (AIST), Koto, Tokyo, Japan. 21 Meiji University, Kawasaki, Kanagawa, Japan. 22 The

                  University of Aizu, Aizu-Wakamatsu, Fukushima, Japan. 23 Kobe University, Kobe, Hyogo, Japan. ✉email: etatsumi-ext@iac.es

                  NATURE COMMUNICATIONS | (2021)12:5837 | https://doi.org/10.1038/s41467-021-26071-8 | www.nature.com/naturecommunications                                 1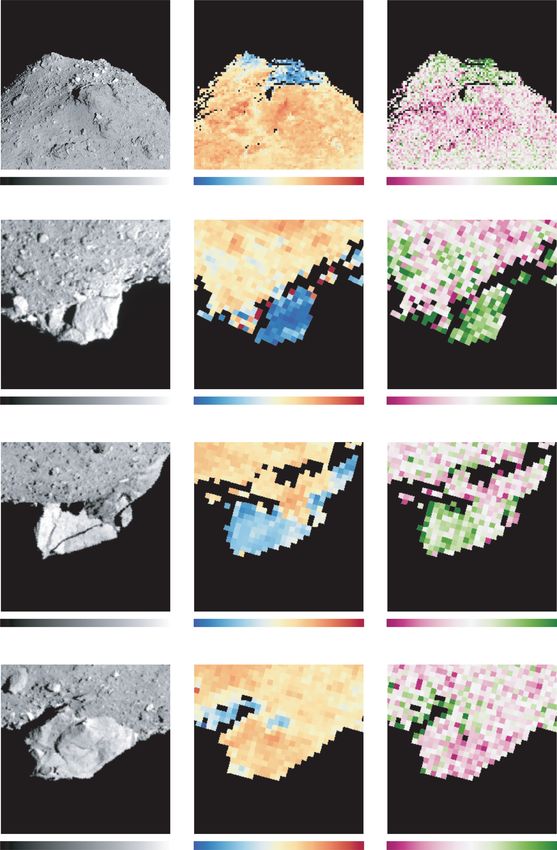
ARTICLE                                                                 NATURE COMMUNICATIONS | https://doi.org/10.1038/s41467-021-26071-8

O
         ur understanding of the evolution of dust to planetesi-             poles, as clearly shown (See also Supplementary Fig. 1 and Sup-
         mals in the early solar system is advancing thanks to the           plementary Movies 1 and 2). Furthermore, blue material is
         integration of intensive spacecraft exploration, dynamical          associated with a relatively deeper 0.7-µm band absorption
modeling, meteoritic analyses and advances in astronomical                   (Supplementary Fig. 2). Otohime Saxum, the largest boulder on
observations. Asteroids are considered to be remnants of plane-              the south pole, is of particular interest in this regard (Fig. 1b–d).
tesimals, which were the main building blocks of terrestrial pla-            As was pointed out in the global Ryugu observations, Otohime
nets. Thus, the thermal history and water/rock ratio of asteroids            has multiple sharp facets on its surface and many cracks that
are keys to understanding the physical and chemical environ-                 could have been caused by meteorite impacts3. Furthermore,
ments in the early solar system. The NASA Dawn spacecraft                    Otohime consists of three facets, two flat facets (A and B) and one
investigated two protoplanets that have survived almost intact, (1)          rough facet (C) (detailed regions of interest for spectral properties
Ceres and (4) Vesta. Geomorphological and spectral analyses                  in Fig. 2 are shown in Supplementary Fig. 4). On the south pole,
have recently suggested the presence of liquids in the subsurface            the blue Facets A and B show a relatively deeper 0.7-µm band
of Ceres1. Thus, carbonaceous protoplanets have probably                     absorption than Facet C, which has a spectral slope similar to the
undergone rock-ice differentiation and/or varying degrees of                 average for Ryugu. The spectra of north pole and Otohime’s Facet
internal aqueous alteration2. The rubble-pile asteroid Ryugu,                A exhibit the bluest spectrum (b–x slope of −0.17/µm and −0.14/
target of the Hayabusa2 mission, resulted from catastrophic dis-             µm, respectively) and a relatively deeper 0.7-µm band absorption
ruptions of larger parent bodies3–5. Ryugu could be an ideal body            (Fig. 2). The depth of 0.7-µm absorption for the north pole region
to study the thermal history and water/rock ratio of pre-                    and Facet A are 1.24 ± 0.11% and 1.28 ± 0.06%, respectively, while
disruption parent bodies, much larger (~100 km) than Ryugu.                  the typical Ryugu and Facet C absorption values are 0.98% and
Our objective is to find the most pristine material on Ryugu and              0.63 ± 0.08%. This absorption is much deeper than the hint of
to study evidence for proposed thermal metamorphism of its                   absorption excess of ~0.07% at low lattitudes14. Because the
original parent body and consequent processes after its cata-                ambiguity of the 0.7-µm absorption measurement from the sen-
strophic disruption and re-accumulation. Stratigraphic analyses              sitivity calibration of ONC-T is 1.6%12, the absolute value of the
have suggested that the possible surviving, unprocessed materials            0.7-µm band absorption of the north pole region and Facet A is
are bluer than the average Ryugu reflectance spectrum3,6. Slightly            less than this ambiguity. However, because this ambiguity is
bluer materials than the average were found on the equatorial                dominated by the spectral uncertainty of standard stars, the
ridge, which might be uncovered by regolith migration from the               accuracy of spectral difference between different areas on Ryugu
ridge to the middle latitudinal regions3,7. Moreover, the global             is much better, ~0.1% for 15 pixel by 15 pixel binning12. Thus, the
observations obtained by the Hayabusa2 spacecraft discovered                 depth of 0.7-µm band is statistically significant, ~3–7 sigma (see
that the bluest materials are distributed at the polar regions of            “Methods”, subsection Image analyses).
Ryugu, where both solar heating and space weathering are                        The near-infrared reflectance spectrometer (NIRS3)6 observa-
weakest3,5 (Supplementary Fig. 1). This motivated us to conduct              tions display a 2.72-µm band absorption in the spectrum of the
detailed surveys of the polar regions to investigate the unpro-              north pole plains that shows a slightly deeper absorption than the
cessed materials. Effects after the formation of Ryugu, such as              standard reference spectrum (8.1% on the northern plain and
solar wind irradiation, micrometeoroid bombardment, and                      7.5% for the reference spectrum; see Fig. 3a). The increase in band
radiative heating caused by close encounter to the Sun, need to be           depth is small, however, when comparing the band depth for all
deconstructed. Phyllosilicates in CM (Mighei-type)/CI (Ivuna-                NIRS3 spectra observed on 26 July with the spectra falling on the
type) chondrites become progressively enriched in Mg (and                    northern plain, we do observe a region-wide increase in the band
depleted in Fe) as aqueous alteration proceeds8–10. Thus, Fe-                depth (Fig. 3a, right panel). Facet A of Otohime shows a slightly
bearing phyllosilicates showing 0.7-µm band absorption are a                 larger band depth (8.85% on Facet A and 8.35% for the reference
strong indication of the specific water/rock ratio condition during           spectrum, see Fig. 3b), however the spectra that fall on Otohime
the parent body formation. OH-band absorption around 2.7 µm                  for this observation display a large variation of the 2.72-µm
also provides hints for hydration-dehydration states. The peak               feature. It is thus difficult to understand whether this increase is
position of OH-band evolves from 2.8 to 2.7 µm, attributed to Fe-            significant. Facet B of Otohime shows no increase in the band
rich to Mg-rich phases of phyllosilicates11.                                 depth (7.7% on Facet B and 7.9% for the reference spectrum, see
   In this study, we reveal the hydrated state of the main com-              Fig. 3c). Overall, a slight decrease is observed for this facet
ponents of Ryugu, which are inherited from its parent body,                  (Fig. 3c, right panel). Facet C of Otohime shows no significant
based on remote-sensing observations. Here, we show the least                changes in the band depth compared with the standard reference
processed materials by space weathering in Ryugu’s polar regions,            averaged spectrum (8.5% on Facet C and 8.3% for the reference
which are spectrally blue and associated with 0.7-µm band                    spectrum, see Fig. 3d). In contrast with the Small Carry-on
absorption. This finding suggests intensive aqueous alteration and            Impactor (SCI) crater observation15, no peak shift has been
subsequent heating up to 670 K (400 °C) of Ryugu’s parent body.              observed in the spectra for the polar regions.
                                                                                It is known that the 0.7-µm and 2.7-µm features can be easily
                                                                             deformed by either heating or space weathering16–18. Even
Results                                                                      though the absolute value of the 0.7-µm band depth has formal
Remote sensing observations. The Telescopic Optical Navigation               uncertainties ranging from 0 to 3%, the strong correlation with
Camera (ONC-T) is a multi-band imager that is equipped with                  the high latitude regions suggests the presence of the 0.7-µm band
seven band filters ranging wavelength from 0.40 to 0.95 µm12.                 absorption is real. Given that the blue materials show slightly
Figure 1 shows the spectral index images of both poles; visible              deeper 0.7-µm band absorptions on the polar regions where they
spectral slope (b–x; 0.48 µm to 0.86 µm) and 0.7-µm band                     are less irradiated by the Sun, we anticipate that heating or space
absorption (see “Methods”, subsection Image analyses). The 0.7-              weathering decreases the absorption features.
µm band absorption is attributed to Fe2+–Fe3+ charge transfer of
oxidized iron13 and is often used as a proxy for phyllosilicates
such as serpentine and saponite. Local variations in spectral slope          Solar heating and solar wind irradiation. To examine the cause
and 0.7-µm band absorption were observed. Spectrally blue                    of the distribution of blue materials with 0.7-µm band absorption,
(negative visible spectral slope) material is concentrated on both           the maximum temperature in an asteroidal year and the normalized

2                NATURE COMMUNICATIONS | (2021)12:5837 | https://doi.org/10.1038/s41467-021-26071-8 | www.nature.com/naturecommunications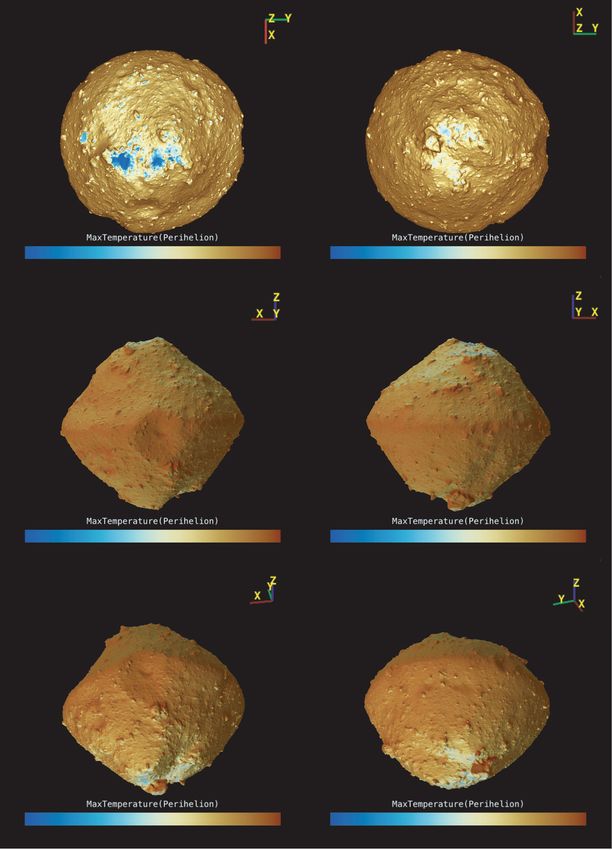
NATURE COMMUNICATIONS | https://doi.org/10.1038/s41467-021-26071-8                                                                           ARTICLE

                 a
                                                 200 m

                     0.01             0.02               0.03 -0.2   -0.1   0.0    0.1    0.2    0.3 0.0 0.2   0.4 0.6 0.8   1.0   1.2 1.4

                 b

                                             Facet A
                                                75 m

                     0.01             0.02               0.03 -0.2   -0.1   0.0    0.1    0.2    0.3 0.0 0.2   0.4 0.6 0.8   1.0   1.2 1.4

                 c

                                     Facet B

                                                75 m

                     0.01             0.02               0.03 -0.2   -0.1   0.0    0.1    0.2    0.3 0.0 0.2   0.4 0.6 0.8   1.0   1.2 1.4

                 d

                                        Facet C
                                                100 m

                     0.01             0.02               0.03 -0.2   -0.1   0.0    0.1    0.2    0.3 0.0 0.2   0.4 0.6 0.8   1.0   1.2 1.4

Fig. 1 I/F and color index maps of the both polar regions. a North pole. b–d Otohime Saxum at south pole (b: Facet A, c: Facet B, d: Facet C); (Left)
radiance factor (I/F) images, (Middle) b–x (0.48–0.86 µm) spectral slope map, (Right) 0.7-µm absorption depth map. Image ids used for this figure are
listed in Supplementary Table 1.

NATURE COMMUNICATIONS | (2021)12:5837 | https://doi.org/10.1038/s41467-021-26071-8 | www.nature.com/naturecommunications                           3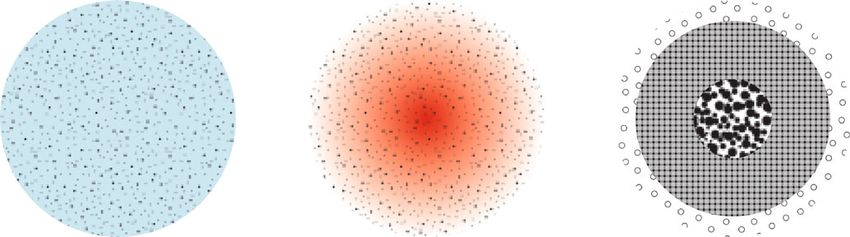
ARTICLE                                                                   NATURE COMMUNICATIONS | https://doi.org/10.1038/s41467-021-26071-8

                                                                               For example, at the heliocentric distance of 0.4 au, the maximum
                                                                               temperature of a large part of the surface could reach >570 K and
                                                                               the north polar region was kept
NATURE COMMUNICATIONS | https://doi.org/10.1038/s41467-021-26071-8 ARTICLE
1.10
a 1.00 300
Normalized Reflectance
1.05
Continuum Removed
250
0.98
Histogram Density
1.00 200
Reflectance
0.96
0.95 150
0.94 100
0.90
50
0.92
0.85 North Pole 0
Reflectance Spectrum of 26 October 2019
0.80 0.90 0.04 0.06 0.08 0.10 0.12
1.10 400
b 1.00
Normalized Reflectance
1.05
Continuum Removed
0.98 300
Histogram Density
Reflectance
1.00 0.96
200
0.95 0.94
0.90 100
0.92
0.85 Otohime Facet A 0.90 0
Reflectance Spectrum of 27 October 2019
0.04 0.06 0.08 0.10 0.12
0.80
1.10
c 1.00 20
1.05
Normalized Reflectance
Continuum Removed
0.98
Histogram Density
15
1.00
Reflectance
0.96 10
0.95
0.94
0.90 5
0.85 0.92
Otohime Facet B 0
Reflectance Spectrum of 27 October 2019
0.80 0.06 0.07 0.08 0.09 0.10 0.11 0.12
1.10
d 1.00 400
Normalized Reflectance
Continuum Removed
1.05
Histogram Density
0.98 300
Reflectance
1.00
0.96 200
0.95
0.94
0.90 100
0.85 0.92
Otohime Facet C 0
Reflectance Spectrum of 26 October 2019
0.90 0.06 0.07 0.08 0.09 0.10 0.11 0.12
0.80
1.8 2.0 2.2 2.4 2.6 2.8 3.0 3.2 2.60 2.65 2.70 2.75 2.80 2.85
Wavelength (µm) Wavelength (µm) Band Depth -- 2.72 µm
Fig. 3 Near-infrared observations for polar regions. (Left) Normalized NIRS3 reflectance spectra of the polar regions compared with the standard
reference spectrum outside of the polar regions. The spectra are normalized at 2.5 µm. The error bars are indicative of the standard deviation amongst the
spectra used to compute the average region of interest (black) spectrum and average standard reference spectrum (red). (Middle) Detail of the 2.72-µm
feature regions. We show the continuum removed band. The continuum is removed using 2.6 µm and 2.9 µm as anchor points67. The error bars are
indicative of the standard deviation amongst the spectra used to compute the average region of interest (black) spectrum and average standard reference
spectrum (red). (Right) Histogram distribution of the band depth for each day’s observation. All spectra in the day (red), spectra of the region of interest
(black). The vertical dashed lines represent the average value of each distribution. a North pole (photometrically corrected data). b Otohime Facet A (non-
photometrically corrected data). c Otohime Facet B (photometrically corrected data). d Otohime Facet C (photometrically corrected data).
Comparison with possible parent bodies and B-type asteroids. suggests that Ryugu could have originated from either the Polana or
We can also discuss the nature of Ryugu’s original parent body Eulalia families. Furthermore, the spectral properties of Otohime’s
based on the color changes induced by space weathering. Our blue facets are similar to those of Polana and Eulalia’s blue global
observations indicate that Ryugu has a stronger connection with average spectra (Fig. 7). The x (0.86 µm) and p (0.95 µm) spectro-
B-type (including both B and F types in Tholen’s taxonomy, the photometric values (Fig. 2) highlight a possible feature that can be
main difference is UV-blue absorption24) than C-type asteroids attributed to olivine-pyroxene mixtures. The comparison with other
because reddening is a relatively recent event on Ryugu. An asteroid asteroid spectra (Fig. 7) shows that in the wavelength interval
family whose members share similar orbital elements is formed by covered by x and p filters, Polana and Eulalia have a similar
catastrophic disruption of the original parent body. The observed behavior to Ryugu. In addition, a flat to upturn in the UV-blue
variation of b-x (0.40–0.86 µm) spectral slope is −0.17 µm−1 for the region is characteristics of F type in Tholen’s taxonomy, which is
north pole region compared to 0.10–0.12 µm−1 for the global mainly populated in the inner main belt24. Thus, Ryugu might be a
average and Otohime Facet C. The spectral slope range of the inner representative of those spectrally blue members of inner main belt.
main belt asteroids in the Eulalia and Polana families are within the B-type asteroids are common in the near-Earth asteroid
same range as the variation observed on Ryugu29, while the Erigone population (about 5% based on visible spectra30). The upturn
family members show more variation in the redder range. This in the UV-blue region is a peculiar feature highlighted in the
NATURE COMMUNICATIONS | (2021)12:5837 | https://doi.org/10.1038/s41467-021-26071-8 | www.nature.com/naturecommunications 5ARTICLE NATURE COMMUNICATIONS | https://doi.org/10.1038/s41467-021-26071-8
a North pole b South pole
0.000 0.057 0.114 0.171 0.229 0.000 0.057 0.114 0.171 0.229
c d
0.000 0.057 0.114 0.171 0.229 0.000 0.057 0.114 0.171 0.229
e f
Otohime Facet A Otohime Facet B
0.000 0.057 0.114 0.171 0.229 0.000 0.057 0.114 0.171 0.229
Fig. 4 Global distribution of solar photon dose averaged over one asteroidal year. This value is normalized by the photon dose experienced by a facet
perpendicular to the Sun at 1 au away. Thus, the color bars show non-dimensional value. a, b are nadir views from the north and south poles. c, d are the
views from (LAT, LON) = (0°, 90°) and (0°, 270°), respectively. e, f are the views from (−30°, 100°) and (−30°, 200°) to show Facets A and B of
Otohime Saxum. Photon dose distribution shows lower irradiation for the polar regions. Otohime’s Facet A shows very low irradiation due to the hill just in
front of it.
spectra of (3200) Phaethon31 and (101955) Bennu32 (Fig. 7). bright exogenic boulders on these two asteroids suggest the
Bennu is currently being investigated by the OSIRIS-REx different parent bodies at least for one generation5,36. Further-
spacecraft33. We cannot rule out that Bennu and Ryugu more, our new result suggests different space weathering
originated from the same parent body, considering their similar variations in visible wavelengths: Ryugu shows reddening, while
albedo, bulk density, and thermal inertia26,33–35. Although the Bennu shows bluing37. Also the fact that a region on Ryugu with
visible spectrum of Bennu closely matches that of Otohime’s blue a similar OH-band feature to Bennu has not been found suggests
material, Bennu shows a stronger 2.7-µm OH-band absorption a lower possibility that they originated from the same
than Ryugu and also a different band shape32. It was suggested parent body.
recently that the differences in degree of hydration can also have (3200) Phaethon, the target of the DESTINY + Mission38, also
been produced by one impact4. In contrast, the difference of the exhibits blue spectra in the visible wavelength range and turn-up
6 NATURE COMMUNICATIONS | (2021)12:5837 | https://doi.org/10.1038/s41467-021-26071-8 | www.nature.com/naturecommunicationsNATURE COMMUNICATIONS | https://doi.org/10.1038/s41467-021-26071-8 ARTICLE
a North pole b South pole
80 160 240 320 400 80 160 240 320 400
(K) (K)
c d
80 160 240 320 400 80 160 240 320 400
(K) (K)
e f
Otohime Facet A Otohime Facet B
80 160 240 320 400 80 160 240 320 400
(K) (K)
Fig. 5 Global distribution of maximum surface temperature at perihelion. a, b are nadir views from the north and south poles. c, d are the views from
(LAT, LON) = (0°, 90°) and (0°, 270°), respectively. e, f are the views from (−30°, 100°) and (−30°, 200°) to show Facets A and B of Otohime Saxum.
Maximum temperature shows low values at the north poleARTICLE NATURE COMMUNICATIONS | https://doi.org/10.1038/s41467-021-26071-8 Fig. 6 Comparison between observed spectrophotometric indexes and modeled values. a b–x slope value versus normalized photon dose. b 0.7-µm band absorption versus normalized photon dose. c b–x slope value versus peak temperature at perihelion. d 0.7-µm band absorption versus peak temperature at perihelion. The north polar observation (Fig. 1a) and the south pole observation (Fig. 1c) are shown with black and cyan markers, respectively. Observed spectrophotometric indexes are binned by every 0.1 for photon dose and every 10 K for peak temperature. Error bars indicate the standard deviation in each bin. Relative exposure time for a, b is calculated such that the most irradiated surface is defined as unity. Image ids used for this figure are listed in Supplementary Table 1. The presence and degree of both 0.7-µm and 2.7-µm features process could have resulted in a flat near-ultraviolet spectrum, a on Ryugu allows us to constrain the parent body thermal history weak 0.7-µm band absorption, and a decreased OH-band and water abundance. Previous global studies of Ryugu suggest absorption with peak position at 2.72 µm. Thus, scenario 1 with two scenarios for the main composition of Ryugu:3,6 (1) the connection to aqueously altered and thermally metamor- aqueously altered and thermally metamorphosed carbonaceous phosed CM-like material is more plausible. Because phyllosili- chondrite (ATCC including CY) material, (2) incipiently altered cates are completely decomposed at 870–970 K (600–700 °C)47, inter planetary-dust-particle-like, or cometary material. The 0.7- the maximum temperature that Ryugu’s parent body experienced µm band absorption is closely related to the amount of Fe-rich must have been lower than this level. Moreover, laboratory phyllosilicates10. Up to now, the 0.7-µm feature has been detected experiments on CM chondrites reported that although the 0.7-µm in spectra of CM chondrites, ATCCs and only one CR band absorption due to Fe-rich phyllosilicates drastically chondrite43,44. However, the CR chondrites usually display a decreases at ~570–670 K (300–400 °C)16,20, these phyllosilicates much higher reflectance45. The range of the 0.7-µm band depth are usually transformed into highly desiccated and disordered for CM chondrites and ATCCs are 0.5–6% and
NATURE COMMUNICATIONS | https://doi.org/10.1038/s41467-021-26071-8                                                                                  ARTICLE

                                                                                0.653, but subsequently experienced thermal metamorphism to a
                                                                                maximum of 570–670 K (300–400 °C). The uniformity in visible
                                                                                and near-infrared spectra3,6 implies either that there were no
                                                                                large displacements or differentiation between rock and ice par-
                                                                                ticles in the parent body even at high temperatures, or that dust
                                                                                and water were convecting as a mud ball55. However, possible
                                                                                heterogeneity in the parent body has been suggested by the
                                                                                Hayabusa2 Thermal Infrared Imager (TIR)35,42 and ONC-T
                                                                                measurements in anomalous regions, although the portion of
                                                                                Ryugu covered by these regions is very minor. Very high density
                                                                                and bright materials on Ryugu5,35 might have been caused by hot
                                                                                pressing occurring over only a minor part of parent body, pos-
                                                                                sibly in its center. Ryugu possesses an extremely porous upper-
                                                                                most layer which displays low reflectance and extremely low
                                                                                thermal inertia56. These properties suggest that Ryugu’s parent
                                                                                body might have been ~100 km in diameter and had layers with
                                                                                different degrees of thermal metamorphism (Fig. 8). The detailed
                                                                                thermal history will be addressed by returned sample analyses.
                                                                                However, the majority of the asteroid has been highly aqueously
                                                                                altered suggested by the 0.7-µm band absorption and later par-
                                                                                tially dehydrated by temperatures of up to 570–670 K. The
                                                                                highest temperature achieved by the decay of 26Al (half-life
                                                                                0.7 Myr) is sensitive to the accretion age of the parent body. In
                                                                                contrast, heating due to impact is less likely because it would
                                                                                accompany with impact-induced compaction4, which is incon-
                                                                                sistent with Ryugu’s highly porous boulder structure observed on
                                                                                Ryugu35,41. A planetesimal would have required a relatively high
                                                                                ratio of 26Al to achieve temperatures sufficiently high to cause
                                                                                thorough dehydration, corresponding to early accretion,
                                                                                2–2.5 Ma post Calcium-Aluminum-rich Inclusions2,57, while
                                                                                non-ATCC CM chondrites record low temperature aqueous
                                                                                reactions (typically 1000 K49,50,61 (Fig. 8). Although several works suggested the
                                                                                thermal metamorphism for these meteorites was likely caused by
                                                                                short-lived events, such as impacts or solar radiations49,62,63, the
                                                                                heating mechanism is currently poorly constrained yet. Ryugu’s
Fig. 7 Least processed region on Ryugu compared with spectrally blue            samples may be the first example of heating by primordial
asteroids. Spectral comparison of the north polar region (solid blue line)      radiogenic decay, as suggested by its highly porous nature. The
with the possible parent bodies, (142) Polana, (163) Erigone, and (495)         wide range of formation temperatures of CM chondrites and
Eulalia, the B-type near-Earth asteroid (3200) Phaethon and (101955)            Ryugu (250–670 K) provides constraints on the formation con-
Bennu. Spectra are normalized at 0.55 µm and offset by 0.3. Reflectance          ditions of water-rich carbonaceous asteroids in the early solar
spectra of (142) Polana, (163) Erigone, (495) Eulalia, (3200) Phaethon, and     system. Although the Fe-bearing phyllosilicates of Ryugu suggests
(101955) Bennu were obtained by refs. 25,68,69, and ref. 32, respectively.      a similar water/rock ratio to CM chondrites, the formation timing
Gray hatches for (142) Polana, (163) Erigone, and (495) Eulalia indicate        of Ryugu’s B-type parent body, possibly Polana or Eulalia, might
80% of the distribution of slope among their family members29,70. Gray          be earlier than CM chondrites’ parent bodies.
hatch for Phaethon indicates spectral variation over one rotation31.

                                                                                Methods
                                                                                Image analyses. Global spectral slope in Supplementary Fig. 1 was made based on
Alternatively, a currently unsampled carbonaceous chondrite that                the global observations at an altitude of 20 km on 12 July, 24 August 2018 and 24
experienced intensive hydration and subsequent heating would                    January 2019. The bias correction and the updated flatfield correction was applied
produce Ryugu’s unique spectral features. To summarize, the                     based on ref. 14. The digital count images were converted into radiance factor (I/F)
                                                                                images by the radiometric calibration12,64. All the I/F images were photometrically
weak 2.7-µm band absorption and presence of the 0.7-µm feature                  corrected to the standard geometry of (i, e, α) = (30°, 0°, 30°) based on the pho-
could be explained by aqueous and thermal alteration of a CM-                   tometry model by ref. 26 with the shape model of SFM_3M_v20200815 and SPICE
like precursor (scenario 1), which corresponds to Stage II in the               kernels (see “Data availability”), where i, e, and α are incidence, emission, and
thermal metamorphic stages defined by ref. 50 or an unsampled                    phase angles, respectively. The shape model was derived in the same manner as
                                                                                ref. 34 but using all the image from proximity operations around the asteroid. We
hydrated carbonaceous chondrite. CYs are not the best candidate                 used pixels with i < 70°, e ≤ 70°, and I/F > 0.005 in order not to introduce large error
for Ryugu’s material because they are typically heated >770 K                   by photometric correction and shadow regions. The b (0.48 µm)- to- x (0.86 µm)
(>500 °C) and are highly dehydrated52.                                          spectral slope was calculated as done by ref. 3. The bluest regions are found in the
   Oxygen isotopic compositions suggests that CI chondrites were                pole regions.
                                                                                    Following the global observations at an altitude of 20 km, Hayabusa2 conducted
formed with higher water/rock ratios than CM chondrites9,53,54.                 closer approaches to the pole region at an altitude of 5 km on 28 February, 1
Our results support that Ryugu’s parent body may have formed                    March, and 26 October 2019. Their phase angles were 17°, 17°, and 34°,
under similar water/rock ratio conditions as CM chondrites, 0.3–                respectively. The images were taken by ONC-T with 7-color filters (ul: 0.40 µm, b:

NATURE COMMUNICATIONS | (2021)12:5837 | https://doi.org/10.1038/s41467-021-26071-8 | www.nature.com/naturecommunications                                              9
ARTICLE NATURE COMMUNICATIONS | https://doi.org/10.1038/s41467-021-26071-8
Fig. 8 Hydrothermal history of Ryugu’s parent body. (Left) The parent body might consist of similar water/rock ratio to CM chondrites, but accreted with
earlier timing, 2–2.5 Ma after CAI, to achieve the thermal metamorphism. (Middle) After pervasive aqueous alteration to form a CM-like precursor which
included large amounts of Fe-bearing phyllosilicates, the parent body was dehydrated at 570–670 K (300–400 °C) due to heating by radioactive decay of
short-lived radionuclides (e.g., 26Al). (Right) Ultimately, Ryugu’s parent body consisted of several layers with different degrees of thermal metamorphism.
Different evidence were discovered in the previous studies5,15,41,56.
This ambiguity is due to the spectral uncertainty of standard stars used for the
radiometric calibration. However, spatial relative variation can be measured more
accurately based on the onground and inflight signal-to-noise assessments. More
specifically, the signal-to-noise ratio for one pixel is 200 for the reference
temperature at −30 °C12. At the reference temperature, shot noise is the dominant
factor and is random. Thus, we can reduce this random noise by 8 pixel by 8 pixel
or 15 pixel by 15 pixel binnings to obtain better SNR, leading the detection
capability of 0.7-µm to σ ~0.2% and σ ~0.1%, respectively, which is sufficient to
evaluate the 0.3–0.7% spatial difference of 0.7-µm band absorption. To extract high
accuracy spectra in Fig. 2, the average values were derived for the regions of interest
(ROIs, see Supplementary Fig. 4), 15 pixels by 15 pixels square for each site. The
error bars show the standard error inside of the ROIs.
Near infrared spectroscopic analysis. The near infrared spectrometer (NIRS3)
also observed the south pole on 27 February 2019, 27 July 2019, and 26 October
2019, where all three facets of Otohime boulder were observed, and the north pole
on 26 July 2019. For these observations, we extracted NIR spectra from both inside
the region of interest (e.g., Otohime facets and the north polar region) and outside
the region of interest as a standard for comparison. All four observations listed
above have been acquired at different phases of the proximity phase (Supple-
Fig. 9 Diurnal peak temperature at equinox as a function of heliocentric mentary Table 2). After 1st and 2nd TDs, the calibration standard, Radiometric
distance. North pole (black) and Otohime Facets (A: blue, B: cyan, C: red) Calibration Coefficient (RCC), had evolved, thus the standard reference spectrum
are compared with the Ryugu average (gray solid line) and the equatorial had to be recalculated for each observation. Also, for the observation of 27 Feb-
ruary, the spacecraft trajectory was not completely reconstructed to provide robust
ridge (gray dashed line). The equatorial ridge is defined as latitude from 5°S
observational information, such as incidence, and emission angles, and, as a result,
to 5°N. 570 K where phyllosilicates start to decompose is shown by black no photometry correction was applied to this dataset. We show in Supplementary
dashed horizontal line. North pole is kept lower than 570 K at 0.4 au, while Fig. 5 that the photometry correction does not affect the band depth, as a result for
Otohime Saxum is heated higher than 570 K. relative comparison we applied non-photometric corrected data. The averaged
reference spectra are calculated from a set of 100 spectra acquired on the same day,
that fall outside of the region of interest and that present similar geometry of
0.48 µm, v: 0.55 µm, Na: 0.59 µm, w: 0.70 µm, x: 0.86 µm, p: 0.95 µm). Some images
observations (similar incidence and emission angles).
were contaminated by stray light from the radiator, which was strongly related to
the attitude of the spacecraft with respect to the Solar radiation vector12. Because
the stray light can be reproduced according to the spacecraft attitude, the stray light Temperature and photon dose calculation. We calculated the average photon
could be removed using the stray light template obtained by the same spacecraft dose, as solar irradiation index, in the current orbit and pole orientation. We used
attitude during cruising phase. After the stray light removal, other calibrations were the SPICE toolkit with SPICE kernels to calculate the values. The shape model
conducted as same as the global dataset. Note that after the touchdowns (TDs) of constructed SHAPE_SFM_200k_v20200815 was used. The relative photon dose for
Hayabusa2 on Ryugu, the optical efficiency of ONC-T was degraded by ~7% and each polygon at any specific time can be calculated as cos(i)/(D/1au)2, where i is
2–5% at v band, respectively64. Because the effect is not strongly dependent on the incidence angle with respect to the Sun and D is distance between Ryugu and the
wavelengthNATURE COMMUNICATIONS | https://doi.org/10.1038/s41467-021-26071-8 ARTICLE
Fig. 10 Estimated heating temperature for Ryugu and ATCCs. Peak heating temperatures for meteorites were estimated by refs. 49, 50, 61. The thermal
metamorphism stages I–IV are defined by ref. 50. Stage 1: low heating temperature of 750 °C). The meteorites with
asterisks (*) are classified into CY, typically heated >770 K. Formation temperatures for CM chondrites were estimated by refs. 59–61.
The rotation period P of Ryugu is set at 7.63 h. The ecliptic longitude and latitude Code availability
of the rotational axis are given as 179.73 deg and −87.45 deg, respectively. The The code to calculate the asteroid’s surface temperature is available from Naoya Sakatani
positions of Ryugu are set at the perihelion (ecliptic coordinate relative to the Sun (sakatani@rikkyo.ac.jp) on reasonable request. The code to calculate the photon dose on
of [−0.251, 0.928, −0.055] in astronomical unit) and the aphelion ([0.315, −1.379, Ryugu is available at the JAXA DARTS (https://data.darts.isas.jaxa.jp/pub/hayabusa2/
0.076]) in the current orbit of Ryugu. Supplementary Fig. 3 (a and b) shows the paper/Tatsumi_2021/).
global distribution of the peak temperature at perihelion and aphelion.
Supplementary Fig. 3c shows the diurnal peak temperature at the heliocentric
distance of 0.2 au at equinox. Although the absolute value is different, the Received: 14 April 2021; Accepted: 10 September 2021;
distribution of relatively colder regions is the same as the current orbit. In this case,
most of the surface exceeds 570 K where the phyllosilicates start to be decomposed,
while some regions around poles are kept under 570 K (Fig. 9). If Ryugu had
experienced such close encounter to the Sun which was hypothesized in ref. 7, there
could be large difference in 2.7-µm band absorption corresponding to phyllosilicate
amount between polar regions and the typical Ryugu surface. Nevertheless, such a References
large difference was not observed (See Fig. 3). 1. Nathues, A. et al. Recent cryvolcanic activity at Occator crater on Ceres. Nat.
We also reconstruct fields-of-view of ONC-T observations based on spacecraft Astron. 4, 794–801 (2020).
attitudes and observation timings. We calculate temperature and photon dose for 2. Neumann, W. et al. Ceres’ partial differentiation: undifferenciated crust
each pixel of each image (see also Supplementary Movies). mixing with a water-rich mantle. Astron. Astrophys. 633, A117 (2020).
3. Sugita, S. et al. The geomorphology, color, and the thermal properties of
Aqueously altered and thermally metamorphosed carbonaceous chondrites Ryugu: implications for parentbody processes. Science 364, eaaw0422 (2019).
(ATCCs). Carbonaceous chondrites that show evidence of aqueous alteration 4. Michel, P. et al. Collisional formation of top-shaped asteroids and implications
followed by thermal metamorphism were first termed as ATCCs by43. ATCCs for the origins of Ryugu and Bennu. Nat. Commun. 11, 2655 (2020).
including CYs (Yamato-type) experienced by a wide range of thermal meta- 5. Tatsumi, E. et al. Collisional history of Ryugu’s parent body from bright
morphism up to temperature of total dehydration and recrystallization at >1020 K. surface boulders. Nat. Astron. 5, 39–45 (2021).
Several studies have estimated the heating temperature of ATCCs using X-ray 6. Kitazato, K. et al. The surface composition of asteroid 162173 Ryugu from
diffraction and electron probe microanalysis49,50,61, while Raman spectra of their Hayabusa2 near-infrared spectroscopy, Science 364, 272–275 (2019).
insoluble organic matter has also been used to classify the degree of heating63. 7. Morota, T. et al. Sample collection from asteroid (162173) Ryugu by
Figure 10 shows a summary of heating temperature of ATCCs from49,50,61 Hayabusa2: Implications for surface evolution. Science 368, 654–659 (2020).
compared with Ryugu’s estimated heating temperature. Thermal metamorphism 8. Tomeoka, K. & Buseck, P. R. Hydrated interplanetary dust particle linked with
was classified into four stages by50. Stage I samples do not show heat-induced carbonaceous chondrites? Nature 314, 338–340 (1985).
mineralogical changes in the X-ray diffraction patterns due to the low temperature 9. Zolensky, M. et al. Mineralogy and composition of matrix and chondrule rims
1020 K (>750 °C).
12. Tatsumi, E. et al. Updated inflight calibration of Hayabusa2’s optical
navigation camera (ONC) for scientific observations during the cruise phase.
Data availability Icarus 325, 153–195 (2019).
All Level 2d (I/F) images by ONC-T used in this study and derived data from images are 13. Vilas, F. & Gaffey, M. J. Phyllosilicate absorption features in main-belt and
available at https://data.darts.isas.jaxa.jp/pub/hayabusa2/paper/Tatsumi_2021/. The outer-belt asteroid reflectance spectra. Science 246, 790–792 (1989).
calibrated spectra by NIRS3 are available at Small Bodies Node of the NASA Planetary 14. Kameda, S. et al. Improved method of hydrous mineral detection by
Data System (https://sbnarchive.psi.edu/pds4/hayabusa2/hyb2_nirs3/data_calibrated/ latitudinal distribution of 0.7-µm surface reflectance absorption on the
proximity/). The input shape model, SPICE kernels and derived data supporting the asteroid Ryugu. Icarus 360, 114348 (2021).
findings of this study are available at https://data.darts.isas.jaxa.jp/pub/hayabusa2/paper/ 15. Kitazato, K. et al. Thermally altered subsurface material of asteroid (162173)
Tatsumi_2021/. Ryugu. Nat. Astron. 5, 246–250 (2021).
NATURE COMMUNICATIONS | (2021)12:5837 | https://doi.org/10.1038/s41467-021-26071-8 | www.nature.com/naturecommunications 11ARTICLE NATURE COMMUNICATIONS | https://doi.org/10.1038/s41467-021-26071-8
16. Hiroi, T. et al. Thermal metamorphism of the C, G, B, and F asteroids seen 49. King, A. J., Scholfield, P. F. & Russell, S. S. Thermal alteration of CM
from the 0.7 µm, 3 µm, and UV absorption strengths in comparison with carbonaceous chondrites: mineralogical changes and metamorphic
carbonaceous chondrites. Meteor. Planet. Sci. 31, 321–327 (1996). temperatures. Geochimica et. Cosmochimica Acta 298, 167–190
17. Lantz, C. et al. Ion irradiation of carbonaceous chondrites: a new view of space (2021).
weathering on primitive asteroids. Icarus 285, 43–57 (2017). 50. Nakamura, T. Post-hydration thermal metamorphism of carbovaceous
18. Matsuoka, M. et al. Space weathering simulation with low-energy laser chondrites. J. Mineralogical Petrological Sci. 100, 260–272 (2005).
irradiation of Murchison CM chondrite for reproducing micrometeoroid 51. Yang, B. & Jewitt, D. Identification of magnetite in B-type asteroids.
bombardments on C-type asteroids. Astrophys. J. Lett. 890, L23 (2020). Astronomical J. 140, 692 (2010).
19. Cremonese, G. et al. Micrometeoroids flux on the Moon. Astron. Astrophys. 52. King, A. J. et al. The Yamato-type (CY) carbonaceous chondrite group:
551, A27 (2013). analogues for the surface of asteroid Ryugu? Geochemistry 79, 125531
20. Garenne, A. et al. The abundance and stability of “water” in type 1 and 2 (2019).
carbonaceous chondrites (CI, CM and CR). Geochimica et. Cosmochimica 53. Clayton, R. N. & Mayeda, T. K. The oxygen isotope record in Murchison and
Acta 137, 93–112 (2014). other carbonaceous chondrites. Earth Planet. Sci. Lett. 67, 151–161
21. Yokota, Y. et al. Lunar photometric properties at wavelengths 0.5–1.6 µm (1984).
acquired by SELENE spectral profiler and their dependency on local albedo 54. Marrocchi, Y. et al. Origin and abundance of water in carbonaceous asteroids.
and latitudinal zones. Icarus 215, 639–660 (2011). Earth Planet. Sci. Lett. 482, 23–32 (2018).
22. Rubino, S. et al. Space weathering affects the remote near-IR identification of 55. Bland, P. A. & Travis, B. J. Giant convecting mud balls of the early solar
phyllosilicates. Planet. Sci. J. 1, 61 (2020). system. Sci. Adv. 3, e1602514 (2017).
23. Arakawa, M. et al. An artificial impact on the asteroid 162173 Ryugu formed a 56. Sakatani, N. et al. Anomalously porous, dark, and primitive boulders on
crater in the gravity-dominated regime. Science 368, 67–71 (2020). asteroid Ryugu. Nat. Astron. 5, 766–774 (2021).
24. Tholen, D. J. Asteroid Taxonomy from Cluster Analysis of Photometry, PhD 57. Castillo-Rogez, J. & Young, E. In Planetesimals: Early Differenciation and
thesis, (University of Arizona, 1984). Consequences for Planets, 92–114 (Cambridge University Press, 2017).
25. Bus, S. J. & Binzel, R. P. Phase II of the small main-belt asteroid spectroscopic 58. Fujiya, W. et al. Evidence for the late formation of hydrous asteroids from
survey—the observations. Icarus 158, 106–145 (2002). young meteoritic carbonates. Nat. Commun. 3, 627 (2012).
26. Tatsumi, E. et al. Global photometric properties of (162173) Ryugu. Astron. 59. Verdier-Paoletti, M. J. et al. Oxygen isotope constraints on the alteration
Astrophys. 639, A83 (2020). temperatures of CM chondrites Author links open overlay panel. Earth Planet.
27. Nakamura, T. et al. Irradiation-energy dependence on the spectral changes of Sci. Lett. 458, 273–281 (2017).
hydrous C-type astroids based on 4KeV and 20Kev He exposure experiments 60. Vacher, L. G. et al. Thermal evolution of hydrated asteroids inferred from
of Murchison CM chondrite. in 50th Lunar and Planetary Science Conference, oxygen isotopes. Astrophysical J. Lett. 882, L20 (2019).
TX, (2020). 61. Velbel, M. A. & Zolensky, M. E. Thermal metamorphism of CM chondrites: a
28. Thompson, M. S. et al. The effect of progressive space weathering on the dehydroxylation-based peaktemperature thermometer and implications for
organic and inorganic components of a carbonaceous chondrite. Icarus 346, sample return from asteroids Ryugu. Meteorit. Planet. Sci. 56, 546–585
113775 (2020). (2021).
29. de León, J. et al. Visible spectroscopy of the Polana-Eulalia family complex: 62. Yabuta, H. et al. A molecular and isotopic study of the macromolecular
Spectral homegeneity. Icarus 266, 57–75 (2016). organic matter of the ungrouped C2 WIS 91600 and its relationship to Tagish
30. Popescu, M. et al. Near-Earth asteroids spectroscopic survey at Isaac Newton Lake and PCA 91008. Meteor. Planet. Sci. 45, 1446–1460 (2010).
Telescope. Astron. Astrophys. 627, A124 (2019). 63. Quirico, E. et al. Prevalence and nature of heating processes in CM and C2-
31. Ohtsuka, K. et al. Full rotationally phase-resolved bisible reflectance ungrouped chondrites as revealed by insoluble organic matter. Geochimica et.
spectroscopy of 3200 Phaethon. Planet. Space Sci. 191, 104940 (2020). Cosmochimica Acta 241, 17–37 (2018).
32. Hamilton, V. E. et al. Evidence for widespread hydrated minerals on asteroid 64. Kouyama, T. et al. Post-arrival calibration of Hayabusa2’s optical navigasion
(101955) Bennu. Nat. Astron. 3, 332–340 (2019). cameras (ONCs): severe effects from touchdown events. Icarus 360, 114353
33. Lauretta, D. S. et al. The unexpected surface of asteroid (101955) Bennu. (2021).
Nature 568, 55 (2019). 65. Takita, J. et al. Feasibility and accuracy of thermophysical estimation of
34. Watanabe, S. et al. Hayabusa2 arrives at the carbonaceous asteroid 162173 asteroid 162173 Ryugu (1999 JU3) from the Hayabusa2 thermal infrared
Ryugu—a spinning top–shaped rubble pile. Science 364, 268–272 imager. Space Sci. Rev. 208, 287–315 (2017).
(2019). 66. Ishiguro, M. et al. Optical properties of (162173) 1999 JU3: in preparation for
35. Okada, T. et al. Highly-porous nature of a primitive asteroid revealed by the JAXA Hayabusa 2 sample return mission. Astrophys. J. 792, 74 (2014).
thermal imaging. Nature 579, 518–522 (2020). 67. Galiano, A. et al. Characterization of the Ryugu surface by means of the
36. DellaGiustina, D. N. et al. Exogenic basalt on asteroid (101955) Bennu. Nat. variability of the near-infrared spectral slope in NIRS3. Icarus 351, 113959
Astron. 5, 31–38 (2021). (2020).
37. DellaGuistina, D. N. et al. Variations in color and reflectance on the surface of 68. Xu, S. et al. Small main-belt asteroidspectroscopic survey: Initial results. Icarus
asteroid (101955) Bennu. Science 370, eabc3660 (2020). 115, 1–35 (1993).
38. Sarli, B. V. et al. Destiny+ trajectory design to (3200) phaethon. J. 69. de León, J. et al. Origin of the near-Earth asteroid Phaethon and the Geminids
Astronautical Sci. 65, 82–110 (2018). meteor shower. Astron. Astrophys. 513, A26 (2010).
39. Kareta, T. et al. Rotationally-resolved spectroscopic characterization of near- 70. Morate, D. et al. Compositional study of asteroids in the Erigone collisional
Earth object (3200) Phaethon. Astrophysical J. 156, 6 (2018). family using visible spectroscopy. Astron. Astrophys. 586, A216 (2016).
40. Takir, D. et al. Near-infrared observations of active asteoid (3200) Phaethon
reveal no evidence for hydration. Nat. Commun. 11, 2050 (2020).
41. Grott, M. et al. Low thermal conductivity boulder with high porosity identified
on C-type asteroid (162173) Ryugu. Nat. Astron. 3, 971–976 (2019). Acknowledgements
42. Shimaki, Y. et al. Thermophysical properties of the surface of asteroid 162173 The Hayabusa2 spacecraft was developed and built under the leadership of JAXA, with
Ryugu: Imfrared observations and thermal inertia mapping. Icarus 348, contributions from DLR and CNES, and in collaboration with NASA, Nagoya Univ.,
113835 (2020). Univ. of Tokyo, NAOJ, Univ. of Aizu, Kobe Univ. We also thank the engineers, Noriyasu
43. Cloutis, E. A. et al. Spectral reflectance properties of carbonaceous chondrites Inaba of JAXA and Tetsuya Masuda, Seiji Yasuda, Kouta Matsushima, and Takeshi
4: Aqueously altered and thermally metamorphosed meteorites. Icarus 220, Ohshima of NEC Corp. for their work on the Hayabusa2 mission, Koshi Sato at NEC
586–617 (2012). Corp. for ONC development, and Shingo Kashima at NAOJ for optical calculations. E.T.
44. Beck, P. et al. What is controlling the reflectance spectra (0.35–150 µm) of and S.S. were supported by KAKENHI from the JSPS Core-to-Core program “Interna-
hydrated (and dehydrated) carbonaceous chondrites? Icarus 313, 124–138 tional Network of Planetary Sciences” and the Astrobiology Center Program of National
(2018). Institutes of Natural Sciences (NINS) (Grant Number AB032004). T.H. acknowledges
45. Cloutis, E. A. et al. Spectral reflectance properties of carbonaceous chondrites: funding support from NASA’s Emerging World/Planetary Data Archiving and
3 CR chondrites. Icarus 217, 389–407 (2012). Restoration. D.D. and F.V. acknowledge funding through the NASA’s Hayabusa2 Par-
46. Takir, D. et al. Nature and degree of aqueous alteration in CM and CI ticipating Scientist Program (grant number NNX16AL34G), and NASA’s Solar System
carbonaceous chondrites. Meteorit. Planet. Sci. 48, 1618–1637 (2013). Exploration Research Virtual Institute 2016 (SSERVI16) Cooperative Agreement
47. Gualtieri, A. F., Giacobbe, C. & Viti, C. The dehydroxylation of serpentine (NNH16ZDA001N) for TREX (Toolbox for Research and Exploration). M.Z. was sup-
group minerals. Amerian Mineralogist 97, 666–680 (2012). ported by NASA’s Hayabusa2 Participating Scientist and Emerging Worlds Programs.
48. Tonui, E. et al. Petrographic chemical and spectroscopic evidence for thermal E.P. received a support from the Italian Space Agency (ASI). M.P. acknowledges a grant
metamorphism in carbonaceous chondrites. Geochimica et. Cosmochimica of the Romanian National Authority for Scientific Research - UEFISCDI, project number
Acta 126, 284–306 (2014). PN-III-P1-1.1-TE-2019-1504.
12 NATURE COMMUNICATIONS | (2021)12:5837 | https://doi.org/10.1038/s41467-021-26071-8 | www.nature.com/naturecommunicationsNATURE COMMUNICATIONS | https://doi.org/10.1038/s41467-021-26071-8 ARTICLE
Author contributions Peer review information Nature Communications thanks Timothy Glotch and the other,
E.T. coordinated co-author contributions, led the ONC-T data analyses and inter- anonymous, reviewer for their contribution to the peer review of this work. Peer reviewer
pretations. R.H., N.S., Y. Yokota, M. Yamada, S.S., T.M., S.K., H. Sawada., M.M., T.K., reports are available.
E.T., C.H., K.O., H.Suzuki., M.I., K.Y., M.H., Y.C., C.S., and M.S. performed the ONC-T
data acquisitions and reductions. L.R., C.P., and K.K. performed the NIRS3 data Reprints and permission information is available at http://www.nature.com/reprints
acquisitions and reductions. N.S., S.T., Y.S., and J.T. carried out the thermal modelling.
Nao. Hirata, Nar. Hirata, and Y. Yamamoto. contributed for the shape modelling and the Publisher’s note Springer Nature remains neutral with regard to jurisdictional claims in
estimation of spacecraft trajectory. S.T., M.H., Y. Tsuda, M. Yoshikawa, T.S., F.T., S.N., Y. published maps and institutional affiliations.
Takei, H.T., Y. Yamamoto, H. Sawada., and T.O. carried out the science operations of
spacecraft. Y. Tsuda and S.N. carried out the project general management. S.W. and M.
Yoshikawa carried out the project science management. S.T. developed and operated
Open Access This article is licensed under a Creative Commons
TIR. N.N. developed and operated LIDAR. E.T., S.S., N.S., L.R., M.M., R.H., T.M., T.N.,
Attribution 4.0 International License, which permits use, sharing,
M.Z., R.B., T.H., S.S., S.W., J.d.L., M.P., J.L.R.G., J.L., E.P., D.D., F.V., and H.C. con-
adaptation, distribution and reproduction in any medium or format, as long as you give
tributed for interpretation and writing the manuscript.
appropriate credit to the original author(s) and the source, provide a link to the Creative
Commons license, and indicate if changes were made. The images or other third party
Competing interests material in this article are included in the article’s Creative Commons license, unless
The authors declare no competing interests. indicated otherwise in a credit line to the material. If material is not included in the
article’s Creative Commons license and your intended use is not permitted by statutory
regulation or exceeds the permitted use, you will need to obtain permission directly from
Additional information the copyright holder. To view a copy of this license, visit http://creativecommons.org/
Supplementary information The online version contains supplementary material
licenses/by/4.0/.
available at https://doi.org/10.1038/s41467-021-26071-8.
Correspondence and requests for materials should be addressed to Eri Tatsumi. © The Author(s) 2021
NATURE COMMUNICATIONS | (2021)12:5837 | https://doi.org/10.1038/s41467-021-26071-8 | www.nature.com/naturecommunications 13You can also read