Water-Quality Distributions in the East Branch Black River near the Chemical Recovery Systems Site in Elyria, Ohio, 2021
←
→
Page content transcription
If your browser does not render page correctly, please read the page content below
Prepared in cooperation with the U.S. Environmental Protection Agency

Water-Quality Distributions in the East Branch
Black River near the Chemical Recovery
Systems Site in Elyria, Ohio, 2021

Open-File Report 2021–1086

U.S. Department of the Interior
U.S. Geological Survey
Water-Quality Distributions in the East
Branch Black River near the Chemical
Recovery Systems Site in Elyria, Ohio, 2021

By Jordan L. Wilson and Edward G. Dobrowolski

Prepared in cooperation with the U.S. Environmental Protection Agency

Open-File Report 2021–1086

U.S. Department of the Interior
U.S. Geological Survey
U.S. Geological Survey, Reston, Virginia: 2021

For more information on the USGS—the Federal source for science about the Earth, its natural and living resources,
natural hazards, and the environment—visit https://www.usgs.gov or call 1–888–ASK–USGS.
For an overview of USGS information products, including maps, imagery, and publications, visit
https://store.usgs.gov/.

Any use of trade, firm, or product names is for descriptive purposes only and does not imply endorsement by the U.S.
Government.
Although this information product, for the most part, is in the public domain, it also may contain copyrighted materials
as noted in the text. Permission to reproduce copyrighted items must be secured from the copyright owner.

Suggested citation:
Wilson, J.L., and Dobrowolski, E.G., 2021, Water-quality distributions in the East Branch Black River near the
Chemical Recovery Systems site in Elyria, Ohio, 2021: U.S. Geological Survey Open-File Report 2021–1086, 10 p.,
https://doi.org/10.3133/ofr20211086.

Associated data:
Wilson, J.L., and Dobrowolski, E.G., 2021, Autonomous underwater vehicle water-quality and sonar measurements in
the East Branch Black River near Elyria, Ohio, 2021: U.S. Geological Survey data release, https://doi.org/10.5066/
P9FEBCBY.

U.S. Geological Survey [USGS], 2021, USGS 04200500 Black River at Elyria OH, in USGS water data for the Nation:
U.S. Geological Survey National Water Information System database, accessed April 12, 2021, at https://doi.org/
10.5066/ F7P55KJN. [Site information directly accessible at
https:/ /waterdata.usgs.gov/oh/nwis/uv?site_ no=04200500.]

ISSN 2331-1258 (online)
iii

Acknowledgments
Funding for this work was provided by the U.S. Environmental Protection Agency Region 5.
v

Contents
Acknowledgments����������������������������������������������������������������������������������������������������������������������������������������iii
Abstract�����������������������������������������������������������������������������������������������������������������������������������������������������������1
Introduction����������������������������������������������������������������������������������������������������������������������������������������������������1
Purpose and Scope���������������������������������������������������������������������������������������������������������������������������������������1
Methods����������������������������������������������������������������������������������������������������������������������������������������������������������3
      Collection Methods������������������������������������������������������������������������������������������������������������������������������3
      Data Processing������������������������������������������������������������������������������������������������������������������������������������4
Distribution of Water-Quality Constituents and Characteristics�����������������������������������������������������������5
      Water Temperature������������������������������������������������������������������������������������������������������������������������������5
      Specific Conductance��������������������������������������������������������������������������������������������������������������������������5
      pH������������������������������������������������������������������������������������������������������������������������������������������������������������5
      Dissolved Oxygen���������������������������������������������������������������������������������������������������������������������������������5
Summary�������������������������������������������������������������������������������������������������������������������������������������������������������10
References Cited�����������������������������������������������������������������������������������������������������������������������������������������10

Figures
         1.     Map showing autonomous underwater vehicle mission paths, river centerline,
                and interpolation boundary at the Chemical Recovery Systems site and the
                East Branch Black River in Elyria, Ohio, March 22, 2021�������������������������������������������������������2
         2.     Diagrams and graphs showing three-dimensional path, plot, and longitudinal
                profiles of water temperature in the East Branch Black River near the Chemical
                Recovery Systems site in Elyria, Ohio, March 22, 2021����������������������������������������������������������6
         3.     Diagrams and graphs showing three-dimensional path, plot, and longitudinal
                profiles of specific conductance in the East Branch Black River near the
                Chemical Recovery Systems site in Elyria, Ohio, March 22, 2021����������������������������������������7
         4.     Diagrams and graphs showing three-dimensional path, plot, and longitudinal
                profiles of pH in the East Branch Black River near the Chemical Recovery
                Systems site in Elyria, Ohio, March 22, 2021����������������������������������������������������������������������������8
         5.     Diagrams and graphs showing three-dimensional path, plot, and longitudinal
                profiles of dissolved-oxygen concentration in the East Branch Black River near
                the Chemical Recovery Systems site in Elyria, Ohio, March 22, 2021����������������������������������9

Tables
         1. Summary of autonomous underwater vehicle missions at the Chemical
            Recovery Systems site at the East Branch Black River in Elyria, Ohio,
            March 22, 2021������������������������������������������������������������������������������������������������������������������������������3
         2. Coordinates of centerline used in the Waterbody Rapid Assessment Tool�����������������������4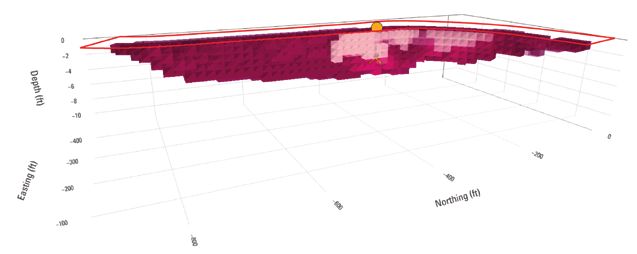
vi

     Conversion Factors
     U.S. customary units to International System of Units

                         Multiply                             By                     To obtain
                                                             Length
      inch (in.)                                             25.4        millimeter (mm)
      foot (ft)                                               0.3048     meter (m)
      yard (yd)                                               0.9144     meter (m)
                                                              Area
      acre                                              4,047            square meter (m2)

     International System of Units to U.S. customary units

                          Multiply                                  By                To obtain
                                                             Length
      meter (m)                                                 3.281    foot (ft)
      meter (m)                                                 1.094    yard (yd)
     Temperature in degrees Celsius (°C) may be converted to degrees Fahrenheit (°F) as follows:
     					°F = (1.8 × °C) + 32.
     Temperature in degrees Fahrenheit (°F) may be converted to degrees Celsius (°C) as follows:
     					°C = (°F – 32) / 1.8.

     Datum
     Vertical coordinate information is referenced to the North American Vertical Datum of 1988
     (NAVD 88).
     Horizontal coordinate information is referenced to the North American Datum of 1983 (NAD 83).

     Supplemental Information
     Specific conductance is given in microsiemens per centimeter at 25 degrees Celsius
     (µS/cm at 25 °C).
     Concentrations of chemical constituents in water are given in milligrams per liter (mg/L).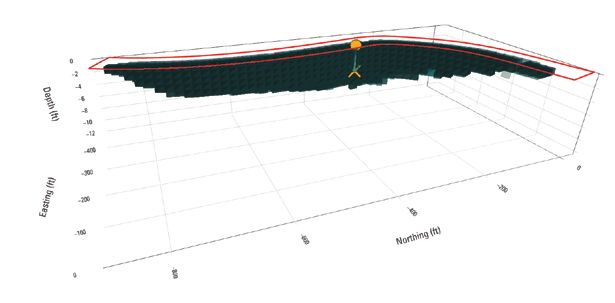
vii

Abbreviations
AUV     autonomous underwater vehicle
CRS     Chemical Recovery Systems
EPA     U.S. Environmental Protection Agency
sonar   sound navigation and ranging
USGS    U.S. Geological Survey
Water-Quality Distributions in the East Branch Black
River near the Chemical Recovery Systems Site in Elyria,
Ohio, 2021

By Jordan L. Wilson and Edward G. Dobrowolski

                                                                      The U.S. Environmental Protection Agency (EPA)
Abstract                                                        Region 5 requested technical assistance from the
                                                                U.S. Geological Survey (USGS) in support of EPA investiga-
      Autonomous underwater vehicles are uniquely designed      tions at the Chemical Recovery Systems (CRS) site in Elyria,
to provide spatially dense water-quality data along with        Ohio (fig. 1), to collect spatially dense water-quality and
bathymetry and velocimetry. The U.S. Environmental              bathymetry data in the East Branch Black River next to the
Protection Agency Region 5 requested technical assistance       CRS site. The site consists of 2.5 acres of former industrial
from the U.S. Geological Survey in support of ongoing inves-    uses including a manufactured gas plant, a coal company,
tigations at the Chemical Recovery Systems site to collect      and a spent solvent processing facility (EPA, 2021). The East
spatially dense water-quality and bathymetry data in the East   Branch Black River and Locust Street define the western and
Branch Black River in Elyria, Ohio. This report was prepared    eastern boundaries of the site, respectively. Land use to the
in cooperation with the U.S. Environmental Protection Agency    west of the East Branch Black River includes a mixture of res-
to present the results of the autonomous underwater vehicle     idential and commercial use, whereas the area directly north,
survey near the Chemical Recovery Systems site on March 22,     south, and east is industrial. Groundwater beneath the site
2021. Plots of distributions of water temperature, specific     is thought to discharge to the East Branch Black River, and
conductance, pH, and dissolved oxygen are presented that may    spatially dense distributions of water-quality data collected
help guide and focus future U.S. Environmental Protection       from an AUV may aid in interpreting the potential degree of
Agency efforts at the site to determine the degree of ground-   groundwater/surface-water interaction.
water/surface-water interaction.

Introduction                                                    Purpose and Scope
                                                                      This report was prepared in cooperation with the EPA
     Spatially dense sampling of water-quality constitu-        to present the results of an AUV survey at the CRS site on
ents and characteristics can be an important component in       March 22, 2021. Plots of spatial distributions of water tem-
understanding chemo-hydrodynamics in rivers and lakes.          perature, specific conductance, pH, and dissolved oxygen are
Autonomous underwater vehicles (AUVs) are uniquely              presented that may help guide and focus future EPA efforts at
designed to provide such spatially dense water-quality data     the site to determine the degree of groundwater/surface-water
along with bathymetry and velocimetry. Although designed        interaction.
originally for oceanographic applications, AUVs have been
used in several freshwater applications (Jackson, 2013a,
b; Jackson and Reneau, 2014; Vonins and Jackson, 2017;
Conrads and others, 2018; Crain and others, 2019).
2 Water-Quality Distributions in the East Branch Black River near the CRS Site in Elyria, Ohio, 2021
82°06’20” 82°06’18” 82°06’16” 82°06’14” 82°06’12” 82°06’10” 82°06’08”
Downstream
distance equals
0 feet
41°22’21”
41°22’19”
Effluent
pipe
LOCUST STREET
Surface-water
41°22’17” flow direction
41°22’16”
41°22’14”
downstream
distance equals
1,090 feet
Base map data from Google, 2021
Universal Transverse Mercator projection, zone 17 0 25 50 75 100 125 150 FEET
Horizontal coordinate information referenced to the North American Datum of 1983 (NAD 83)
Black 0 25 50 METERS
River
Map area
OHIO West East
Branch Branch EXPLANATION
Black Black
River River
Autonomous underwater vehicle path
Centerline of missions
Interpolation boundary
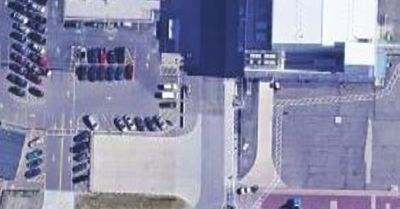
Figure 1. Autonomous underwater vehicle mission paths, river centerline, and interpolation boundary at the Chemical Recovery
Systems site and the East Branch Black River in Elyria, Ohio, March 22, 2021.Methods 3
Methods The temperature sensor underwent a National Institute of
Standards and Technology 5-point temperature check within
To provide the EPA with spatially dense water-quality a 12-month period before the study. Individual sensors for
data, the USGS collected data from a series of AUV missions specific conductance, pH, and dissolved oxygen were checked
within a stretch of the East Branch Black River and directly for calibration drift at the beginning of data collection. No for-
next to the CRS site on March 22, 2021, between about 12:30 mal calibration checks were done on the density and pressure
and 17:30 eastern standard time. Weather on March 22 was sensors. Methods from the manufacturer (YSI, Inc., 2017) and
generally sunny and warm, and all missions were done on those outlined in chapter 6 of the USGS national field manual
the falling limb of the hydrograph after a storm the previ- (USGS, variously dated) were followed for calibration checks.
Calibration drift was not checked at the end of data collec-
ous week on March 20, 2021 (USGS streamgage 04200500;
tion because the EXO1 sonde was damaged and broke off the
USGS, 2021). The following sections detail the methods used
EcoMapper AUV during the final mission and could not be
in the collection and processing of AUV data. All AUV data
retrieved.
discussed in this report or shown in plots, including water-
To characterize the vertical distribution of water-quality,
quality, bathymetry, and sound navigation and ranging (sonar)
several missions were planned to target different parts of the
imaging data, are available as a USGS data release (Wilson
water column (table 1). First, a surface mission was done to
and Dobrowolski, 2021).
delineate the rough boundary of the river that the AUV could
operate (mission 1). Next, a mission was done 1 meter below
Collection Methods the surface to obtain sonar imaging of the subsurface (mis-
sion 2). Next, undulating missions were done to characterize
A YSI IVER3 EcoMapper AUV (YSI, Inc., Yellow the vertical distribution of water quality in the river (mis-
Springs, Ohio) was used to collected water-quality and sions 3–6). Lastly, two missions were done at fixed heights of
bathymetric data at 1-second intervals. Water-quality data 1 and 0.5 meter above the bed of the river to best characterize
were measured with a YSI EXO1 sonde mounted in the nose water quality near the groundwater/surface-water interface
cone of the AUV and include water temperature (in degrees (missions 7 and 8, respectively). Throughout each survey,
Celsius), specific conductance (in microsiemens per cen- the AUV would partially collide with woody debris along
timeter at 25 degrees Celsius), pH (in standard units), and the sides of the river, and a remote control was used to take
dissolved oxygen (in milligrams per liter). Bathymetric data manual control and redirect the AUV out of the path of debris
were measured using an on-board depth sounder and pres- to ensure no data were lost, and the mission was subsequently
sure transducer. Sonar imaging was collected using a StarFish continued.
452F side-scan sonar unit (Blueprint Subsea, Cumbria, United An actively flowing effluent pipe originating from the
Kingdom) at 450 kilohertz set to a range of 30 meters. Further CRS site along the eastern boundary of the river reach was
details regarding the operation and description of the EcoMap- identified during the survey (fig. 1). The AUV surveyed near
per can be found in Jackson (2013a). the effluent pipe during mission 6.
Table 1. Summary of autonomous underwater vehicle missions at the Chemical Recovery Systems site at the East Branch Black River
in Elyria, Ohio, March 22, 2021.
Mission Depth, in
Mission name Type Dataset truncation
number meters
1 20210322-163344-CRS_Surface_0m-IVER3-3085 Surface 0 -
2 20210322-180945-CRS_Surface-IVER3-3085 Constant depth 1 -
3 20210322-190655-CRS_Undulate_1m_5m-IVER3-3085 Undulate 1–5 After index 2,226 in
dataset
4 20210322-193728-CRS_Undulate_1m_5m-IVER3-3085 Undulate 1–5 After index 1,050 in
dataset
5 20210322-200639-CRS_Undulate_1m_5m-IVER3-3085 Undulate 1–5 -
6 20210322-202300-CRS_Undulate_1m_5m-IVER3-3085 Undulate 1–5 -
7 20210322-205856-CRS_HFB_revised-IVER3-3085 Height from bot- 1 After index 1,316 in
tom dataset
8 20210322-213021-CRS_HFB_revised_halfm-IVER3-3085 Height from bot- 0.5 After index 212 in
tom dataset4 Water-Quality Distributions in the East Branch Black River near the CRS Site in Elyria, Ohio, 2021
Data Processing Table 2. Coordinates of centerline used in the Waterbody Rapid
Assessment Tool (WaterRAT; Huffman, 2021).
All AUV data were processed based on the routines [See the centerline in figure 1]
described in Jackson (2013a). Briefly, VectorMap (YSI, Inc.,
Yellow Springs, Ohio) was used to correct for positional Latitude Longitude
drift while underwater, and then the water-quality data were
41.3727344012951 −82.1030402894675
screened to identify spikes (outliers) that are uncharacteris-
tic of the natural system or that are four times the standard 41.3726529807683 −82.1035326897962
deviation of a 60-second moving window average of that data. 41.3725676830735 −82.1038661262392
Smoothing was not applied to the data. Finally, sensor lag (the 41.3724203506917 −82.1041491594990
response time of the sensor) was corrected using standard lag 41.3722846498137 −82.1043042462167
times of −2.1, −0.5, −7.1, and −5.5 seconds for water tempera- 41.3721120916080 −82.1044475560368
ture, specific conductance, pH, and dissolved oxygen, respec- 41.3718578850919 −82.1044338890198
tively, from Jackson (2013a) because of the large horizontal
41.3716721778911 −82.1044298653569
heterogeneity in water-quality constituents and characteristics,
which prevented calculation of lag times from vertical profiles. 41.3714189785656 −82.1044186491548
All data were then combined into a single comma-separated- 41.3711760901088 −82.1044214741315
values file (Wilson and Dobrowolski, 2021). 41.3709044142314 −82.1044307454883
Plots presented in this report were created using the 41.3706278535621 −82.1044338890198
Python software Waterbody Rapid Assessment Tool (Water- 41.3701948562928 −82.1046842086751
RAT; Huffman, 2021). WaterRAT was designed for ingest- 41.3727344012951 −82.1030402894675
ing AUV data and creating three-dimensional plots to better
visualize the data. Plots of measured water-quality constitu-
ents along the trajectory of the AUV, interpolated plots of the set at 90 feet. Water-quality and bathymetry readings contain-
average value of each constituent within each model cell, and ing outliers were removed before import into WaterRAT so
longitudinal cross-sections through the interpolated volume data would plot correctly; however, removing outliers some-
along the river are all provided as output from WaterRAT. A times left model boxes without data, resulting in missing areas
line feature, which is used to create the interpolation boundary in bathymetry and water-quality data. Plots of specific conduc-
(or the spatial extent to conduct three-dimensional interpola- tance, pH, and dissolved oxygen were constructed using all
tion) was created in QGIS (QGIS Development Team, 2021) combined data, and plots of water temperature were con-
roughly through the center of all the missions to use as input structed using mission 6 data because of the transient behavior
to WaterRAT (table 2). Step sizes, which set the size of each of temperature and concerns about thermal stratification of the
block in the interpolation in which constituents are averaged, river caused by air temperature, convoluting thermal stratifica-
of 20, 20, and 1 feet were used in the x, y, and z directions, tion caused by groundwater/surface-water interaction (table 1).
respectively; a vertical aspect ratio (or the ratio of the vertical Cross-sectional plots at 0, 20, 40, and 60 feet east of the cen-
to horizontal dimension) of 20 was used to better visualize the terline (fig. 1) were created to show the vertical distribution of
vertical distribution of constituents; and the river width was water-quality constituents near the CRS site.Distribution of Water-Quality Constituents and Characteristics 5
Distribution of Water-Quality largest values of specific conductance were near the effluent
pipe; otherwise, specific conductance was generally uniform
Constituents and Characteristics within the interpolation boundary (fig. 3).
Distribution plots of water temperature, specific conduc-
tance, pH, and dissolved oxygen collected using the AUV are pH
presented in this section. These plots are presented to support
future interpretation of potential groundwater/surface-water Values of pH ranged from 7.3 to 8.0 standard units. The
exchange at the CRS site and guide future efforts by the EPA smallest values of pH were near the effluent pipe, but the
at the site. distribution of pH within the interpolation boundary was gen-
erally uniform and alkaline (fig. 4). The largest values of pH
Water Temperature were farther away from effluent pipe.
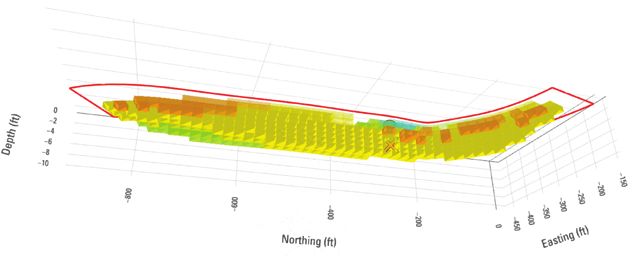
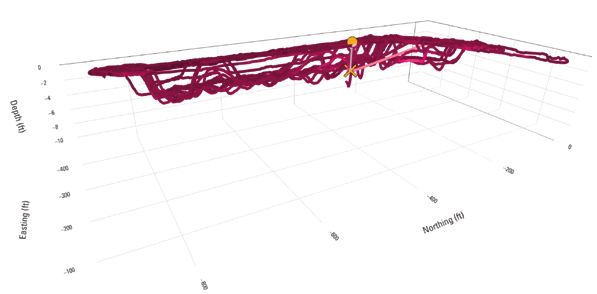
Water temperature ranged from 9.4 to 11.2 degrees
Celsius. The smallest values of water temperature were near Dissolved Oxygen
an effluent pipe on the northwest part of the CRS site (fig. 2).
The largest values of water temperature were near the water Dissolved-oxygen concentrations ranged from 4.4 to
surface. 11.2 milligrams per liter. The lowest dissolved-oxygen
concentrations were at the bottom of the river about 200 feet
upstream from the effluent pipe (fig. 5); otherwise, concentra-
Specific Conductance tions were fairly uniform and consistently greater than 10 mil-
Specific conductance ranged from 508 to 1,150 microsie- ligrams per liter. Low dissolved-oxygen concentrations were
mens per centimeter at 25 degrees Celsius. The smallest values measured when the AUV was surveying close to the bottom of
of specific conductance were near the water surface. The the river for a brief period.6 Water-Quality Distributions in the East Branch Black River near the CRS Site in Elyria, Ohio, 2021
A
Effluent
EXPLANATION
pipe
Temperature, in degrees Celsius
Less than 8.8
8.8 to 8.9
9.0 to 9.1
9.2 to 9.3
9.4 to 9.5
North 9.6 to 9.7
B 9.8 to 9.9
Downstream 10.0 to 10.1
Downstream distance equals
Effluent Interpolation 10.2 to 10.3
distance equals 0 feet
pipe boundary
1,090 feet 10.4 to 10.5
10.6 to 10.7
10.8 to 10.9
Equal to or greater than 11.0
Bathymetric surface
C D
Effluent pipe Effluent pipe
E F
Effluent pipe Effluent pipe
Figure 2. Three-dimensional path, plot, and longitudinal profiles of water temperature in the East Branch Black River near the
Chemical Recovery Systems site in Elyria, Ohio, March 22, 2021. A, path. B, plot. Profiles, C, 0 feet; D, 20 feet; E, 40 feet; and F, 60 feet
east of the mission centerline.Distribution of Water-Quality Constituents and Characteristics 7
A Effluent
pipe
EXPLANATION
Concentration of specific conductance,
in microseimens per centimeter at
25 degrees Celsius
Less than 510
510 to 512
513 to 514
515 to 516
517 to 518
Nor th
519 to 520
521 to 522
Effluent Interpolation Downstream
B pipe boundary distance equals 523 to 524
Downstream 0 feet
525 to 526
distance equals
1,090 feet 527 to 528
529 to 530
531 to 532
533 to 534
535 to 536
537 to 539
Equal to or greater than 540
Bathymetric surface
C D
Effluent pipe Effluent pipe
E F
Effluent pipe Effluent pipe
Figure 3. Three-dimensional path, plot, and longitudinal profiles of specific conductance in the East Branch Black River near the
Chemical Recovery Systems site in Elyria, Ohio, March 22, 2021. A, path. B, plot. Profiles, C, 0 feet; D, 20 feet; E, 40 feet; and F, 60 feet
east of the mission centerline.8 Water-Quality Distributions in the East Branch Black River near the CRS Site in Elyria, Ohio, 2021
A Effluent
pipe
EXPLANATION
pH, in standard units
Less than 5.5
5.5 to 5.6
5.7 to 5.8
5.9 to 6.0
Nor t h 6.1 to 6.2
6.3 to 6.4
Effluent Interpolation 6.5 to 6.6
B pipe boundary Downstream
distance equals 6.7 to 6.8
Downstream
distance equals 0 feet
6.9 to 7.0
1,090 feet
7.1 to 7.2
7.3 to 7.4
7.5 to 7.6
7.7 to 7.8
Equal to or greater than 7.9
Bathymetric surface
C D
Effluent pipe Effluent pipe
E F
Effluent pipe Effluent pipe
Figure 4. Three-dimensional path, plot, and longitudinal profiles of pH in the East Branch Black River near the Chemical Recovery
Systems site in Elyria, Ohio, March 22, 2021. A, path. B, plot. Profiles, C, 0 feet; D, 20 feet; E, 40 feet; and F, 60 feet east of the mission
centerline.Distribution of Water-Quality Constituents and Characteristics 9
A Effluent
pipe
EXPLANATION
Concentration of dissolved oxygen,
in milligrams per liter
Less than 9.0
9.0 to 9.1
9.2 to 9.3
9.4 to 9.5
th
Nor 9.6 to 9.7
9.8 to 9.9
B Effluent Interpolation Downstream
pipe boundary distance equals 10.0 to 10.1
0 feet
10.2 to 10.3
Downstream
distance equals 10.4 to 10.5
1,090 feet
10.6 to 10.7
10.8 to 10.9
Equal to or greater than 11.0
Bathymetric surface
C D
Effluent pipe Effluent pipe
E F
Effluent pipe Effluent pipe
Figure 5. Three-dimensional path, plot, and longitudinal profiles of dissolved-oxygen concentration in the East Branch Black River
near the Chemical Recovery Systems site in Elyria, Ohio, March 22, 2021. A, path. B, plot. Profiles, C, 0 feet; D, 20 feet; E, 40 feet; and
F, 60 feet east of the mission centerline.10 Water-Quality Distributions in the East Branch Black River near the CRS Site in Elyria, Ohio, 2021
Summary Jackson, P.R., and Reneau, P.C., 2014, Integrated syn-
optic surveys of the hydrodynamics and water-quality
Autonomous underwater vehicles are uniquely designed distributions in two Lake Michigan rivermouth mix-
to provide spatially dense water-quality data along with ing zones using an autonomous underwater vehicle
bathymetry and velocimetry. The U.S. Environmental and a manned boat: U.S. Geological Survey Scientific
Protection Agency Region 5 requested technical assistance Investigations Report 2014–5043, 33 p. [Also available at
from the U.S. Geological Survey in support of ongoing inves- https://doi.org/10.3133/sir20145043.]
tigations at the Chemical Recovery Systems site to collect QGIS Development Team, 2021, QGIS Geographic
spatially dense water-quality and bathymetry data in the East Information System (ver. 3.4.2, Maderia): Open Source
Branch Black River in Elyria, Ohio. This report was prepared Geospatial Foundation Project software, accessed
in cooperation with the U.S. Environmental Protection Agency April 2021 at https://qgis.org/.
to present the results of the autonomous underwater vehicle
survey near the Chemical Recovery Systems site on March 22, U.S. Environmental Protection Agency [EPA], 2021, Chemical
2021. Plots of distributions of water temperature, specific Recovery Systems Elyria, OH—Cleanup activities: U.S.
conductance, pH, and dissolved oxygen are presented that may Environmental Protection Agency web page, accessed
help guide and focus future U.S. Environmental Protection April 12, 2021, at https://cumulis.epa.gov/supercpad/
Agency efforts at the site to determine the degree of ground- SiteProfiles/index.cfm?fuseaction=second.Cleanup&id=
water/surface-water interaction. 0504384#bkground.
U.S. Geological Survey [USGS], [variously dated], National
field manual for the collection of water-quality data:
References Cited U.S. Geological Survey Techniques of Water-Resources
Investigations, book 9, chaps. A1–A10, accessed April 2021
Conrads, P.A., Journey, C.A., Petkewich, M.D., Lanier, T.H., at https://www.usgs.gov/mission-areas/water-resources/
and Clark, J.M., 2018, Characterization of water qual- science/national-field-manual-collection-water-quality-
ity in Bushy Park Reservoir, South Carolina, 2013–15: data-nfm?qt-science_center_objects=0#qt-science_
U.S. Geological Survey Scientific Investigations center_objects.
Report 2018–5010, 175 p. [Also available at U.S. Geological Survey [USGS], 2021, USGS 04200500
https://doi.org/10.3133/sir20185010.] Black River at Elyria OH, in USGS water data for the
Crain, A.S., Boldt, J.A., Bayless, E.R., Bunch, A.R., Young, Nation: U.S. Geological Survey National Water Information
J.L., Thomason, J.C., and Wolf, Z.L., 2019, Potential inter- System database, accessed April 12, 2021, at https://doi.org/
action of groundwater and surface water including autono- 10.5066/F7P55KJN. [Site information directly accessible at
mous underwater vehicle reconnaissance at Nolin River https://waterdata.usgs.gov/oh/nwis/uv?site_no=04200500.]
Lake, Kentucky, 2016: U.S. Geological Survey Scientific Vonins, B.L., and Jackson, P.R., 2017, Response of cur-
Investigations Report 2019–5075, 36 p. [Also available at rents and water quality to changes in dam operations
https://doi.org/10.3133/sir20195075.] in Hoover Reservoir, Columbus, Ohio, August 24–28,
Huffman, B., 2021, Waterbody Rapid Assessment Tool (Water- 2015: U.S. Geological Survey Scientific Investigations
RAT) (ver. 1.0.0): GitHub, Python application, accessed Report 2017–5027, 62 p. [Also available at
March 20, 2021, at https://github.com/bhuffman-usgs/ https://doi.org/10.3133/sir20175027.]
waterrat. Wilson, J.L., and Dobrowolski, E.G., 2021, Autonomous
Jackson, P.R., 2013a, Circulation, mixing, and trans- underwater vehicle water-quality and sonar measure-
port in nearshore Lake Erie in the vicinity of Villa ments in the East Branch Black River near Elyria, Ohio,
Angela Beach and Euclid Creek, Cleveland, Ohio, 2021: U.S. Geological Survey data release, https://doi.org/
September 11–12, 2012: U.S. Geological Survey Scientific 10.5066/P9FEBCBY.
Investigations Report 2013–5198, 34 p. [Also available at YSI, Inc., 2017, EXO user manual advanced water quality
https://doi.org/10.3133/sir20135198.] monitoring platform: YSI, Inc., 153 p., accessed April 2021
Jackson, P.R., 2013b, Integrated synoptic surveys using at https://www.ysi.com/file%20library/documents/manuals/
an autonomous underwater vehicle and manned boats: exo-user-manual-web.pdf.
U.S. Geological Survey Fact Sheet 2013–3018, 4 p. [Also
available at https://doi.org/10.3133/fs20133018.]For more information about this publication, contact: Director, USGS Central Midwest Water Science Center 1400 Independence Road Rolla, MO 65401 573–308–3667 For additional information, visit: https://www.usgs.gov/centers/cm- water Publishing support provided by the Rolla Publishing Service Center
Wilson and Dobrowolski—Water-Quality Distributions in the East Branch Black River near the CRS Site in Elyria, Ohio, 2021—OFR 2021–1086
https://doi.org/10.3133/ofr20211086
ISSN 2331-1258 (online)You can also read