Water for a Healthy Country - Land and Water
←
→
Page content transcription
If your browser does not render page correctly, please read the page content below

Water for a Healthy Country

Risks to the Shared Water
Resources of the Murray-Darling
Basin
Part II in a two part series on the shared water resources of the Murray-Darling
Basin prepared for the Murray-Darling Basin Commission

MDBC Publication 22/06

February 2006

Albert van Dijk, Ray Evans, Peter Hairsine, Shahbaz Khan, Rory Nathan, Zahra Paydar, Neil Viney, Lu
Zhang
Published by        Murray-Darling Basin Commission
Postal Address      GPO Box 409, Canberra ACT 2601
Office location     Level 5, 15 Moore Street, Canberra City
                    Australian Capital Territory
Telephone           (02) 6279 0100 international + 61 2 6279 0100
Facsimile           (02) 6248 8053 international + 61 2 6248 8053
E-Mail              info@mdbc.gov.au
Internet            http://www.mdbc.gov.au

For further information contact the Murray-Darling Basin Commission office on (02) 6279 0100

This report may be cited as: Van Dijk, A. et.al 2006 Risks to the Shared Water Resources of the Murray-Darling
Basin, Murray-Darling Basin Commission, Canberra
MDBC Publication No. 22/06
ISBN 1 921038 88 8
Copyright Murray-Darling Basin Commission and CSIRO 2006

This work is copyright. Graphical and textual information in the work (with the exception of photographs and the
MDBC logo) may be stored, retrieved and reproduced in whole or in part, provided the information is not sold or
used for commercial benefit and its source A Systems View on Water in the Murray-Darling Basin - 2. Risks to Our
Shared Water Resources is acknowledged. Such reproduction includes fair dealing for the purpose of private study,
research, criticism or review as permitted under the Copyright Act 1968. Reproduction for other purposes is
prohibited without prior permission of the Murray-Darling Basin Commission or the individual photographers and
artists with whom copyright applies.

To the extent permitted by law, the copyright holders (including its employees and consultants) exclude all liability to
any person for any consequences, including but not limited to all losses, damages, costs, expenses and any other
compensation, arising directly or indirectly from using this report (in part or in whole) and any information or
material contained in it.

The contents of this publication do not purport to represent the position of the Murray-Darling Basin Commission.
They are presented to inform discussion for improvement of the Basin's natural resources.

Important Disclaimer:

CSIRO advises that the information contained in this publication comprises general statements based on scientific
research. The reader is advised and needs to be aware that such information may be incomplete or unable to be used
in any specific situation. No reliance or actions must therefore be made on that information without seeking prior
expert professional, scientific and technical advice. To the extent permitted by law, CSIRO (including its employees
and consultants) excludes all liability to any person for any consequences, including but not limited to all losses,
damages, costs, expenses and any other compensation, arising directly or indirectly from using this publication (in
part or in whole) and any information or material contained in it.

Acknowledgements:

This review was commissioned and funded by the Murray Darling Basin Commission, and prepared by CSIRO Land
and Water as part of the Water for a Healthy Country National Flagship Program. It includes contributions from Rory
Nathan of Sinclair Knight Merz, and Ray Evans of Salient Solutions Inc.

Water for a Healthy Country is one of six National Research Flagships established by CSIRO in 2003 as part of the
National Research Flagship Initiative. Flagships are partnerships of leading Australian scientists, research
institutions, commercial companies and selected international partners. Their scale, long time-frames and clear focus
on delivery and adoption of research outputs are designed to maximise their impact in key areas of economic and
community need. Flagships address six major national challenges; health, energy, light metals, oceans, food and
water. The Water for a Healthy Country Flagship is a research partnership between CSIRO, state and Australian
governments, private and public industry and other research providers. The Flagship aims to achieve a tenfold
increase in the economic, social and environmental benefits from water by 2025. For more information about Water
for a Healthy Country Flagship visit or the National Research Flagship Initiative at www.csiro.au.
Foreword
This report and its companion report, The Shared Water Resources of the Murray-Darling Basin and have
been prepared by CSIRO to inform discussion on matters that have the potential to affect the shared
water resources of the Basin.

The Murray-Darling Basin Ministerial Council is implementing a number of major strategies to
improve the environmental and economic sustainability of the Murray-Darling Basin. These strategies
include the Cap on Diversions, which is a limit on the volume of water which can be diverted from the
Basin rivers for consumptive uses and the Living Murray, which is, as a first step, undertaking actions
to achieve environmental benefits for six significant ecological assets along the River Murray. The
success of both these strategies, as well as the Ministerial Council’s other Basin strategies, is
dependent upon the quantity and quality of water in the Basin’s rivers.

In 2004, the Ministerial Council directed the Murray-Darling Basin Commission to investigate possible
risks to the shared water resources of the Basin. The Commission identified six risks it considered
warranted immediate investigation – climate change, increased numbers of farm dams, increased
groundwater use, bushfires, afforestation (large scale tree plantings) and reduced return water flow
from irrigation. These two reports produced by the CSIRO are a compilation of information on the
shared water resources and on the six risks of immediate concern.

Work is continuing through the Commission and its partner governments to better understand how
the six risks might impact upon the Basin’s shared water resources, to identify actions the
governments and communities of the Basin can take to reduce the level of risk or lessen the potential
impact and to identify other potential risks.

This work is an important part of the Murray-Darling Basin Ministerial Council and Commission’s
business and it is essential for the sustainable management of the shared water resources of the
Murray-Darling Basin.

Wendy Craik
Chief Executive
Murray-Darling Basin Commission

                                                                                                        3
Table of Contents

Foreword ………………………………………………………………………….                                                              3
Table of Contents …………………………………………………………………                                                         4
Summary …………………………………………………..………………………                                                              6

Risks to our water resources ……………………………………………………                                                   7
     Why are risks on the agenda? ...............................................................   7

Climate change …………………………………………………………………..                                                          9
     Is the Basin climate changing? ……………………………………….                                                9
     Future climate change ………………………………………………..                                                     11
     What will happen to our water resources? …………………………                                            11
     Changes to flow regime ………………………………………………                                                      12
     Water security …………………………………………………………                                                          12
     River ecology …………………………………………………………..                                                         13

Afforestation ……………………..………………………………………………                                                          14
     Afforestation on the increase …………………………………………                                                 14
     How do trees affect our water resources? …………………………..                                          14
     Changes in flow regime with afforestation …………………………                                           16
     Changes in water quality ……………………………………………..                                                   17

Groundwater extraction ……………………..…………………………………                                                      19
     Groundwater: an important resource ……………………………….                                               19
     How is stream flow lost to groundwater pumping? ……………….                                        20
     Impacts differ between regions ………………………………………                                                 21
     What will happen to our water resources? …………………………                                            22
     River health and water quality ……………………………………….                                                22

Irrigation water management ……………………..……………………………                                                   23
     How does irrigation water use affect the water cycle? ……………..                                  23
     How will our water resources be affected? ………………………….                                          24
     How is water quality affected? ……………………………………….                                                25

4
Farm Dams ……………………..……………………..………………………….                       27
      Dams in the Murray-Darling Basin ……………………..……………          27
      How do farm dams affect our water resources? ……………………..   29
      Changes to river flow regimes …………………………………………            30
      River health and water quality …………………………………………           31

Bushfires ……………………..……………………..………………………………                      32
      Bushfires in the Basin ……………………..……………………………..            32
      Bushfires and water resources ……………………..…………………..         32
      Changes to river flow regime ………………………………………….            34
      River health and water quality ………………………………………..          34

Bringing the risks together ……………………..……………………………….             37
      Climate affects the whole system ……………………………………..         38

Risks to water quality and ecosystem health ………………………………….      40
      Stream salinity ……………………..……………………………………                  40
      Pollutants and algal blooms ……………………………………………             40
      River ecology ……………………..……………………………………..                  40
      Wetlands ……………………..………………………………………….                      41

Knowledge gaps ……………………..……………………..…………………….                    42
List of Figures …………………………………………………………………….                     44
References …………………………………………………………………………                         46

                                                                     5
Summary
                                                 It should be noted, however, that even
This is the second in a series of two reports
                                                 relatively small risk amounts (in the
on the shared water resources of the
                                                 vicinity of 100 GL per year) are equivalent
Murray-Darling Basin. The first report
                                                 to one-fifth of the water which the Murray-
entitled The Shared Water Resources of the
                                                 Darling Basin Ministerial Council is seeking
Murray-Darling Basin provides an overview
                                                 to recover under its Living Murray
of the hydrology of the Murray-Darling
                                                 Initiative.
Basin and the links between hydrology and
the key strategies of the Murray-Darling         Whilst there are limitations to the degree to
Basin Ministerial Council. This second           which the risks can be summed, evidence
report is a summary of recent preliminary        suggests a likely impact on stream flow in
work undertaken to improve our                   20 years time of between 2,500 and 5,500
understanding of potential future changes        GL/year. Given an average annual run off
to the shared water resources of the Basin       of 24,000 GL, the risks clearly have the
and the risks those changes might pose.          potential to significantly affect the quantity
                                                 of the shared water resource.
There are a number of significant changes
to the Basin environment that have the           The risks might not only affect water
potential to alter the quantity and quality of   volumes but also water security and water
the Basin’s shared water resources, that is,     quality. The impact of the risks on river
they pose a risk to the shared water             salinity is the balance result of changes in
resources. It should be remembered that          salt mobilisation and changes in stream
risks are not forgone conclusions and that       flow. The ongoing trends in climate,
our understanding of the how the risks           afforestation    and     irrigation   water
might impact upon the Basin is by no             management have a beneficial impact on
means complete.                                  salt mobilisation in areas that are more
                                                 important as salt sources than as water
Initial evidence suggests that climate
                                                 sources, but the opposite effect elsewhere.
change,      afforestation,     groundwater
                                                 Farm dams intercept fresh overland flows
extraction, changes to irrigation water
                                                 and thus are more likely to increase stream
management, farm dams and bushfires are
                                                 salinity.
all potential risks in that they may reduce
the volume of water in the rivers and            It is unclear whether river pollutant
streams of the Murray-Darling Basin.             concentrations are likely to increase or
                                                 decrease in future. More efficient irrigation
Initial evidence suggests climate change
                                                 water management and changes towards
poses the greatest risk to our shared water
                                                 more vegetation in the landscape are both
resources in volume terms. Climate change
                                                 generally beneficial to water quality, but
could potentially reduce stream flow by
                                                 may not be enough to offset possible
1,100 GL in 20 years (5% of annual flow)
                                                 reductions in flows. Algal blooms and
and by 3,300 GL in 50 years (15% of annual
                                                 pollution associated with bushfires may be
flow).
                                                 further increased in a changing climate.
The impact from farm dams will depend on
                                                 The Murray-Darling Basin Commission
the effectiveness of farm dam legislation.
                                                 (MDBC) and its partner agencies are
The potential reduction in stream flow from
                                                 currently undertaking further work to
afforestation and groundwater pumping in
                                                 better define the potential risks to the
20 years are estimated to be one-third and
                                                 shared water resources and to better inform
one-half of the impacts of climate change,
                                                 management of the Basin’s shared
respectively. The impact of bushfires and
                                                 resources.
irrigation management changes is expected
to be smaller again.

6
Risks to our Water Resources
• The six risks by affecting water
Why are risks on the volumes, also affect water security and
quality. They therefore threaten
agenda? environmental sustainability and
economic sustainability.
Water is a scarce resource in the Murray-
Darling Basin and one for which there is • The identified risks will not affect
considerable demand. As was discussed in stream flow evenly across the Basin.
the first report of this two part series, the
success of the existing MDBC strategies • The identified risk factors will
depends upon having flows to manipulate. potentially have different impacts at
Should flows diminish this will have different scales.
implications for the existing strategies.
• Most of the six risks do not act in
Reduced flows will also have implications separation, but can affect each other
for the existing users of the Basin’s shared (Figure 1). Thus the total impact on
water resources. annual river flows cannot be equated to
their sum, but may be less or more
Factors which could potentially diminish severe.
flow therefore represent “risks” to the
business of the Murray-Darling Basin
Ministerial Council.
In 2003, the MDBC commissioned a study
to make a preliminary assessment of factors
that might potentially impact upon the
shared water resources of the Basin 1 .
The factors that were assessed were:
• climate change;
• changes in stream flow due to
afforestation (large scale tree planting);
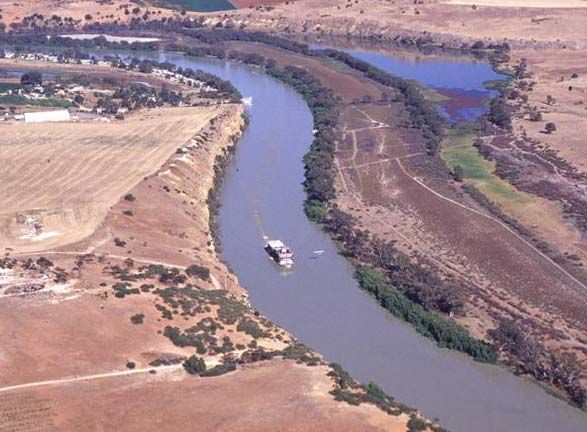
Figure 1. The River Murray near Renmark, SA.
Future flows may be affected by a range of
• groundwater extraction; interacting risks.
• irrigation water management; In the remainder of this report, we try to
answer the following questions, for each of
• farm dams; and
the risks:
• bushfires.
• What are the past and future changes
The study highlighted that the combined that underlie this risk? How is this risk
impact of these six factors has the potential created? Where is it most important?
to significantly reduce the volume of water
• How does it threaten our future water
in the streams of the Murray-Darling Basin.
resources and water security? How
From the preliminary study and work much will our total water resources be
completed by the MDBC and its partner affected? Are there differences between
governments a number of aspects of the seasons, and between high and low
risks have become evident: flows?
7
•   How does it affect water quality, such     •   How will the six risks together affect
    as stream salinity and river pollutants?       Basin strategies that aim to improve
    Will it impact on river health?                water quality and river health?

After these separate risk reviews, we          •   Where are the largest gaps in our
consider:                                          understanding? What new data,
                                                   knowledge and model tool
•   Which are the greatest risks to total          development do we need to better
    water resources, and can the risks             manage the six risks?
    simply be added?

8
Climate change
                                                  Furthermore, a study in New South Wales
                                                  found that the frequency of extremely high
Is the Basin climate                              temperatures has increased since 1957. It is
changing?                                         likely that this has been the case across the
                                                  Basin. In addition the frequency of frosts
There has been a sustained and statistically      and the length of frost seasons have both
unambiguous       increase    in      mean        declined 3 .
temperatures across the Basin7. Figure 2
shows rises in the mean Basin temperature         Rainfall varies strongly from
between 1961 and 1990 and the level of            year to year
difference from that mean temperature for
each year.                                        Rainfall in the Basin has always been
                                                  characterised by large differences between
                                                  years, decades and centuries. These
                                                  fluctuations in rainfall have important
                                                  effects on water resources, agricultural
                                                  production and ecosystem health. This high
                                                  natural variability, combined with the
                                                  relatively short rainfall record, also makes
                                                  it much harder to determine trends in
                                                  rainfall with statistical confidence, when
                                                  compared to the clearer trends in
                                                  temperature (Figure 3).

Figure 2. Annual anomalies (based on 1961-1990
averages) of mean temperature in the Basin. The
line shows the 11-year moving average. (Source:
                     7
Bureau of Meteorology )

It is evident from Figure 2 that mean
temperatures across the Basin have risen at
a rate of 0.17 ºC per decade since 1950.
Similar changes have been found in
minimum        and     maximum        daily
temperatures, and in seasonal average
temperatures. These increases are similar to
the changes in average global temperature.        Figure 3. Annual precipitation across the Basin.
The Inter-governmental Panel on Climate           The line shows the 11-year moving average.
                                                                                 7
Change has ascribed this global warming to        (Source: Bureau of Meteorology )
the    increase    in   greenhouse      gas       The only change in rainfall trend that is
concentrations7.                                  evident from Figure 3 is the change in
There are some regional and seasonal              rainfall climate around 1950, with an
differences in temperature increases.             overall increase in average annual rainfall
Increases in mean annual temperature tend         of about 15% (almost 70 mm per year) but
to be slightly greater (more than 0.2 ºC per      with greater variability between years.
decade) in the northern parts of the Basin        Figure 3 suggests little, if any, trend in
and lower (less than 0.1 ºC per decade) in        annual rainfall in the Basin since 1950.
the southeast. There is also some evidence        Strictly speaking, a reduction in annual
that the warming is greater at high               rainfall of 10 mm per decade can be
elevation than at lower elevation 2 .             calculated, but this is not statistically
                                                  significant.

                                                                                                9
There is, however, increasing evidence of a
substantial and sustained reduction in                                Summer rainfall
rainfall during the past nine years across
many parts of southern Australia. This is
possibly due to a combination of natural
and human causes although is remains
unclear which is the dominant cause 4 .

Regional and seasonal rainfall
changes                                                               Autumn rainfall
Although there is no clear trend in annual
rainfall averaged across the Basin, there are
some rather strong regional trends in
annual and seasonal rainfall (Figure 4).

Since 1950 rainfall decreases of up to 50 mm
per decade have occurred in the eastern
and southern parts of the Basin. These are
among the largest observed decreases in
any part of Australia.                                                 Winter rainfall

Most of the decline observed in the
southern part of the Basin is because of
lower summer and winter rainfall.
Decreases in autumn rainfall of up to 15
mm per decade were measured in the
headwaters    of     the    Murray     and
Murrumbidgee rivers. In contrast, some of
the dry western parts of the Basin have                                Spring rainfall
experienced rainfall increases of up to 10
mm per decade.

Averaged over the entire Basin for the
period 1950–2004, the most substantial
rainfall decreases have occurred in summer
(15 mm per decade) and the smallest
changes in spring (1 mm per decade), but
neither is statistically significant.
                                                                    Total annual rainfall
By contrast, in the past 15 years or so, there
have been statistically significant and
substantial decreases in summer rainfall
(by 50 mm per decade) and autumn rainfall
(by 65 mm per decade). It is too soon to tell
how persistent these changes will be. Also,
it is not yet clear whether the frequency and
intensity of extreme rainfall events has
changed4,6.

                                                 Figure 4. Observed trends in seasonal and annual
                                                 rainfall the period 1950–2004. Units are the rate of
                                                 change in millimetres per decade. (Source:
                                                                         7
                                                 Bureau of Meteorology .)

10
to decrease substantially, reduced rainfall
Future climate change intensity is predicted. Even then, it is
possible that the intensity of the very large
To predict future climate, researchers now events will be greater, especially in autumn
often independently use different models and winter 5,6 .
and model assumptions, and combine the
predictions to reduce and quantify the
uncertainty. Assumptions relate not only to A double impact: potential
the way the atmosphere and earth surface evaporation may also increase
behave, but also include different scenarios
Most studies predict an increase in
of future greenhouse gas emissions. The
potential evapotranspiration (PET, a
result is usually a reasonably wide band of
reference measure of water use when water
possible outcomes. Because climate
supply is unlimited). In contrast to the
prediction models are developed and tested
temperature predictions, one study
against measured climate patterns, they
predicted a regional trend in PET increase
tend to reinforce trends that have already
from east to west, rather than from north to
been observed2.
south4. For the most severe scenario, PET is
One modelling exercise for the Basin predicted to increase by up to 13% in the
suggests that in any scenario mean eastern half of the Basin by 2030 and by up
temperature will rise over the coming to 8% further west. By 2070 these
decades throughout the region3. The rises maximum PET increases are 40% and 24%,
will be greatest in the northern parts of the respectively. The percentage changes are
Basin, with maximum increases for the larger in winter than in summer, with
most severe scenario of up to 2˚C by 2030 potential maximum increases in winter PET
and 5.5˚C by 2070 (relative to 1990). The of 20% by 2030 and 64% by 2070 in the
north-south difference is predicted to occur northeast of the Basin.
for all seasons with the greatest increases in
However, PET is a purely theoretical
the north in spring and summer (up to 2.5
reference measure of water demand.
˚C by 2030 and 7.2 ˚C by 2070). Winter has
Whether water use will increase in reality
the smallest predicted temperature
depends on whether there will be enough
increases.
rainfall to evaporate, or in the case of
Annual rainfall is generally predicted to irrigated agriculture, whether there will be
decline over the Basin, although there is increased use of surface or groundwater. A
considerable uncertainty in the predictions useful measure of water availability is the
as evidenced by the predicted large difference between mean annual rainfall
range4,6. The range of predicted change in and potential evaporation. Except in the
average rainfall, between 1990 and 2030 very high rainfall areas, this balance
and for the most severe scenario, is –13% to already represents a deficit. Predictions are
+7% for much of New South Wales, and – that this deficit will increase throughout the
13% to 0% for northern Victoria. By 2070, Basin, with the greatest change in the
these ranges are –40% to +20% and –40% to north4.
0%, respectively. The largest potential
rainfall changes are in winter and spring,
with potential reductions in spring rainfall
What will happen to
of up to 20% by 2030 and 60% by 2070 over
much of the Basin. In contrast, in the dry
our water resources?
western part of New South Wales there In a climate of increasing temperatures and
may be a tendency towards increased potential evaporation, any projected
rainfall in summer and autumn. decreases in precipitation will have a
significant impact on water resources. The
Where rainfall is predicted to increase or most obvious change is that stream flow is
only slightly decrease, greater rainfall likely to decline. Several researchers have
intensities are predicted. Greater intensity estimated the impacts of climate change on
of rainfall is likely to translate into greater stream flow in the whole or part of the
surface run off. Where rainfall is predicted Basin using different techniques, models,
11and assumptions. One estimate of stream in the storage of Burrendong Dam by
flow decreases over the coming decades up to 30% and 55%, respectively 9 .
indicates a likely reduction of 1,100 GL in
20 years with a worst case reduction of • A 23% reduction of flows into the main
4,400 GL. In 50 years, the estimated likely reservoirs in the Murrumbidgee
reduction is 3,300 GL with a worst case (Burrinjuck and Blowering Dams) and
scenario of 11,000 GL1,47. 36% of tributary inflows below the
reservoirs. This will cause flow
The effects of any changes in flow will be reductions of 52% in the lower
amplified by the fact that a large proportion Murrumbidgee, below the major
of stream flow in the Basin is already used irrigation areas 10 .
for agriculture or the environment, and
therefore reductions in flow will directly
affect these uses. Changes to flow
Regional impacts
regime
Any climate change is likely to affect the
Several studies have predicted changes in
temporal distribution of stream flow. In
stream flow for regions within the Basin10-
14. General predictions are that stream flow
unregulated catchments (those without
storages), seasonal flow reductions can
reductions will be greatest in the south, and
generally be expected to be greater in
least in the north, where increases in
winter, when rainfall decreases are
summer and autumn rain may occur 7
predicted to be larger.
(Figure 5).
In alpine areas, the combination of higher
temperatures and a smaller part of
precipitation falling as snow will result in
earlier peak winter and autumn flows, with
a much shorter time lag between
precipitation and flow, and possibly larger
peak flows. While it is likely that
precipitation will be less overall, localised
flooding could also occur as a consequence
of increased rain intensities.
The downstream impact of flow regime
changes depends primarily on whether
there is storage. In the earlier mentioned
Murrumbidgee predictions, upstream
reductions in annual flow of 23-36% caused
Figure 5. Predicted regional differences in 52% reductions beyond the main diversion
percentage reductions in annual stream flow. Dark points13. Most of this reduction was in high
red indicates greatest reductions. (Source: Jones
10 flows. Low flows (flows not exceeded
and Brooke ).
during 50% of the year) are predicted to be
Some of the regional impacts that have reduced by only 7%. This is because the
been predicted by different studies include: river operation is designed to maintain low
flow in the lower Murrumbidgee River.
• Worst-case stream flow reductions of
20% in eastern and 40% in western
Victoria by 2030, and potential Water security
reductions in excess of 50% for all of
the Victorian part of the Basin by 2070 8 . The risks to the Basin’s water resources
from climate change do not derive from
• Stream flow reductions of 0–15% by projected rainfall decreases alone. Even if
2030 and 0–35% by 2070 in the rainfall does not decline, the projected
Macquarie River, leading to decreases increases in temperature and PET alone can
have deleterious effects on water resources.
12It has been demonstrated that the steadily result in increased algal bloom occurrence.
increasing temperatures over recent Aquatic biodiversity would also be under
decades have already exacerbated the threat from reduced water quality and
effects of drought 11 . As a consequence, the changes in flow regimes. Among the other
Basin drought of 2002–03 was more severe potential impacts are decreases in the
than might have been expected in previous frequency and magnitude of floodplain
periods with similar rainfall deficits. inundation, which can cause the loss of
Increases in temperature and evaporation wetlands and riparian forests, as well as
may also result in increased storage losses. changes in the frequency, duration and
severity of low flow events and perhaps
The impact of climate change on water invasions of exotic riverine plant and
security for agricultural use is likely to be animal species 12 . Finally, the River Murray
significant. Reduced on-farm rainfall and is a highly regulated system and therefore
increased crop water use will increase the any future changes in water demands and
demand for irrigation water, while corresponding changes in river operation
upstream the same reductions in rainfall can be expected to have a significant impact
and increases in evaporation will reduce on environmental flows (Figure 6).
the water supply from storages. In a case
study for the Macquarie catchment it was
found that the risk of irrigation allocations
falling below 50% of entitlements for five
consecutive years was likely to increase
from about 1% at present to 30–40% by
207012. Reduced water security appears
unavoidable if present climate trends
continue.
River ecology
Figure 6. Climate changes will affect River Murray
Climate change is also likely to affect water ecology in many different ways.
quality and the health of rivers and
wetlands, but in many cases opposing
beneficial and damaging processes are at
work and therefore the outcomes are hard
to predict. For example, it has been
predicted that reduced fresh overland flows
can lead to increased salinity in streamflow
from irrigation water supply catchments
(by up to 19% in 2050 and 72% in 2100)47.
Conversely, however, reduced rainfall and
increased PET can also lead to reduced
groundwater recharge and therefore limit
salt mobilisation. The trade-off can be
favourable or not, depending on local
catchment conditions.
The impact of a drier climate on sediment
and nutrient delivery to the streams is
equally hard to predict, as much depends
on the occurrence of high rainfall events
and the level of vegetation cover that is
maintained in a generally drier climate.
If higher temperatures and lower flows do
eventuate, the increased sediment and
nutrient concentrations in the streams may
13Afforestation
shared water resources are under great
Afforestation on the stress.
increase There are also other land use changes that
lead to an increased number of trees or
Plantation forestry is an increasingly other deeper-rooted vegetation with
important land use. Australian industry associated higher water use. These include
and State and Federal Governments have various forms of farm forestry and tree
together committed to establish new plantings for environmental reasons, such
plantations across large areas of land as biodiversity enhancement, waterways
currently used for agriculture. The protection and addressing dryland salinity.
Plantations 2020 Vision, launched in 1997, Where fire and grazing pressure on the
aims to enhance regional wealth and land are reduced, natural regrowth of trees
international competitiveness by trebling and shrubs can occur. Depending on
the area of commercial tree crops to 3 where these other types of tree plantings
million hectares between 1994 and 2020 13 . appear in the landscape, they can have
In 2003 the total plantation area in Australia water resource impacts that are similar to
had already increased to almost 1.7 million those of plantation trees.
ha (Figure 7).
How do trees affect
our water resources?
Trees use more water than unirrigated
pastures or crops. This greater water use of
forests means less water gets past the forest
and out of the catchment. There are a
number of reasons for the greater water use
of trees, including greater direct
Figure 7. The historic increase of plantation
forestry in Australia (dark green) and the trajectory evaporation of rainfall from the leaves,
towards the 2020 Vision (light green). (Source: access to deeper soil water stores, and
BRS). greater exposure to drying winds. How this
greater water use affects the distribution of
An additional 141,000 ha of commercial
high and low river flows depends on
plantations are expected to be established
catchment characteristics such as relief and
across the Basin by 2020. Whilst this
groundwater systems. The dominant
expansion rate is considerably less than the
processes and factors can change from
national trebling, it is none the less
catchment to catchment, but the general
significant.
trend remains that converting an area from
Plantation forests can have a myriad of pasture to forest will reduce water yield on
social, economic and environmental an annual basis 15 .
benefits. For example, strategically located
plantations can reduce groundwater What is the impact of forest
recharge and address salinity 14 . However, cover on catchment water
insufficiently planned afforestation can
have potentially large impacts on water yield?
availability in the Basin, in a time when our
A recent study analysed run off data from
over 250 catchments from 28 countries
14around the world to determine the impact 500
of forest cover on catchment water yield 16 .
Annual water yield reduction (mm)
The catchments varied from less than 1 km2 400
to over 100,000 km2 and spanned tropical, 300
dry, and temperate climates. Vegetation in
200
these catchments ranged from plantations
to native woodlands, open forest, 100
rainforest, eucalypts, pines through to 0
native and managed grassland and 0 500 1000
Rainfall (mm)
1500 2000
agricultural cropping. All catchments were
classified as either predominantly forested, Figure 9. Annual water yield difference (mm, or ML
grassland or a mixture, and the water 2
per km ) between fully forested and non-forested
balance technique was used to calculate catchments.
water use (see Box). The data revealed that The difference between water use in
the most important factors controlling forested and non-forested catchments
annual catchment water yield were rainfall increases from low rainfall to high rainfall
and vegetation cover (Figure 8). areas. For example, when annual rainfall is
less than 500 mm the difference in water
1600
use due to different vegetation is relatively
small. In an 800 mm rainfall zone
Water use (mm/y)
1200 conversion from annual pastures to trees
results in an average water yield reduction
800
of about 1.5 ML for each hectare planted. In
400 reality most catchments will already have
some tree cover, and rarely are entire
0 catchments planted to forest. This can be
0 500 1000 1500 2000 2500 3000 3500
accounted for in calculating water yield
Rainfall (mm/y)
impacts.
Figure 8. Relationship between annual water use
and rainfall for predominantly forest (blue) and
pasture (red) catchments. (grey dots represent
Impacts across the Basin
19
catchments that have a mix) (source: Zhang )
Models have been used to predict the
Figure 8 shows there is some variation in impact of plantation expansion on water
the relationship between annual water use resources across the Basin. These
and rainfall for forested and pasture predictions assume present trends continue
catchments. These have been related to the for plantations to be established in areas
seasonal pattern in rainfall and water use, that have moderate to high suitability from
and differences in soil and catchment a wood production perspective.
properties. More subtle differences in forest
or grassland type, measurements errors, Land suitability in the Basin corresponds
and various possible other causes are rather closely with rainfall, with highly
identified although overall, the suitable areas typically having annual
relationships have been shown to be rainfall of 800 mm or more and moderate
robust19,48. suitability down to about 700 mm per year.
Therefore, as a general rule, the more
productive forestry areas will also be those
Water yield reduction with the greatest water yield impacts.
Long-term catchment water yield can be
calculated as the difference between
average rainfall and water use. The average
reduction of water yield when a tree-less
catchment is converted to forest is shown in
Figure 9. It is expressed in millimetres per
year, which is equivalent to one megalitre
per km2 per year.
15Changes in flow
regime with
afforestation
Predicted changes in mean annual water
yield are useful for regional and Basin-wide
planning. Additionally, changes in seasonal
stream flow may be equally or more
important for water security and
environmental flows. Much depends on
where new plantations are located.
Reservoirs collect and store the flows from
upstream catchments over the year (Figure
11), and therefore annual changes in water
Figure 10. Predicted change in water yield after yield are an appropriate measure of water
converting current cover to forest cover. (Source:
17 resources impact. However, in catchments
Dowling and others, 2004 )
that drain more or less freely into the lower
Figure 10 shows the impact of converting river system, the seasonal changes in
land to forests on water yields in any part stream flow should be considered.
of the Basin (the white areas already have
forest and therefore show no change). The
greatest differences in water yield are
found in the high rainfall areas, with values
quickly dropping from east to west and the
lower rainfall inland areas. The red areas in
the southeast part of the Basin are higher
rainfall areas where the most suitable
forestry land is found, but where the
impacts are also greatest.
Two scenarios of future plantation
expansion were tested as part of a previous
study to predict the total impact of forestry
expansion on water resources1. The first, Figure 11. The Hume Weir is an important reservoir
on the River Murray.
‘worst-case’ scenario was a trebling of the
plantation area in the Basin by 2020, from Most experimental evidence suggests that
460,000 ha to almost 1,400,000 ha17. The plantations can significantly reduce dry
estimated reduction in water yield is 1,100- season flow or even cause streams to dry
1,400 GL each year, depending on whether up completely. This is because trees can
new plantations will be in moderate or high access deeper soil water stores during the
suitability areas. The second scenario dry season and hence maintain high water
assumes doubling of the plantation area by use rates. A convenient way of
2020. This can lead to a reduction in water summarizing the distribution of flows over
yield of 550-700 GL per year, again the year is provided by Flow Duration
depending on where new plantations will Curves (FDCs). These show the range of
be located. This more modest latter scenario flows, from high to low, and how they
still represents a forestry expansion rate change under different land use scenarios.
that is significantly higher than the present An example for two small, relatively wet
best estimate of 141,000 ha. This present catchments with similar characteristics is
best estimate of 141,000 ha would result in shown in Figure 12 18 .
a reduction in water yields of less than 550-
700 GL per year.
16The trade-off between water and salt
10
reductions is typically most favourable in
1 low to medium rainfall areas, where the
Stream flow
(mm/day)
0.1 water use difference between pasture and
Pasture
0.01
trees is relatively limited and large amounts
Pines (5-10yrs old) of salt may be stopped from moving into
0.001
the stream.
0 20 40 60 80 100
% of time that flow is exceeded It is also important to note that there will be
a time lag before salinity benefits occur.
Figure 12. Flow duration curves for the Redhill This is because stream flow responds faster
catchments, near Tumut (NSW) (stream flow is
divided by catchment area for comparison) to afforestation than does salt mobilisation.
21
(Source: Lane et al. ) The consequence of this is that salinity may
increase temporarily, before eventually
One of the two catchments has been decreasing below the initial level. The
planted with pines, while the other remains quickest response can be expected in
under pasture. There is year-round stream upland areas where hilly relief leads to a
flow from the catchment under pasture rapid groundwater response. An example
while the catchment under pines only of such a catchment is shown in Figure 13 19 .
produces run off during 60% of the year.
The two curves are much closer for the high
flows than for the low flows. This pattern is
300%
typical when comparing forested to non-
forested catchments in seasonal rainfall
areas: low flows are reduced more than 200%
Change
high flows, and the highest flows are not
affected much at all21. The small relative 100%
reduction in higher flows is still responsible salinity
salt
for most of the reduction in total annual 0% water
88
91
water yield.
94
97
00
03
19
19
19
19
20
20
Changes in water Figure 13. Annual values of stream flow, salt load
and stream salinity for Pine Creek (a very small 3
2
quality km catchment in the southwest Goulburn River
catchment, Victoria) after full afforestation was
22
completed in 1988. (Source: Harirsine & Van Dijk )
Salinity is recognised as one of the most
serious environmental issues in the Basin. It is clear that the catchment has responded
Predictions suggest increased areas of salt- strongly to plantation development in
affected land and increasing stream salt terms of stream flow, salt load and stream
loads (total amounts of salt) and stream salinity (expressed as the ratio of annual
salinity (salt concentration). Revegetation total salt load over stream flow). In this
is recognised as a tool for managing case, stream salinity decreased within a few
salinity. years after planting.
How do trees affect salinity? Trade-off between water
quantity and water quality
If water on its way to the stream picks up
large amounts of salt, then a reduction of From the perspective of water quantity and
this amount of water will also lead to a water quality, the preferred locations for
reduction in the amount of salt that reaches plantations may be very different from the
the stream. However, when the goal is to planting locations that are preferred for
reduce stream salinity - the concentration of commercial reasons. Strictly commercial
salt in the stream - it is then essential that plantations are best located in high rainfall
the percentage reduction in salt load is areas but this is where most of the fresh, so-
greater than the reduction in water yield17. called ‘dilution flows’, are generated.
Plantations here would result in less
17dilution and therefore from a stream lesser degree depending on site
salinity viewpoint make matters worse: characteristics, but all of them will lead to
while they will somewhat reduce total salt decreased water yield22.
loads they will in fact increase overall
stream salinity17.
Conversely, for salinity management, trees
are often preferably planted in parts of the
landscape where salt is most present and
where they will most reduce groundwater
recharge. Such areas often (but not always)
have lower rainfall, poorer and thinner
soils, and sometimes waterlogged areas
and salinity outbreaks22. These factors all
compromise the production potential and
sustainability of plantation forestry. In a
similar way, much stream sediment is often Figure 15. An environmental planting on degraded
generated in parts of the landscape that are grazing land in the upper Goulburn River
catchment.
less suitable for commercial forestry.
Several methods and decision support tools
are already available to assist in balancing
the water yield impacts of new tree
plantings against other economic and
environmental outcomes 20 . Use of these
tools requires that the different water
quantity and quality outcomes can be
valued or prioritised.
Figure 14. An example of a commercial plantation
forest that also has a clear salinity benefit (the
Pine Creek forest from Figure 13).
Designing forestry for both commercial and
environmental benefits requires careful
targeting of sites where the requirements
for productive forests and environmental
and water resource outcomes can both be
met (Figure 14). The total area of such sites
across the Basin is relatively limited and
their afforestation may not result in large
water resource impacts, nor achieve large
salinity decreases in the lower River
Murray.
Apart from commercial plantations,
revegetation occurs for a variety of other
reasons. Examples are farm forestry in
woodlots or tree rows, and plantings for
enhanced biodiversity (Figure 15), salinity
reduction, erosion control, riparian
protection or carbon sequestration. Almost
all planting types can achieve several
environmental objectives to a greater or
18Groundwater extraction
what exactly constitutes a ‘sustainable
Groundwater: an groundwater yield’ (see box) 21 .
important resource
Groundwater is a valuable resource in the Defining sustainable yields
Basin. As discussed in the first report in this The water budget for a region or
two part series, groundwater extraction has catchment is the balance between all
increased in recent years. In some parts of inputs and outputs of water: water is
the Basin, groundwater stores are declining exchanged with the atmosphere
at alarming rates and this may jeopardise (rainfall and evaporation) and gained
its future use locally. from or lost to adjacent areas as surface
Groundwater pumping can also threaten and groundwater flows. A natural
water security downstream. A number of water budget can be assumed to be
studies highlight the potential impact on approximately neutral over the long
increasing groundwater use on stream flow term, with equal inputs and outputs.
and on Murray-Darling Basin Ministerial When the groundwater system is
Council strategies such as the Cap on pumped, an extra output term is added
diversions and, indirectly, The Living to the water budget. The only way for
Murray. the budget to become neutral again, is
by increasing inputs (such as greater
recharge from rivers) or reducing other
outputs (such as discharge to the
surface or streams, or groundwater
outflows). This change is inevitable but
may come about only slowly if the
groundwater storage is large.
This means that the natural, pre-
development water budget by itself is
of limited value in determining the
amount of groundwater that can be
withdrawn on a sustainable basis .
Figure 16. Windmills pumping groundwater in SA. Ignoring this fact will lead to
unsustainable groundwater
In connected groundwater-surface water management.
systems, there is normally a time lag of
years or decades between the start of Several studies have attempted to predict
groundwater extraction and the moment future groundwater extraction within the
the full impact of that pumping is felt in the Basin. All studies assume that ultimately,
streams. This also means that even if all the sustainable yield for the Basin will be
groundwater pumping were to cease the effective upper limit to extraction. The
immediately, there will be an ongoing major difference is in how fast this limit
impact in streams due to historical will be achieved. One recent study used
pumping. Management of this legacy of simple linear models based on long term
pumping will be a complex task (Figure average rates of increase 22 , while another
16). Furthermore, it is difficult to establish highlighted the increased extraction rate
and assumed a more rapid increase 23 . What
19all studies have in common is that further flows from the stream to the aquifer. In
groundwater will be extracted from the both these cases, the volume of water
Basin’s groundwater systems, and that this moving to the aquifer from surface water is
extraction will continue to erode surface greater than when there is no pumping.
water flows. This increase in the water flux is called
induced recharge. This type of leakage
from streams is effectively a form of
How is stream flow groundwater recharge. Sometimes it is
apparent as transmission losses: a volume
lost to groundwater of water that goes missing between two
pumping? stream gauging stations. In other cases it is
not identified at all. It can occur under
A geological formation that contains natural conditions, but groundwater
extractable and economic quantities of extraction can exacerbate it by increasing
water is referred to as an aquifer. The the difference in water pressure between
aquifer is called unconfined if the the stream and the groundwater system.
watertable is within the aquifer, and water
In general, the time frame for the onset of
pumping will lower it. If the aquifer is
induced recharge will be short, but the time
capped by a low permeability layer (an
to full impact depends on a range of factors
aquitard) and the saturated water is under
including the volumes of water pumped
pressure, the aquifer is said to be confined.
and the volumes of water in the river, how
A well or bore drilled through the aquitard
much the hydraulic gradient is changed
will allow the water to rise up to the water
and the properties of the aquifer material.
pressure or hydraulic head in the aquifer.
In some circumstances where the aquifer is
Where a confined aquifer is capped by a
pumped at high rates, the water level can
leaky aquitard, a semi-confined aquifer will
be drawn below the river bed. In these
result.
cases, the aquifer-stream relationship
As a groundwater body is pumped, the becomes disconnected. Induced recharge
water level (or hydraulic head) around the will not occur in a stream-aquifer system
pumping bore will be drawn down in the that is already disconnected under natural
shape of a so-called pumping cone. Over conditions, as in that case leakage to the
time, this cone will expand and deepen at a aquifer will already be at maximum.
rate that depends on the characteristics of
the aquifer. Captured discharge
After a longer period of pumping a balance When pumping occurs further from the
can be achieved in which the cone does not stream and the hydraulic gradients are not
expand, but extractions are compensated by changed, the major impact will be that
inflows of groundwater further away, or groundwater will be extracted that
outside the aquifer altogether. The sources otherwise would have flowed into the river
of this water can be surface water bodies at a downstream point. Discharge capture
such as rivers, groundwater that would can be felt in the river itself as diminished
otherwise discharge into the stream, or stream flow. It can also be manifested away
other saturated layers. There are several from the river, for example as reduced
ways groundwater extraction can lead to water supply to groundwater dependent
reduced stream flows. Three common ecosystems in lakes or billabongs (Figure
processes are described below. 17).
Induced recharge
When the influence of a pumping bore, or
area of pumping, is close enough to a river
or stream, the hydraulic gradient between
the area of pumping and the stream can be
increased, or even reversed, such that water
20budget, unless the leakage is matched by
water being added at the top of the semi-
confining layer, which may be from
irrigation or from a river. If there is no
addition to the semi-confining layer that
compensates for the leakage, then this layer
will dewater and this may cause land
subsidence. The response of the aquifer to
induced leakage from the semi-confining
layer is usually indistinguishable from that
of induced recharge. This can be a problem
when trying to establish the sustainability
Figure 17. Groundwater pumping changes the of a developed water budget.
balance of water exchange between the river and
the groundwater system, and can also affect
groundwater dependent water ecosystems.
Impacts differ
Captured groundwater discharge will take
longer than induced recharge to be felt. between regions
Again, much depends on the distance of the
pumping from the stream, the water The major groundwater systems with
volumes pumped and water volumes in the linkages to surface water in the Basin differ
river, the change in hydraulic gradient and in the way they behave, and in the
aquifer properties. In some cases where processes by which they are recharged and
pumping is close to the stream and the discharge. This has important consequences
change in the hydraulic gradient is large, for the impact of groundwater extraction on
the impacts may be felt almost immediately surface water resources.
(Figure 18).
Generally, the connected aquifer-stream
systems occur in the south-eastern parts of
the Basin, and disconnected systems occur
in the north. Aquifers in South Australia
are connected at the discharge end with the
River Murray, but the timing of the onset of
impacts is extremely long, and in fact the
salinity of the Mallee Limestone system
means that a reduction in discharge will
provide a salinity benefit.
The regions at highest risk will be those
where the current and potential future
extraction of groundwater is high and
where the aquifer and stream are strongly
connected. This situation occurs in the
Figure 18. A pumping station designed to intercept alluvial valleys of New South Wales. A
saline groundwater flowing into the river and
provides an example of captured discharge.
good example is the Mid-Murrumbidgee
River valley.
Other areas where extraction rates are high
at present, such as the Shepparton-Katunga
Induced leakage and Lower Murrumbidgee regions, have a
A more complex form of water loss can similarly high level of risk. However, the
occur in semi-confined aquifers. Pumping situation here is complicated by the
the aquifer can cause water to leak out of presence of a semi-confining layer. In the
the semi-confining layer above. This Shepparton-Katunga region, high levels of
leakage is a one-off component of the water extraction contribute to salinity mitigation.
21You can also read