Volkswagen Group at a Glance Volkswagen Group at a Glance - Department: Group Investor Relations (K-FTK) Leading the Transformation
←
→
Page content transcription
If your browser does not render page correctly, please read the page content below

Volkswagen Group at a Glance
 Volkswagen Group at a Glance

Department: Group Investor Relations (K-FTK)
 Leading the Transformation
Classification:
Disclaimer

The following presentations as well as remarks/comments and explanations in this context contain forward-looking statements
on the business development of the Volkswagen Group. These statements are based on assumptions relating to the development
of the economic, political and legal environment in individual countries, economic regions and markets, and in particular for the
automotive industry, which we have made on the basis of the information available to us and which we consider to be realistic at
the time of going to press. The estimates given entail a degree of risk, and actual developments may differ from those forecast.

At the time of preparing these presentations, it is not yet possible to conclusively assess the specific effects of the latest
developments in the Russia-Ukraine conflict on the Volkswagen Group’s business, nor is it possible to predict with sufficient
certainty to what extent further escalation of the Russia-Ukraine conflict will impact on the global economy and growth in the
industry in fiscal year 2022.

Any changes in significant parameters relating to our key sales markets, or any significant shifts in exchange rates, energy and
other commodities or commodities relevant to the Volkswagen Group or the supply with parts, or deviations in the actual effects
of the Covid-19 pandemic from the scenario presented will have a corresponding effect on the development of our business. In
addition, there may be departures from our expected business development if the assessments of the factors influencing
sustainable value enhancement and of risks and opportunities presented develop in a way other than we are currently expecting,
or if additional risks and opportunities or other factors emerge that affect the development of our business.

We do not update forward-looking statements retrospectively. Such statements are valid on the date of publication and can be
superseded.

This information does not constitute an offer to exchange or sell or an offer to exchange or buy any securities.

                                                                                                                                2
Table of Contents

                    Key Facts & History
                    Strategy
                    Operations

                    Financials
                    ESG
                    Share Information

                                          3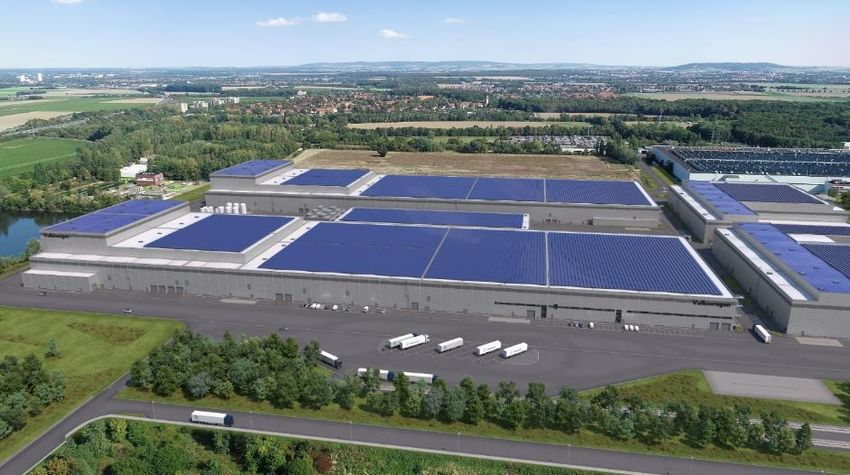
Key Facts of Volkswagen Group
                                                                                                                                 Actual                                          Outlook
                                                                                                             2020                             2021                               2022
        Deliveries to customers                                        m vehicles                              9.3                             8.9                      Similar as prior year

        Sales Revenue                                                  € bn                                 222.9                             250.2          8% to 13% higher than the prior-year figure

        Operating return on sales 1                                    %                                       4.8                             8.0                   In the range of 7.0% to 8.5%

        Clean Net Cash Flow (Automotive) 2                            € bn                                   10.1                              15.5                   In the range of € 13 - 15bn

        Net Liquidity (Automotive)                                    € bn                                   26.8                              26.7             Up to 15% higher than prior-year figure

  Extraordinary                              Forward looking                             Strong                                    Global player          Powerful truck                All service provider
  portfolio                                  strategy                                    manufacturer                                                     business
                                                                                                                                   153 countries where                                  Financial Services &
  9 car brands of                             50% BEV share target                       up to 250,000 cars                        vehicles are sold      4 truck brands under          Mobility Solutions
  5 European countries                        by 2030 3                                  produced per week                                                one roof managed by
                                                                                                                                                          TRATON SE
                                              on 3 BEV platforms                         72 vehicle production                     668,000 employees in
                                              (MEB, PPE and SSP) 4                       plants worldwide                          the whole Group

1 before special items   3 strategic target
2 ex diesel and M&A      4 MEB: modular electric-drive toolkit, PPE: premium platform electric, SSP: scalable systems platform

Škoda Enyaq: Power consumption in kWh/100 km: combined 16.8; CO2-emissions in g/km: 0 (combined)
Cupra Born: Power consumption in kWh/100 km: combined 17.5; CO2-emissions in g/km: 0 (combined)
Audi A6 Avant e-tron: Concept car
Bentley Continental GT: Fuel Consumption in l/100 m: combined 13.7 – 12.1; CO2-emissions in g/km: 311 – 275 (combined)
Porsche Taycan GTS Sport Turismo: Power consumption in kWh/100 km: combined 24.1 – 21.0; CO2-emissions in g/km: 0 (combined)
Porsche 911 Targa 4S: Fuel Consumption in l/100 m: combined 11.1 – 10.4; CO2-emissions in g/km: 252 – 236 (combined)                                                                                           4
Only consumption and emission values according to WLTP and not according to NEDC are available for the vehicles
Volkswagen history

    From National Leader to Global Champion
                    1945 – 1949                  1947 – 1953                  1965                       1985 – 1991                 2012 – 2014                 2019                        2021

                    The British military         Volkswagen goes              The „Auto-Union            Establishment of            Integration of Porsche      IPO                         Acquisition
                    government takes over        international with the       GmbH“ (later Audi) is      Chinese joint ventures      (2012) and MAN (2013)
                    trusteeship. Their           first exported car in        transferred into the       creates basis for future    as well as the takeover
                    quality policy, customer     1947 and the opening         ownership of               success: Shanghai           of Ducati; successful
                    service, sales network       of the first foreign sales   Volkswagen                 Volkswagen (1985) and       offer for all
                    and export orientation       company in Canada                                       FAW-Volkswagen              outstanding Scania
                    lay the foundation for       and the first production                                (1991)                      shares (2014)
                    the company’s success        plant in Brazil

          The                         Internationalization &                               Stock Company &                                   The globalized
                                                                                                                                                                                                    New Auto
       Beginnings                        Mass Production                                      New Models                                    Automobile Group

1938                          1945                         1960 – 1961                 1986 – 2008                 1994 – 1995                2014                      2020                          2022

Start of construction of      Series production of         Volkswagen listed at        Acquisition of the          Foundation of              Volkswagen achieves       Volkswagen ID.3                IPO
the Volkswagen plant          the Beetle begins with       stock exchange and          brands SEAT (1985),         “Volkswagen Financial      more than ten million     introduced; first fully
in Wolfsburg                  55 vehicles                  issues shares for the       ŠKODA (1991), Bugatti,      Services AG“ and           deliveries in one year    electric vehicle based
                                                           first time in 1961          Bentley, Lamborghini        Volkswagen                 for the first time        on the MEB platform
                                                                                       (1998) and Scania           Commercial Vehicles
                                                                                       (2008)                      brand

                                                                                                                                                                                                               5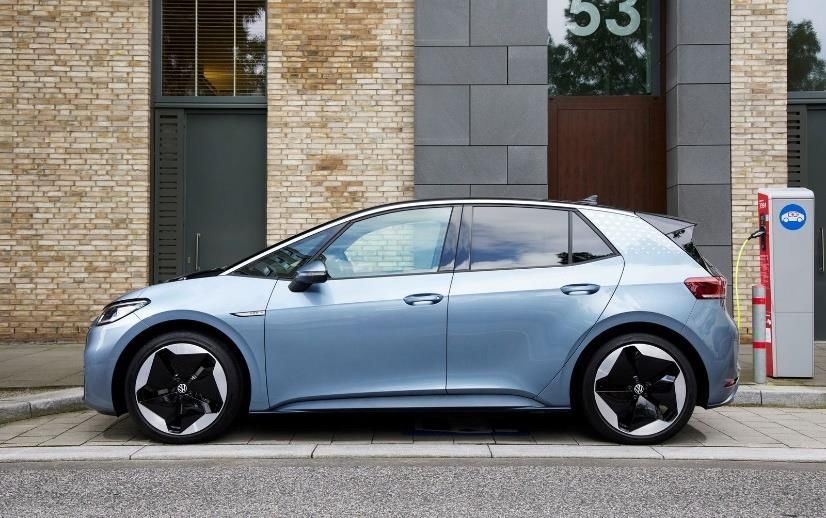
Fascinating Portfolio of Brands
Volkswagen Group
                                         Automotive Division                                       Financial Services Division
          Passenger Cars Business Area                         Commercial Vehicles Business Area

            Volume Brand Group

                                                                 TRATON Commercial Vehicles        Volkswagen Financial Services

            Premium Brand Group

                                                                                                    Dealer and customer financing
         Sport & Luxury Brand Group                                                                           Leasing
                                                               Power Engineering Business Area               Direct bank
                                                                                                             Insurance
                                                                    MAN Energy Solutions                 Fleet management
                                                                                                          Mobility services
                   CARIAD
                   Others

                                                                                                                                    6
The Board of Management of Volkswagen Aktiengesellschaft

          Dr. Oliver Blume                        Dr. Arno Antlitz                           Hauke Stars                            Thomas Schäfer                           Thomas Schmall-von
          CEO of Volkswagen AG                                                                                                                                               Westerholt
                                                  COO and CFO 2                              IT                                     Volume brand group
          and Porsche AG 1                                                                                                                                                   Technology
          since September 1st 2022                since September 1st 2022                   since February 1st 2022                since July 1st 2022                      since January 1st 2021
          till 2027                               till 2027 2                                till 2025                              till 2027                                till 2023

                              Markus Duesmann                            Ralf Brandstätter                        Dr. Manfred Döss                        Gunnar Kilian
                                                                                                                  Integrity and Legal                     Human Resources and
                              Premium brand group                        China 3
                                                                                                                  Affairs                                 Truck & Bus
                              since April 1st 2020 till 2025             since January 1st 2022 till 2026         since February 1st 2022 till 2027       since April 13th 2018 till 2026

                             1 CEO of Porsche AG since October 1st 2015
                             2 CFO of Volkswagen AG since April 1st 2021
                             3 CEO of Volkswagen Passenger Cars since July 1st 2020 till December 31st, 2021
                                                                                                                                                                                                      7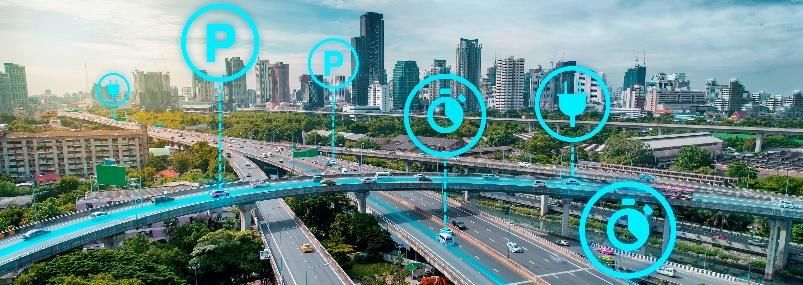
Table of Contents

                    Key Facts & History
                    Strategy
                    Operations

                    Financials
                    ESG
                    Share Information

                                          8
TOP 10 Volkswagen Group Program
Responsible Board of Management Member

        1               PLANNING ROUND                      6    SSP STRATEGY / TECHNOLOGY
                        Antlitz                                  Blume

        2               PRODUCTS                            7    BATTERY / CHARGING / ENERGY
                        Schäfer, Duesmann, Blume, Levin 1        Schmall

        3               CHINA                               8    MOBILITY SOLUTIONS
                        Brandstätter                             Wortmann

        4               NORTH AMERICA                       9    SUSTAINABILITY
                        Antlitz                                  Döss

        5               CARIAD                              10   CAPITAL MARKET
                        Blume                                    Antlitz
 1 Christian Levin, CEO of TRATON SE

                                                                                               9
New Auto Strategy: Steering Matrix
We shift the Focus towards Brand Groups and Value Drivers
 SCHEMATIC                                           Strong Combination               Separate Listing
                        Strong brands             Volume                  Premium   Sports       Trucks

                                                                                                          +
                  Value drivers                                                                               Strong positioning of
                                                                                                               China JVs as unique
    BEV Hardware                                                                                                      assets

    Software

    Battery &
    Charging
                                                                                                          Focus on technology /
    Mobility                                                                                              software roadmap and
    Solutions                                                                                             mobility services
   Tech. Components

   Group Services/
   Financial Services

                                        Customers, brand positioning,
                                        performance programs, synergies, delivery

                                                                                                                                      10
Target BEV Share Development of Total Vehicle Deliveries
BEV Share of Total Vehicle Deliveries
[in %] Europe China NAR RoW
SCHEMATIC 2x
VW Trinity
VW ID. BUZZ VW ID. LIFE ≈50%
VW AERO
Škoda Vision 7S
AU Q4 e-tron PO eMacan
VW ID.5
VW ID.4 (NAR) 2x ≈25%
≈20%
2x
≈11%
≈7-8%
5.1%
2021 2022e 2023e 2025e 2026e 2030e
ID. Buzz Pro: Power consumption in kWh/100 km: combined 21.7 – 20.6; CO2-emissions in g/km: 0 (combined) ID. Buzz Pro: Power consumption in kWh/100 km: combined 21.7 – 20.6; CO2-emissions in g/km: 0 (combined)
Only consumption and emission values according to WLTP and not according to NEDC are available for the vehicles Only consumption and emission values according to WLTP and not according to NEDC are available for the vehicles
Audi A6 Avant e-tron: Concept car Audi A6 Avant e-tron: Concept car
Volkswagen ID.7/AERO, ID. Life, Porsche eMacan, Škoda Vision 7S, VW Trinity: Vehicles are near-production concept cars Volkswagen ID.7/AERO, ID. Life, Porsche eMacan, Škoda Vision 7S, VW Trinity: Vehicles are near-production concept cars
11Volkswagen Groups‘ unique situation – Keeping the relative scale with MQB and
(sustained) margin and cash flows
Declining Tightening emissions Tax TCO
Demand for ICE regulations disadvantages (vs BEV)
ICE MARGIN /
CASH FLOW Mix, Pricing, Fix Cost
Management
2025/2030
ICE complexity reduction Product substance MQB MQB - scale
(models, EU) MQB
~ -60%
MQB
2021 2030
Bundling of remaining ICE vehicles in
2nd hardware lifecycle
Sustained attractive global produced plants to maximize utilization (multi-
portfolio Minimal additional structural funding brand plant production)
Phase out of low margin cars Reduced D&A Increasing production efficiency
Discontinuation of night shifts
12Table of Contents
Key Facts & History
Strategy
Operations
Financials
ESG
Share Information
13Production Plants and Employees with Brands Worldwide
Total 668,000 employees worldwide Employees by Brands
Volume 258,000
Total 72 vehicle plants 1
VW PASSENGER CARS 173,000
Germany 11
291
34 Europe
ŠKODA 46,000
China SEAT 15,000
thereof
4
13 VW COMMERCIAL VEHICLES 23,000
NAR Asia 2
Premium 84,000
4 3 AUDI 79,000
BENTLEY 4,000
Africa
4 LAMBORGHINI 2,000
Sport 37,000
PORSCHE 37,000
5
TRATON 100,000
SAR
MAN 36,000
4 SCANIA 49,000
1 NAVISTAR 15,000
VW Group CHINA 82,000
Others 107,000
1 Schematic Overview showing total of vehicle plants only. Total of component plants: engines, gearboxes or components: additional 44 plants
2 Asia: Thailand, Malaysia and Taiwan
Note: Data as of 24 November 2021 14Global Roll out of BEV production as of Q3 2022
Ramp up of re-tooled MEB plants Emden, Hanover and Chattanooga support scale
USA Europe China
Emden
Hanover
Brussels
Zwickau
Chattanooga
Mlada Boleslav Anting
Zuffenhausen
Foshan
VW ID.4 (NAR) VW ID.3 VW ID.4 AU Q4 e-tron VW ID.3 VW ID.4 X/CROZZ VW ID.6 X/CROZZ
VW ID. BUZZ PO Taycan CU Born AU Q4 e-tron AU Q5 e-tron
Skoda Enyaq VW ID.5 Pro
ID.3 Pro Performance: Power consumption in kWh/100 km: combined 16.3 - 15.2; CO2-emissions in g/km: 0 (combined) Škoda Enyaq: Power consumption in kWh/100 km: combined 16.8; CO2-emissions in g/km: 0 (combined)
ID.4 Pro Performance: Power consumption in kWh/100 km: combined 18.6 - 16.3; CO2-emissions in g/km: 0 (combined) Porsche Taycan GTS Sport Turismo: Power consumption in kWh/100 km: combined 24.1 – 21.0; CO2-emissions in g/km: 0 (combined)
ID.5 Pro Performance: Power consumption in kWh/100 km: combined 18.6 - 16.3; CO2-emissions in g/km: 0 (combined) ID. Buzz Pro: Power consumption in kWh/100 km: combined 21.7 – 20.6; CO2-emissions in g/km: 0 (combined)
Audi Q4 e-tron: Power consumption in kWh/100 km: combined 20.3 - 16.6; CO2-emissions in g/km: 0 (combined) Only consumption and emission values according to WLTP and not according to NEDC are available for the vehicles
Cupra Born: Power consumption in kWh/100 km: combined 17.5; CO2-emissions in g/km: 0 (combined) China: Vehicles sold outside Germany
15PowerCo established to bundle Group-wide battery activities and set up cell
factories (Groundbreaking SalzGiga in July 2022)
3D Visualization Key Takeaways
• Salzgitter cell Factory to be blueprint and starting point for
global battery offensive
• Targeted start of production of Salzgitter plant in 2025
• Standard Factory concept, consisting of scalable standardized
modules with a production capacity of ~40 GWh per year
• Standard Factory and unified cell enable rapid global rollout
• 240 GWh targeted by 2030
• Northvolt AB Lithium-Ion cell production in Skellefteå, Sweden
since Dec 2021 1
• Two European locations already decided (Salzgitter, Germany
and Valencia, Spain)
Benefits of
the Standard European Standard Lean line design Flexible production footprint
Standardized European Factory Factory design follows value Adaptable to different cell
Factory to minimize planning efforts stream concept from mixing to chemistries and formats
concept final inspection
1 Northvolt AB Lithium-Ion cell production is owned and operated by Northvolt AB; minority shareholding of Volkswagen AG and cooperation agreement
16Table of Contents
Key Facts & History
Strategy
Operations
Financials
ESG
Share Information
17Group Financial Performance
Outlook 2022 and Strategic Targets 2025/2026
Key Figures Volkswagen Group
2017 2018 2019 2020 2021 Δ (vs. 2020) LTM 1 Δ (vs. 2021) Outlook 2022 Strategic Targets 2025/2026
Volume Data
Total Deliveries thsd. units 10,834 10,835 10,975 9,305 8,882 -4.5% 7,987 -10.1% Similar level as prior year
thereof BEV Deliveries thsd. units 229 453 +97.8% 526 +16.1% 7% to 8% BEV-share 20% to 25% BEV-share
Unit Sales thsd. units 10,777 10,900 10,956 9,157 8,576 -6.3% 8,353 -2.6%
Production thsd. units 10,875 11,018 10,823 8,900 8,283 -6.9% 8,582 +3.6%
Headcount thsd. empl. 642.3 664.5 671.2 662.6 672.8 +1.5% 674.9 2 +0.3%
Financial Data
8% to 13% higher than the prior-
Sales Revenue (Group) € million 230,682 235,849 252,632 222,884 250,200 +12.3% 266,598 +6.6%
year figure
Operating Result (before special items) € million 17,041 17,104 19,296 10,607 20,026 +88.8% 23,327 +16.5%
Operating return on sales (margin) % 7.4% 7.3% 7.6% 4.8% 8.0% +3.2ppt. 8.7% +0.7ppt. In the range of 7.0% to 8.5% In the range of 8.0 to 9.0%
Operating Result (after special items) € million 13,818 13,919 16,960 9,675 19,275 +99.2% 22,419 +16.3%
Earnings before tax € million 13,673 15,643 18,356 11,667 20,126 +72.5% 22,865 +13.6%
Earnings after tax € million 11,463 12,153 14,029 8,824 15,428 +74.8% 16,842 +9.2%
Automotive Division
Clean Net Cash Flow 3 € million 5,588 13,500 10,045 15,492 +54.2% 12,302 -20.6% In the range of € 13–15bn >€ 15bn
Reported Net Cash Flow € million -5,950 -306 10,835 6,357 8,610 +35.4% 6,966 -19.1% Same level as in the previous year
Up to 15% higher than prior-year
Automotive Net Liquidity € million 22,378 19,368 21,276 26,796 26,685 -0.4% 31,553 2 +18.3% ~10% of Group Sales Revenue
figure
1 LTM (Last Twelve Months) based on Q4/2021 - Q3/2022 figures as reported
2 Data as of September 30, 2022
3 ex Diesel and M&A
18Group Performance / Targets
Fully committed to ambitious targets with uplift potential (as of current planning round PR70) 1
2025/26
2019 2020 2021 2022 Strategic
Key Financial Targets Actual Actual Actual Outlook Targets
Operating return on sales 7.6 4.8 8.0 7.0-8.5 8-9
before Special Items
Return on investment
Automotive Division 12.6 7.1 10.8 12-15 >15
before Special Items in %
Capex ratio 6.6 6.1 5.1 ~5.5 ~5
Automotive Division
R&D cost ratio 6.7 8.0 7.6 ~8 ~6
Automotive Division
a) Clean Net Cashflow
Cash 13.5 10.0 15.5 13-15 >15
w/o Diesel and M&A € bn
Automotive
Division up to 15% above ~10% of Group
b) Net Liquidity 2 21.3 26.8 26.7
prior year sales revenue
1 PR70 = Planning Round 70 – as of December 2021
2 Before Porsche IPO Proceeds
19Volkswagen Group – Analysis by Brand and Business Field
January to September 2022 (9M)
VEHICLE SALES (`000) SALES REVENUE (€ m) OPERATING RESULT (€ m) OPERATING MARGIN (%)
9M 2022 9M 2021 9M 2022 9M 2021 9M 2022 9M 2021 9M 2022 9M 2021
Volume brand group 2,957 3,171 81,356 74,876 3,720 2,478 4.6 3.3
Volkswagen Passenger Cars 1,882 2,088 52,026 49,055 2,462 1,211 4.7 2.5
ŠKODA 646 596 15,181 13,329 856 900 5.6 6.8
SEAT 333 384 7,820 7,259 -10 -159 -0.1 -2.2
Volkswagen Commercial Vehicles 237 246 7,956 7,276 356 55 4.5 0.8
Tech. Components – – 12,655 12,803 -7 382 -0.1 3.0
Consolidation -141 -143 -14,281 -14,847 64 90
Audi (Premium brand group) 766 806 44,561 42,325 6,282 4,169 14.1 9.9
Porsche Automotive (Sport & Luxury brand group) 221 209 24,456 20,979 4,746 3,356 19.4 16.0
TRATON Commercial Vehicles3 218 196 27,964 21,305 954 476 3.4 2.2
At equity accounted companies in China4 2,339 2,156 – – – – –
MAN Energy Solutions – – 2,517 2,338 210 123 8.3 5.2
CARIAD – – 422 255 -1,427 -750 – –
Volkswagen Financial Services – – 32,859 32,044 4,399 3,688 13.4 11.5
Other5 -258 -74 -11,137 -7,521 -1,4282 6172 – –
Volkswagen Group before special items – – – – 17,457 14,157 8.6 7.6
Special Items – – – – -360 -203 – –
Volkswagen Group 6,243 6,466 202,997 186,599 17,097 13,953 8.4 7.5
thereof:
Automotive Division6 6,243 6,466 168,183 152,869 12,907 9,986 7.7 6.5
Of which: Passenger Cars Business Area 6,025 6,269 137,702 129,226 11,744 9534 8.5 7.4
Commercial Vehicles Business Area 218 196 27,964 21,305 956 453 3.4 2.1
Power Engineering Business Area – – 2,517 2,338 207 -1 8.2 0.0
Financial Services Division – – 34,814 33,730 4,190 3,967 12.0 11.8
1 The previous year’s figures were calculated by means of a simple addition with the Bentley figures.
2 Porsche (including Financial Services): sales revenue € 26,741 (23,115) million, operating result € 5,048 (3,559) million.
3 Includes Navistar from July 1, 2021.
4 The sales revenue and operating result of the equity-accounted companies in China are not included in the consolidated figures; the share of the operating result generated by these companies amounted to € 2,558 (1,962) million.
5 In the operating result, mainly intragroup items recognized in profit or loss, in particular from the elimination of intercompany profits; the figure includes depreciation and amortization of identifiable assets as part of purchase price allocation, as well as companies not allocated to the brands.
6 Including allocation of consolidation adjustments between the Automotive and Financial Services divisions.
20Volume Brand Group Performance
January to September 2021 vs. 2022
Key Takeaways
Volume Brand Group 1 • VW Brand: 4.7% 9 months margin, Q3 at 3.2%
margin seasonally weak; burdened by material
costs. Positive contribution from price and mix as
Vehicle Sales [‘000 units] Sales Revenue [€ m] well as impact of regions NAR and SAR
3,171 81,356 • Skoda: Continued decent performance, delivering
2,957 74,876 solid 5.6% 9 months margin, but Q3 margin down
to 3.6% in light of Russian business closure and
ongoing ramp up of our Indian business at Skoda
(non-recurring items of € -0.3bn booked in Q3)
Jan - Sep Jan - Sep Jan - Sep Jan - Sep • SEAT: Came in with a negative result of € -10m
2021 2022 2021 2022 after 9 months burdened by restructuring costs of
€ 244m booked in Q2
Operating Result [€ m / % RoS] Net Cash Flow [€ m]
• Light Commercial vehicles at 4.5% 9 months
3,720 margin, 5.8% Q3 margin
2,478 1,855 • Group Components business
at break-even, impacted by
supply chain issues
3.3% 4.6% -365 and increased
Jan - Sep Jan - Sep
material costs
Jan - Sep Jan - Sep
2021 2022 2021 2022
1 Before special items
ID.5 Pro Performance: Power consumption in kWh/100 km: combined 18.6 - 16.3; CO2-emissions in g/km: 0 (combined) Only consumption and emission values according to WLTP and not according to NEDC are available for the vehicle
21Premium Brand Group Performance
January to September 2021 vs. 2022
Key Takeaways
Premium Brand Group 1, 2 • Premium Brand Group well under way;
Lamborghini and Bentley performed strong
Vehicle Sales [‘000 units] Sales Revenue [€ m] • Audi Brand: 12.8% 9 months margin, operating
profit continued to be solid; fair value effects
806 766 42,325 44,561 € 561m after 9 months
• Resilient demand for well-equipped premium
vehicles, strong order bank
• Bentley: 22.7% Q3 margin, 23.1% 9 months
margin
Jan - Sep Jan - Sep Jan - Sep Jan - Sep
2021 2022 2021 2022 • Lamborghini: 24.4% Q3 margin, 29.6% 9 months
margin
Operating Result [€ m / % RoS] Net Cash Flow [€ m]
• Net Cash Flow muted because of investment in
new NEV factory and substantial working capital
6,282 8,284
build up (inventories and vehicles in transit)
4,169 4,579
9.9% 14.1%
Jan - Sep Jan - Sep Jan - Sep Jan - Sep
2021 2022 2021 2022
1 Before special items 2 The previous year’s figures were calculated by means of a simple addition with the Bentley figures
Audi A6 Avant e-tron: Concept car
22Sport & Luxury Brand Group Performance
January to September 2021 vs. 2022
Key Takeaways
Sport & Luxury Brand Group 1 • Porsche’s operating margin advanced to 19.4%
on higher volume, improved pricing and better
product mix as well as positive FX effects
Vehicle Sales [‘000 units] Sales Revenue [€ m]
• Average price per vehicle at € 110,000
209 221 24,456 • Automotive Net Cash Flow up substantially
20,979
• BEV share amounted to over 11% of total
deliveries
• Successful launch of Porsche 911 GT3 RS and
Jan - Sep Jan - Sep Jan - Sep Jan - Sep 911 Carrera T
2021 2022 2021 2022
Operating Result [€ m / % RoS] Net Cash Flow [€ m]
4,746
3,272
3,356 2,881
16.1% 19.4%
Jan - Sep Jan - Sep Jan - Sep Jan - Sep
2021 2022 2021 2022
1 Before special items
Porsche Taycan GTS Sport Turismo: Power consumption in kWh/100 km: combined 24.1 – 21.0; CO2-emissions in g/km: 0 (combined) Only consumption and emission values according to WLTP and not according to NEDC are available for the vehicle
23Software – CARIAD
January to September 2021 vs. 2022
Key Takeaways
CARIAD • Sales Revenue improved by 65% driven by
license revenues with brand groups
Contracted Licenses [‘000 units] Sales Revenue [€ m] • Operating Result impacted by higher
development costs and personnel costs
13,056 422 • Net Cash Flow at previous year’s level due to
9,722 further investments in software platforms
255
Jan - Sep Jan - Sep Jan - Sep Jan - Sep
2021 2022 2021 2022
Operating Result [€ m] Net Cash Flow [€ m]
-750
-1,427 -1,584 -1,545
Jan - Sep Jan - Sep Jan - Sep Jan - Sep
2021 2022 2021 2022
24Commercial Vehicles – TRATON Operations
January to September 2021 vs. 2022
Key Takeaways
TRATON Operations 1 • Unit sales up 11%, supported by Navistar
consolidation (-13% excl. Navistar 2)
Vehicle Sales [‘000 units] Sales Revenue [€ m] • Results significantly affected by supply
shortages and production stops at MAN as well
as impairments in relation to disposal of sales
196 218 27,964
21,305 businesses in Russia of € -0.2bn in Q3
• Lower capacity utilization and higher costs for
raw materials burdened 9 months results while
price and mix were positive
Jan - Sep Jan - Sep Jan - Sep Jan - Sep
• Net Cash Flow impacted by outflows relating to
2021 2022 2021 2022
legal proceedings (ca. € 1.4bn) and working
Operating Result [€ m / % RoS] Net Cash Flow [€ m] capital movements
954
-1,381
476
2.2% 3.4% -2,842
Jan - Sep Jan - Sep Jan - Sep Jan - Sep
2021 2022 2021 2022
1 excluding Scania FS
2 Navistar consolidated since July 1, 2021
25Financial Services Division Performance
January to September 2021 vs. 2022
Key Takeaways
Volkswagen Financial Services • Stable number of contracts and solid growth in
leasing business despite supply constraints
Contracts [in ‘000 units] Credit Loss Ratio [in %] • No significant increase in credit risks
recognizable but closely monitored as expected
Financing Leasing Insurance/Services
to increase slightly in the future due to inflation
22,236 21,958 and rising interest rates
0.32% • Used car prices stay at high level
0.28%
• Strong operating result sustaining return on
Jan - Sep Jan - Sep 30 Sep 30 Sep
equity on high level
2021 2022 2021 2022 • Q3 Operating Result of the division impacted by
impairments related to financial services
Operating Result [€ m] 1 Return on Equity [in %] business in Russia (€ 0.5bn)
26.1% 27.4%
3,967 4,190
Jan - Sep Jan - Sep Jan - Sep Jan - Sep
2021 2022 2021 2022
1 Volkswagen Financial Services Division (including Scania FS and Porsche Holding)
26China Joint Ventures
Proportionate Operating Result 2020, 2021 and Q3 2022
Key Takeaways
[€ m] • 9 months proportionate Operating
FY
3,602 Result clearly above 2021 and close to
Q3
2020 levels
Q2
3,026 • Improvement in Q3 driven by chip
Q1 availability, boost from government
incentives & pent up sales from Covid
9M: 2,632 related lockdowns
9M: 2,558
• FAW-VW continued its solid
1,228 1,156 performance in the first 9 months,
9M: 1,962
while SAIC Volkswagen reaccelerated in
690 Q3 on back of strong product and sales
performance
578 • 9 months BEV sales close to 113K units,
611 more than twice as many as 9 months
1,128
2021
661 824
276
2020 2021 2022e
ID.6 CROZZ: Vehicle sold outside Germany
27China: Milestones and shareholder structure of Chinese joint ventures
1984 2021
The joint venture agreement for Shanghai Audi FAW NEV Co. Ltd. was established to
Volkswagen Automotive Co. (today: SAIC produce electric vehicles based on PPE
VOLKSWAGEN) was signed in Shanghai.
platform.
1993 Audi FAW NEV Co. Ltd.
2024 (SOP)
40% 1983 (Santana B2) Audi joined the FAW- 40%
50%
Volkswagen joint venture. 55% FAW
SAIC
VCIC 1) VCIC
10% VW AG 5% Audi AG
The
Modernization and Portfolio Expansion
Beginnings
First contact with China - the FAW-Volkswagen was established. Volkswagen and JAC established a new CARIAD’s first
Chinese government identified and joint venture for electric vehicles. subsidiary
chose Volkswagen as a partner. 5% outside Europe
was
1991 (Jetta)
25% 25% established.
60% 2023 (SOP)
FAW VCIC 75%
1978 JAC
10%
VW AG Audi AG VCIC
1991
Note: VCIC 100% owned by Volkswagen AG 2017 2022
1 VW AG includes the stakes held by ŠKODA AUTO a.s. and Audi AG.
28Volkswagen Group China operations
•
Headquarter and Production Facilities Facts and Figures
40 production plants in China in 2021
6 FAW-Volkswagen vehicle plants
Changchun (2 plants)
Urumqi Changchun Chengdu
Foshan (1 MEB plant)
Dalian
Qingdao
Beijing Tianjin
Tianjin
Qingdao 9 SAIC VOLKSWAGEN vehicle plants
Yizheng Shanghai (3 MQB plants + 1 MEB plant)
Chengdu Hefei Nanjing
Nanjing
Shanghai Yizheng
Ningbo
Changsha
Ningbo Urumqi
Changsha
Foshan
Volkswagen (Anhui) Automotive Co. Ltd., Hefei MEB plant (in
construction)
FAW-Volkswagen vehicle plants
23 component plants (incl. battery system plant)
SAIC VOLKSWAGEN vehicle plants
Battery workshops
Volkswagen Anhui vehicle plant
Headquarter
Audi PPE vehicle plant CARIAD China subsidiary established in 2022
Component plants
Note: excl. MAN, ICS and 8 Gotion plants
Vehicles sold outside Germany
VW ID.3 VW ID.4 X/CROZZ VW ID.6 X/CROZZ AU Q4 e-tron AU Q5 e-tron AU Q6
29Table of Contents
Key Facts & History
Strategy
Operations
Financials
ESG
Share Information
30Decarbonization, Circular Economy, Responsibility in Supply Chain & Business,
Diversity, People & Transformation and Integrity are our current ESG focus areas
IMPROVE ESG Performance
Decarbonization Circular Economy Responsibility in Supply Chain & Business
Diversity People & Transformation Integrity
Orientation Reputation Value-Driver Transformation
31In our Group decarbonization program, emission reduction targets are set on a life
cycle basis & measured by the DKI – net carbon neutrality to be reached by 2050
Volkswagen Group Decarbonization Path until 2050 (Scope: Passenger Cars and Light Duty Vehicles) How we act
Science Based Targets initiative approved: Net carbon neutral: Group Decarbonization
• DCI to be reduced by 30% compared to 2018 The Volkswagen group and target
DCI (t CO2e/veh.)
• Reduction measures credited only its products to be
net carbon neutral Avoid
• Ambition level for scope 1-2 is aligned with a 1.5°c
decarbonization pathway
Avoid & Reduce Reduce
CO2e-Footprint
Volkswagen Offset
compensate remove
2018
2030 2050
Baseline
32Sustainable Financing as part of our DNA
We believe that Green Debt We target to increase the use of We want to stay in regular contact
Instruments are effective tools to Green Debt Instruments in the and exchange with you – our
channel investments to projects coming years significantly. All our investors – on further
that demonstrate climate benefits future Green Bond transactions will developments in the field of
and thereby contribute to the (re-) finance our EU taxonomy sustainable and green debt
achievement of the Paris Climate aligned capital expenditures. instruments. We appreciate the
Agreement and the United Nations’ dialogue with you and have the
Sustainable Development Goals clear ambition to match or exceed
(“UN SDGs”). your expectations.
ID.3 Pro Performance: Power consumption in kWh/100 km: combined 16.3 - 15.2; CO2-emissions in g/km: 0 (combined)
Only consumption and emission values according to WLTP and not according to NEDC are available for the vehicles
33Workforce transformation as central strategic objective of Volkswagen
in the forthcoming decade
ILLUSTRATIVE
Product strategy affects needed Workforce expects side by side Labour costs as massive impact
skills and quantity of work process of growth, re-location and factor
dismantling
Restructuring programs
ICE BEV
Roadmap:
Digitale Transformation
Software driven products
New business fields
Effective management
.
of wages in the
MaaS & TaaS transformation essential
ID.3 Pro Performance: Power consumption in kWh/100 km: combined 16.3 - 15.2; CO2-emissions in g/km: 0 (combined)
Golf eHybrid: Fuel consumption in l/100 km: combined 1.6-1.4; power consumption in kWh/100 km: combined 10.8-10.1; CO₂-emissions in g/km: 36-33 (combined)
Volkswagen ID.7/AERO: Vehicles is a near-production concept car
Only consumption and emission values according to WLTP and not according to NEDC are available for the vehicles
34Strategic workforce planning is starting point for sustainable workforce
transformation
Objectives Process Measures
HR-Measures
Transparency of qualitative Workforce supply Workforce
staffing development simulation demand planning Possible approaches
Future supply Future demand • Qualification and training strategy
Number
• Restructuring
Dealing with strategic
personnel and competence • Flexibilization of capacity
2021 2030 2021 2030
requirements • Recruiting
• Employer Branding
Identify fields of action & Gap-Analysis • Own contribution / outsourcing
derivation of measures Identification of qualitative and • …
quantitative surpluses and gaps
Support for transformation
35VW Group Values
II IV
We are
honest and
We live
speak up when
diversity.
something
I III
We take
is wrong.
responsibility
We break
for the environ-
new ground.
ment and
VI V
society. We are
proud of
We, not me.
the work Together4Integrity
we do.
VII
is our holistic
We keep Integrity &
our word.
Compliance program
36ESG targets - integral part of annual bonus of Board of Management members since
2021
Functionality of the annual bonus
Target achievement
1/2 1/2
Return On Sales
Operating Result ESG-Performance
(ROS)
Payout
Target value (Cap: 180 %
ESG-Performance of the target value)
1/2 1/2
Environment (E) Social (S) Governance (G)
Decarbonization Opinion Index / Factor Compliance /
Index Diversity Index Integrity
• Basic continuation of the previous system (introduced in 2017)
• Starting with 2021 financial year, ESG multiplier is added as new dimension
Key facts
• Defines a balance between financial key performance indicators and ESG targets
• Performance measures reflect Volkswagen’s NEW AUTO strategy and transformation process
38ESG relevant reports & sources of information
“The Green Finance Framework consistently links
our corporate objective of carbon neutrality in 2050
with our financing strategy.”
Green Finance Report
www.volkswagenag.com >
investor relations > fixed
income > green finance *
www.volkswagenag.com/presence/nachhaltigkeit
www.volkswagenag.com > sustainability > /documents/supply-chain/Volkswagen-Group- www.volkswagenag.com > Investor Relations >
reporting Responsible-Raw-Materials-Report-2021.pdf Corporate Governance > ESG Controversies
39Table of Contents
Key Facts & History
Strategy
Operations
Financials
ESG
Share Information
40Volkswagen Share Information
Shareholder Structure as of December 31, 2021 Volkswagen Share Data and Indices
As a percentage of subscribed capital
ESG Rating Coverage and Memberships
ESG: Memberships:
MSCI World SRI United Nations Global Impact
Sustainalytics
Institutional Shareholder Services (ISS)
Standard & Poor‘s (S&P)
Moody’s ESG Solutions
41Investor Relations Team
We are pleased to answer your inquiries regarding Volkswagen shares and other
capital market related questions
Rolf Woller Julian Krell
Head of Group Treasury & Investor Relations Head of Group Investor Relations
E-Mail: rolf.woller@volkswagen.de E-Mail: julian.krell@volkswagen.de
Telephone: +49 5361 9 24184 Telephone: +49 5361 9 13257
Helen Beckermann Monika Dühring
Senior Investor Relations Manager Investor Relations Manager | Equity
E-Mail: helen.beckermann@volkswagen.de E-Mail: monika.duehring@volkswagen.de
Telephone: +49 5361 9 49015 Telephone: : +49 5361 9 31106
Andreas Buchta Björn-Michael Piesch
Senior Investor Relations Manager | Equity & Key Contact USA Senior Investor Relations Officer | Equity
E-Mail: andreas.buchta@volkswagen.de E-Mail: bjoern-michael.piesch@volkswagen.de
Telephone: +49 5361 9 40765 Telephone: +49 5361 9 196310
Ulrich Hauswaldt Christopher Macke
Senior Investor Relations Officer | Equity, Debt & ESG Senior Investor Relations Officer | Equity
E-Mail: ulrich.hauswaldt@volkswagen.de E-Mail: christopher.macke@volkswagen.de
Telephone: +49 5361 9 42224 Telephone: +49 5361 9 14756
Alexander Hunger Lai Wang (Beijing Office)
Senior Investor Relations Manager | Equity & ESG Investor Relations Manager | Equity & Key Contact China/Asia-Pacific
E-Mail: alexander.hunger@volkswagen.de E-Mail: lai.wang@volkswagen.com.cn
Telephone: +49 5361 9 47420 Telephone: +86 10 6531 5356
The official website of Volkswagen Group Investor Relations. Company topics, brandchannels, innovation and informations.
42Backup
43The Shareholder Structure, Supervisory and Management Board
Shareholder Structure of Volkswagen AG Supervisory Board of Volkswagen AG Management Board of Volkswagen AG 1
Number of Outstanding Shares Chairman Hans Dieter Pötsch Chairman of the Management Dr. Oliver Blume
Board of Volkswagen AG and Dr.
Preferred shares Members Dr. Hessa Sultan Al Jaber Ing. h.c. F. Porsche AG
206,205,445 Mansoor Bin Ebrahim Al-Mahmoud
41.1% Finance & Operations Dr. Arno Antlitz
Daniela Cavallo *
58.9%
Mathías Carnero * Member of the board of
Ralf Brandstätter
Julia Willie Hamburg Volkswagen AG for China
Ordinary shares Marianne Heiß Integrity & Legal Affairs Dr. Manfred Döss
295,089,818 Jörg Hofmann *
Dr. Arno Homburg * Brand Group ‘Premium’ Markus Duesmann
Current Voting Rights Distribution Simone Mahler * Human Resources and Brand Gunnar Kilian
Others Peter Mosch * Group ‘Truck & Bus‘
Qatar Holding 9.7% Daniela Nowak *
Dr. jur. Hans Michel Piëch CEO of the Volkswagen Thomas Schäfer
Passenger Cars Brand, Member
17.0% Dr. jur. Ferdinand Oliver Porsche
of the Volkswagen AG Board of
53.3% Porsche SE, Dr. rer. comm. Wolfgang Porsche Management in charge of the
20.0% Stuttgart
Jens Rothe * Brand Group Volume
Conny Schönhardt *
State of Lower Technology Thomas Schmall
Stephan Weil
-von Westerhold
Saxony, Hanover Werner Weresch *
(as at December 31, 2021) IT Hauke Stars
1 Each Board Member is responsible for one or more functions within the Volkswagen Group. The work of the Management Board of Volkswagen AG is supported by the boards of the brands and regions as well as by the other group business 44
units and holdings. * Employee representativeYou can also read