Volcanic Tremor Extraction and Earthquake Detection Using Music Information Retrieval Algorithms
←
→
Page content transcription
If your browser does not render page correctly, please read the page content below
Volcanic Tremor Extraction and
              Earthquake Detection Using Music
              Information Retrieval Algorithms
              Zahra Zali*1,2 , Matthias Ohrnberger1 , Frank Scherbaum1 , Fabrice Cotton1,2 , and Eva P. S. Eibl1

                  Abstract
                  Volcanic tremor signals are usually observed before or during volcanic eruptions and must
                  be monitored to evaluate the volcanic activity. A challenge in studying seismic signals of
                  volcanic origin is the coexistence of transient signal swarms and long-lasting volcanic
                  tremor signals. Separating transient events from volcanic tremors can, therefore, contrib-
                  ute to improving upon our understanding of the underlying physical processes.
                  Exploiting the idea of harmonic–percussive separation in musical signal processing,
                  we develop a method to extract the harmonic volcanic tremor signals and to detect tran-
                  sient events from seismic recordings. Based on the similarity properties of spectrogram
                  frames in the time–frequency domain, we decompose the signal into two separate spec-
                  trograms representing repeating (harmonic) and nonrepeating (transient) patterns,
                  which correspond to volcanic tremor signals and earthquake signals, respectively.
                     We reconstruct the harmonic tremor signal in the time domain from the complex
                  spectrogram of the repeating pattern by only considering the phase components for
                  the frequency range in which the tremor amplitude spectrum is significantly contribut-
                  ing to the energy of the signal. The reconstructed signal is, therefore, clean tremor
                  signal without transient events.
                     Furthermore, we derive a characteristic function suitable for the detection of tran-
                  sient events (e.g., earthquakes) by integrating amplitudes of the nonrepeating spectro-
                  gram over frequency at each time frame. Considering transient events like earthquakes,
                  78% of the events are detected for signal-to-noise ratio = 0.1 in our semisynthetic tests.                                            Cite this article as Zali, Z.,
                                                                                                                                                        M. Ohrnberger, F. Scherbaum, F. Cotton,
                  In addition, we compared the number of detected earthquakes using our method for                                                      and E. P. S. Eibl (2021). Volcanic Tremor
                  one month of continuous data recorded during the Holuhraun 2014–2015 eruption in                                                      Extraction and Earthquake Detection
                                                                                                                                                        Using Music Information Retrieval
                  Iceland with the bulletin presented in Ágústsdóttir et al. (2019). Our single station event                                           Algorithms, Seismol. Res. Lett. XX, 1–14,
                  detection algorithm identified 84% of the bulletin events. Moreover, we detected a                                                    doi: 10.1785/0220210016.
                  total of 12,619 events, which is more than twice the number of the bulletin events.                                                   Supplemental Material

              Introduction                                                                                    tectonic earthquakes or other transient signals occurring
              Volcanic tremors are long-lasting low-frequency seismic sig-                                    during a period of volcanic unrest (Dmitrieva et al., 2013;
              nals that frequently precede or accompany volcanic eruptions                                    Hotovec et al., 2013; Eibl, Bean, Vogfjörd, et al., 2017), affect-
              (McNutt, 1992). They can reveal information about eruptive                                      ing the observability of the tremor signal. Both volcanic
              activities (Alparone et al., 2003; Eibl, Bean, Jónsdóttir, et al.,                              tremors and earthquakes may help better understand the
              2017; Eibl, Bean, Vogfjörd, et al., 2017) and are one of the most                               underlying physical processes of volcanic eruptions; however,
              commonly studied signals in volcano seismology (Falsaperla                                      the superposition of signals makes it challenging to study the
              et al., 2005) for use in eruption forecasting as well as investi-                               details of each signal separately. A reliable signal processing
              gating the physics of the underlying volcanic processes                                         operation is, thus, required to separate earthquakes as well as
              (Chouet, 1996; Yukutake et al., 2017).
                 Despite different hypothesis about the generation mecha-
                                                                                                              1. Institute of Geosciences, University of Potsdam, Potsdam, Germany, https://orcid
              nisms of volcanic tremors, the details are not yet well under-                                  .org/0000-0002-2802-9927 (ZZ);           https://orcid.org/0000-0003-1068-0401 (MO);
              stood (Davi et al., 2012; Eibl, Bean, Jónsdóttir, et al., 2017), and                                https://orcid.org/0000-0002-5050-7331 (FS);          https://orcid.org/0000-0002-
                                                                                                              9242-3996 (FC);        https://orcid.org/0000-0002-0667-0035 (EPSE); 2. GFZ German
              a variety of physical processes may explain the seismological                                   Research Centre for Geosciences, Potsdam, Germany
              evidence observed so far (Hellweg, 2000). Volcanic tremor                                       *Corresponding author: zali@uni-potsdam.de
              signals are usually seen in the seismic records alongside many                                  © Seismological Society of America

              Volume XX        •   Number XX          •   – 2021      •   www.srl-online.org                                                          Seismological Research Letters              1

Downloaded from http://pubs.geoscienceworld.org/ssa/srl/article-pdf/doi/10.1785/0220210016/5364359/srl-2021016.1.pdf
by 19407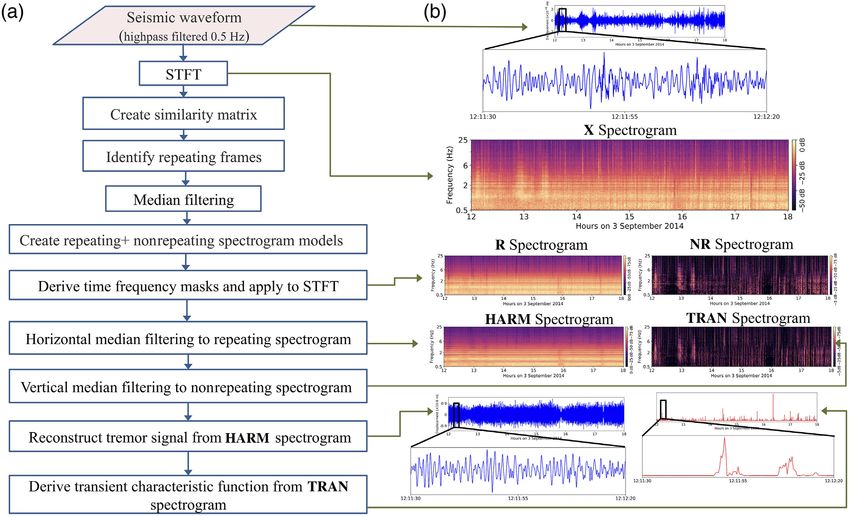
other transient signals from the volcanic tremor signals in                                         Here, in the first step of our method, we adopted the
                  the recorded seismic waveforms during periods of volcanic                                       repetition/similarity (REPET-SIM) method (Rafii and
                  unrest. There have been attempts in terms of the detection                                      Pardo, 2012; Rafii et al., 2014) to separate volcanic tremors
                  and discrimination of volcanic tremor and tectonic earthquake                                   from transient earthquakes. The advantage of this method is
                  signals in previous studies. For example, an automatic P- and                                   its ability to process music pieces with quickly varying repeat-
                  S-wave detection was used in Rouland et al. (2009) to identify                                  ing structures without the need to identify periods of the
                  volcanic tremors as events containing only P-type wave, and                                     repeating structure beforehand. The approach evaluates
                  tectonic earthquakes containing both P and S waves.                                             the underlying repeating structure by looking for the similar-
                  However, this study introduces for the first time the topic                                     ities in the spectrogram time frames. This repeating part of
                  of extracting tremor signals from seismic waveforms and                                         the signal is then subtracted from the original spectrogram.
                  reconstructing the volcanic tremor signal with related phase                                    The remaining time frames contain the percussive events. We
                  information.                                                                                    use this approach and apply it to seismic data collected from a
                      Inspired by similarities of seismic and acoustic signals, we                                volcano. In this setting, repeating structures, which result in a
                  take advantage of the expertise developed in the field of music                                 harmonic spectrum, correspond to volcanic tremors and per-
                  information retrieval (MIR) and audio signal processing. A                                      cussive (nonrepeating and impulsive) elements correspond-
                  seismic waveform is the record of the Earth vibrations, which,                                  ing to transient events such as earthquakes. Another method
                  in terms of signal properties and generation mechanism, can be                                  similar to REPET-SIM for HPS was proposed by FitzGerald
                  seen to be similar to sound signals generated by musical instru-                                (2010), which we use in the second step of our method to
                  ments (including the human voice) (Schlindwein et al., 1995;                                    remove remaining percussive components in the repeating
                  Johnson and Watson, 2019). Exploiting the extensive research                                    spectrogram and vice versa.
                  results in MIR (e.g., Müller, 2015), we have developed a seis-                                      The remainder of this paper is organized as follows. In the
                  mological data processing scheme for the purpose of separating                                  Method section, we describe existing methods in MIR for our
                  volcanic tremor signals from transient signals generated during                                 problem (see the HPS Algorithms section) and explain how we
                  a volcanic crisis.                                                                              developed our method based on these algorithms. Modifications
                      The separation of harmonic and percussive components of                                     to and the application of the REPET-SIM method (Rafii and
                  sound is of great interest in musical signal processing (e.g.,                                  Pardo, 2012; Rafii et al., 2014) and the HPS using median filtering
                  Rafii and Pardo, 2011). Pop music, for example, often consists                                  (FitzGerald, 2010) for extracting seismic tremor signals are out-
                  of a repetitive percussive background and a vocal foreground,                                   lined in the Volcanic Tremor Extraction Approach section,
                  which is locally nonrepetitive (FitzGerald, 2012). In this type of                              whereas the Transient Signal Detection and Timing Estimation
                  music, the different characteristics of harmonic and percussive                                 section describes the detection and timing of the remaining tran-
                  sounds in the spectrogram domain (see Müller, 2015) allow a                                     sient events (e.g., earthquakes). The Parameters Selection section
                  separation of foreground vocals from the more percussive                                        outlines the selection of the method’s parameters. The Datasets
                  background sound (FitzGerald and Gainza, 2010). Similarly,                                      and Testing section presents the generation of semisynthetic data
                  a seismic waveform during an eruption may consist of (har-                                      (see the Generation of Semisynthetic Data section)—an evalu-
                  monic) volcanic tremor signals over which transient seismic                                     ation of the proposed method based on a semisynthetic test
                  signals are superimposed. The long-duration volcanic tremor                                     on tremor extraction (see the Testing the Tremor Extraction
                  signal that lasts minutes to days with a restricted frequency                                   Algorithm Using Semisynthetic Data section) and earthquake
                  range (1–9 Hz according to McNutt, 1992) contrasts with tran-                                   detection (see the Testing the Earthquake Detection Algorithm
                  sient seismic signals such as earthquakes with a wider range of                                 Using Semisynthetic Data section), as well as real data tests
                  frequencies (0.1–30 Hz in this study). In particular, harmonic                                  (see the Real Data Tests section). The feasibility of the method
                  volcanic tremor signals with distinct spectral lines are readily                                with respect to processing speed is discussed in the Feasibility of
                  distinguishable from transient, short-duration (seconds) seis-                                  the Method with Respect to Processing Speed section. In the
                  mic events in the time–frequency domain. In musical signal                                      Conclusions and Outlook section, we discussed the results and
                  processing, the goal of harmonic–percussive source separation                                   provided our conclusions about the applicability of the
                  is to decompose an input signal into the sum of two signals—                                    method.
                  one consisting of all harmonic components and the other of all
                  percussive components (Müller, 2015). The same algorithms                                       Method
                  could be implemented in the seismology domain to decompose                                      HPS algorithms
                  a seismic signal into its harmonic components (harmonic                                         HPS as an application of musical source separation (Cano et al.,
                  volcanic tremors) and percussive components (transient events                                   2018) has attracted significant attention in MIR research in
                  such as earthquakes). In musical signal processing, several                                     recent years (Rafii et al., 2018). HPS algorithms are based
                  methods for harmonic–percussive separation (HPS) have been                                      on the different characteristics of harmonic and percussive
                  suggested (Müller, 2015).                                                                       components in a music signal.

                  2       Seismological Research Letters                                                               www.srl-online.org   •   Volume XX   •   Number XX   •   – 2021

Downloaded from http://pubs.geoscienceworld.org/ssa/srl/article-pdf/doi/10.1785/0220210016/5364359/srl-2021016.1.pdf
by 19407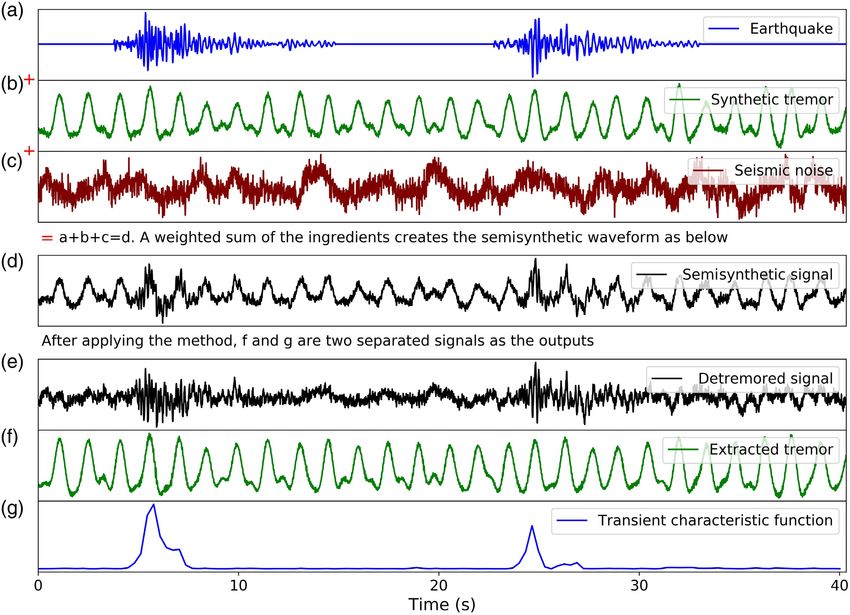
Harmonicity expresses the situation in which the complete Repeating time–frequency bins are captured by the median
signal can be seen as the superposition of spectral components and build the repeating spectrogram model W. A refined repeat-
(partials) for which frequencies are all integer multiples of a fun- ing spectrogram model W′ is created by taking the minimum
damental frequency. Harmonics form stable horizontal ridges in between W and V. The rationale is that the nonnegative spectro-
a short-time Fourier transform (STFT) spectrogram, which gram V is the sum of two nonnegative spectrograms of repeating
means constant frequencies exist along the time axis. A percus- and nonrepeating patterns, and, hence, W is less than or at most
sive (impulsive) sound is short and similar to the sound of equal to V.
hitting a drum. Percussive signals form vertical ridges in an In the following, a time–frequency mask M is derived by
STFT spectrogram, corresponding to the existence of different normalizing W′ by V. Time–frequency bins with repeating
frequencies in an instant, that is, a broadband characteristic of patterns will have values close to 1 in M, and time–frequency
short duration. bins without repeating patterns will have values close to 0. The
To separate harmonic and percussive elements, one simple mask M is applied to STFT X, and the repeating spectrogram
approach is to apply a median filter to the STFT spectrogram of will be created. Finally, the harmonic signal in music is
the signal (FitzGerald, 2010). Median filters are usually used to obtained by inverting the repeating spectrogram into the time
remove noisy parts of a signal by replacing each sample by the domain. The percussive signal is obtained by subtracting the
median value determined from the neighboring samples within harmonic signal from the input signal (Rafii and Pardo, 2012).
a specific window. Within the HPS, a median filter applied
along the horizontal axis of the spectrogram (time) suppresses Volcanic tremor extraction approach
“short-lived” broadband percussive components interrupting Among the different tremor observations in volcanic seismol-
the long-lasting horizontal narrowband ridges. This results ogy, the so-called harmonic tremor is a special signal showing a
in a “denoised” harmonic spectrogram. Similarly, applying a band-limited harmonic spectrum. It has been observed at
median filter along the vertical axis of a spectrogram (fre- many volcanoes and has been reported often during times
quency) emphasizes short-lived broadband features, while sup- of increased volcanic activity, and is thought to be connected
pressing long-lasting narrowband horizontal frequency lines to fluid flow or (de-)pressurization of the volcanic system (e.g.,
(harmonic components) and results in a “denoised” percussive Montegrossi et al., 2019). This is the motivation for using HPS
spectrogram. These two median filters are used separately to algorithms to separate harmonic volcanic tremor signals from
generate the related spectrograms with dominant harmonic earthquake signals representing the percussive event type.
or percussive content, respectively. Being able to extract this special kind of tremor signal from
Another promising approach for our purpose is REPET-SIM, seismic waveforms provides the opportunity to improve the
which treats repetition as a basic property in generating and per- observations and analyses of harmonic tremors. In particular,
ceiving structure in music (Rafii and Pardo, 2012; Rafii et al., extracting low-amplitude harmonic tremor signals that are
2014). The main step in this method is to identify similar patterns hidden in the background seismic noise or overprinted by
using a calculated similarity matrix. Given a music signal, first its earthquake sequences accompanying volcanic activity may
complex STFT is calculated, which is named X here. Considering allow new insights into the generation processes and their
V as the amplitude spectrogram V jXj, the similarity matrix S relationships to volcanic eruptive activity.
is calculated to measure the cosine similarity (the similarity In this study, we analyze the seismic waveforms of the
between two vectors of an inner product space) between time Holuhraun 2014–2015 eruption in Iceland (FLUR station from
frames of the spectrogram V. As shown in equation (1), the network 7Z; White, 2010) to separate the harmonic and percus-
cosine similarity is calculated through the multiplication of the sive components. Figure 1 shows the eruption site and the sta-
transposed V by V with normalization of the V time frames: tion location in Iceland with an example of one day of seismic
Pn waveforms (Fig. 1a,b), the power spectral density (PSD), and the
i1 Vi; ja Vi; jb spectrogram (Fig. 1c,d). The PSD and spectrogram of the
Sja ; jb pP pP
; 1
i1 Vi; ja i1 Vi; jb
EQ-TARGET;temp:intralink-;df1;41;223
n 2 n 2 extracted harmonic components are shown in Figure 1e,f.
Our method is derived from a combination of the REPET-
in which ∀ja ; jb ∈ 1; m, in which m is the number of time frames SIM method (Rafii and Pardo, 2012; Rafii et al., 2014) and the
and n is the number of frequency channels for each time frame. HPS algorithm given by FitzGerald (2010), after tuning
Sja ; jb is then the cosine similarity between the time frames ja parameters to adapt it to seismic data. For building our
and jb of the spectrogram V. method, we used Librosa—a Python package for audio and
For all the frames j in V, similar frames are identified using a music signal processing (McFee et al., 2020). Furthermore,
threshold in the similarity matrix and stored in an array J. A we implement a phase reconstruction procedure for the vol-
repeating spectrogram model W is then derived using the canic tremor signal. A detection algorithm for earthquakes as
similar frames. For all the frames j, the corresponding frame transient signals has been derived as a by-product of the
in W is derived by taking the median of J for each frequency. applied processing.
Volume XX • Number XX • – 2021 • www.srl-online.org Seismological Research Letters 3
Downloaded from http://pubs.geoscienceworld.org/ssa/srl/article-pdf/doi/10.1785/0220210016/5364359/srl-2021016.1.pdf
by 19407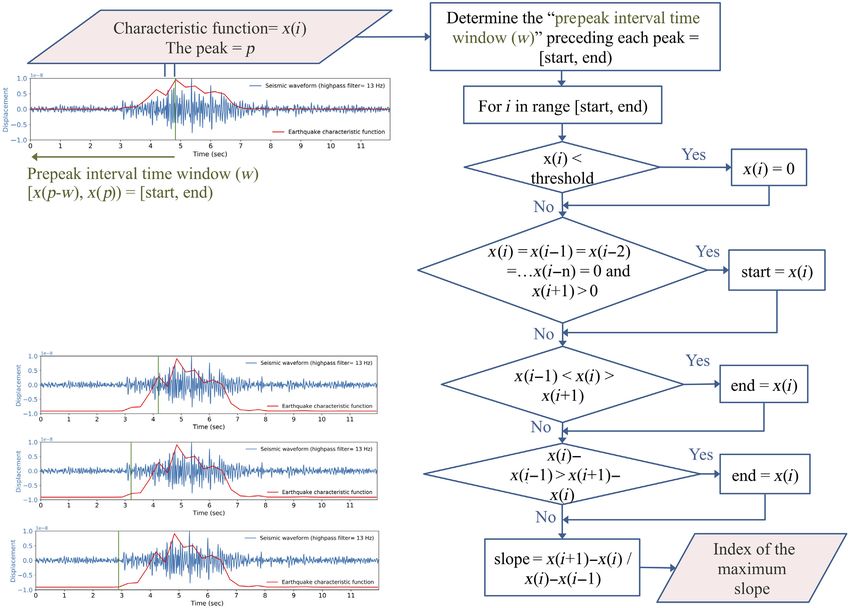
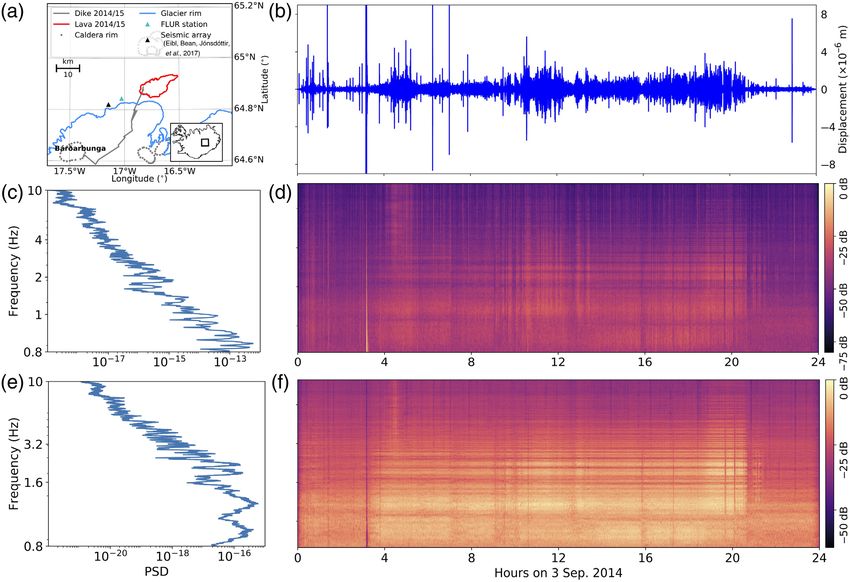
The REPET-SIM, as described in the HPS Algorithms                                            Figure 1. Aspects of the Holuhraun 2014–2015 eruption data and
                  section, is used to create a similarity matrix and to derive a                                  the application of the proposed method. (a) The eruption site and
                  time–frequency model of repeating patterns. We derive the                                       the station location. Glacier, the 2014 formed dyke segments as
                                                                                                                  described in Sigmundsson et al. (2015), FLUR station, the erupted
                  nonrepeating spectrogram model by subtracting W′ from V.
                                                                                                                  lava flow field in Holuhraun, Bárdarbunga volcano, and the seismic
                  Once the model spectrograms are calculated, they are used                                       array (Eible, Bean, Jónsdóttir, et al., 2017) are marked. The inset
                  to derive two time–frequency masks for repeating and nonrep-                                    map in the bottom right shows the location in Iceland. (b) An
                  eating patterns.                                                                                example of real data from 3 September 2014 (HHZ component of
                     We modified the REPET-SIM algorithm using a soft mask                                        FLUR station from network 7Z; White, 2010). (c) The power
                                                                                                                  spectral density (PSD) and the (d) spectrogram of this day for the
                  via Wiener filtering (Vaseghi, 1996) instead of a binary mask.
                                                                                                                  raw seismic data. (e) The PSD and the (f) spectrogram for the
                  The calculation of the soft mask M1 and M2 are shown as fol-                                    extracted tremor signal using the proposed method. The color
                  lowing equations:                                                                               version of this figure is available only in the electronic edition.

                                                             W′P
                                             M1                         ;                             2
                                                          W  V − W′ P
                                                             ′P
                  EQ-TARGET;temp:intralink-;df2;53;223

                                                                                                                  Equation (4) shows the element-wise multiplication of the
                                                                                                                  repeating mask M1 and the input amplitude spectrogram V:

                                                             V − W′ P                                                                                   R  M1 ⊗ V;                                                   4
                                             M2                           ;                           3
                                                                                                                  EQ-TARGET;temp:intralink-;df4;320;170

                                                          V − W′ P  W′P
                  EQ-TARGET;temp:intralink-;df3;53;170

                                                                                                                  in which R denotes the repeating amplitude spectrogram. The
                  in which M1 is a repeating mask, and M2 is a nonrepeating                                       same element-wise multiplication operation is applied for the
                  mask. A power factor P is applied to the model spectrograms                                     nonrepeating mask and the input amplitude spectrogram as it
                  to further enhance the signal-to-noise ratio (SNR). We use a                                    is shown in the following equation:
                  power factor of 2 in our calculations.
                                                                                                                  EQ-TARGET;temp:intralink-;df5;320;94    NR  M2 ⊗ V;                                                  5
                     Once we have constructed the masks, we multiply them with
                  the input amplitude spectrograms to separate the components.                                    in which NR denotes the nonrepeating amplitude spectrogram.

                  4                                      Seismological Research Letters                                                                     www.srl-online.org   •   Volume XX   •   Number XX   •   – 2021

Downloaded from http://pubs.geoscienceworld.org/ssa/srl/article-pdf/doi/10.1785/0220210016/5364359/srl-2021016.1.pdf
by 19407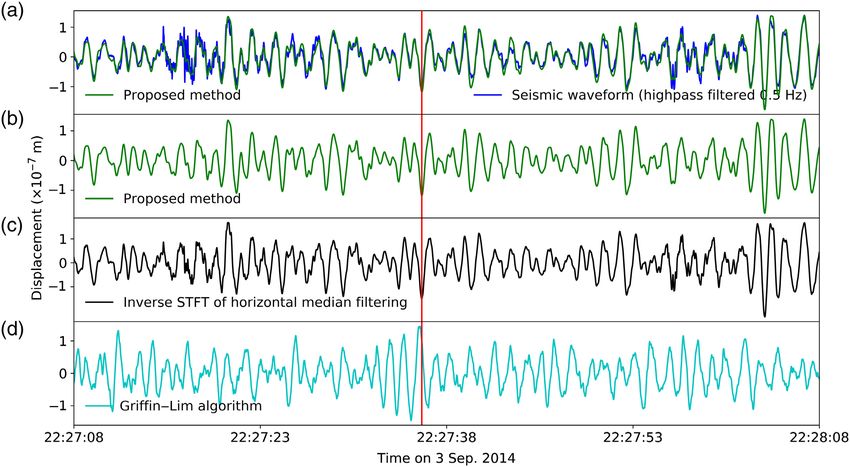
From this, we obtain two spectrograms—one for repeating                                               harmonic spectrogram (HARM spectrogram), and the percus-
              patterns and one for nonrepeating patterns. The harmonic and                                              sive component of the nonrepeating spectrogram shows the
              percussive components of the signals are separated into their                                             final result for the transient or percussive spectrogram
              respective masked spectrograms, although small traces of                                                  (TRAN spectrogram). The HARM spectrogram corresponds
              percussive components are still visible in the repeating spectro-                                         to the tremor spectrogram according to our assumptions of
              gram, and remnants of the harmonic components can be rec-                                                 the generating process. From the tremor spectrogram in the
              ognized in the nonrepeating spectrogram. Therefore, a second                                              frequency domain, the tremor signal can be reconstructed
              HPS approach is subsequently applied to the resulting spectro-                                            in the time domain. The problem of reconstructing a signal
              grams from the first processing step using the median filtering                                           from its modified STFT has varieties of applications in audio
              method of FitzGerald (2010). In particular, we use median                                                 signal processing, in which modifications are applied to the
              filtering along the time axis, enhancing the harmonic compo-                                              amplitude STFT and the phase information is lost (Sturmel
              nents within the spectrogram. Applying another median filter-                                             and Daudet, 2011). The standard phase reconstruction
              ing along the frequency axis results in a denoised spectrogram                                            Griffin–Lim algorithm (Griffin and Lim, 1984), which is based
              of the percussive components. Following the previous nota-                                                on random phase initialization followed by the minimization
              tion, each spectrogram of R and NR will be decomposed into                                                of the squared error between the STFT of the estimated signal
              two spectrograms of their harmonic and percussive compo-                                                  and the modified STFT, shows poor performance for our seis-
              nents. Equations (6) and (7) show this separation:                                                        mological test signals. The random initialization of phase is an
                                                                                                                        inadequate starting model for the inversion procedure and
              EQ-TARGET;temp:intralink-;df6;41;522   R  H1  P1;                                                 6   results in an unreliable signal estimate. The problem of this
                                                                                                                        inadequate signal reconstruction is illustrated by an example
                                                                                                                        (Fig. 3d) and is described at the end of this section.
              EQ-TARGET;temp:intralink-;df7;41;475   NR  H2  P2;                                                7      We must use phase information of the original STFT X to
                                                                                                                        reconstruct the signal in the time domain. Considering the
              in which H1 and P1 are harmonic and percussive components                                                 notation in the HPS Algorithms section, we calculate the
              of the repeating spectrograms, and H2 and P2 are harmonic                                                 similarity matrix based on V as the amplitude spectrogram.
              and percussive components of the nonrepeating spectrograms.                                               Therefore, we need to separate the complex-valued spectro-
              We create a soft mask using H1 and multiply it by the R                                                   gram X into its amplitude V and phase components using
              spectrogram, which results in the final harmonic spectrogram,                                             the following equation:
              which we name HARM. Another soft mask is created using P2
              and is multiplied by the NR spectrogram to derive the final                                               EQ-TARGET;temp:intralink-;df8;308;379   X  V × exp1j × φ;                                         8
              transient spectrogram that we have named TRAN (see Fig. 2).
                 Figure 2 shows the flowchart of the method with an example                                             in which φ denotes the phase of X, and j is the imaginary unit.
              of a seismic waveform from 3 September 2014 during the                                                    The procedure of using the initial phase matrix is more prob-
              Holuhraun 2014–2015 eruption in Iceland (FLUR station from                                                lematic than it might seem at first glance. Simply using the
              network 7Z; White, 2010). On this day, we were four days into                                             phase information of X can lead to a noisy reconstructed signal
              a six-month-long fissure eruption accompanied by tremors                                                  due to the noise contributions in the phase matrix of the seis-
              and long-period (LP) and volcano-tectonic earthquakes                                                     mic waveform. Therefore, we use the values of the phase matrix
              (Eibl, Bean, Vogfjörd, et al., 2017). For further details on                                              only in the dominant frequency band of the HARM spectro-
              the background of the Holuhraun eruption event, the reader                                                gram. We do so by integrating the HARM spectrum amplitude
              is referred to Sigmundsson et al. (2015) and Gudmundsson                                                  squared for all time frames and determine the starting fre-
              et al. (2016). For details on the events on 3 September                                                   quency as the 5% quantile of the total energy in the spectrum
              2014, the reader is referred to Eibl, Bean, Vogfjörd, et al.                                              and the stop frequency as the 95% quantile, respectively. The
              (2017) and Woods et al. (2018).                                                                           dominant frequency band is between the start and stop
                 Besides describing the processing steps (Fig. 2a), we show                                             frequencies. Then, we add this modified phase information
              an input waveform and its spectrogram, which is decomposed                                                (weighted phase information) named φt to the HARM spectro-
              in two steps (Fig. 2b). In the first step using the modified                                              gram using the following equation:
              REPET-SIM algorithm, we decompose the X spectrogram into
              a “repeating” spectrogram (R spectrogram) and a “nonrepeat-                                               EQ-TARGET;temp:intralink-;df9;308;145   T  HARM × exp1j × φt ;                                    9
              ing” spectrogram (NR spectrogram). Each of these two spec-
              trograms are then decomposed into their harmonic and                                                      in which T is the complex tremor spectrogram, and HARM is
              percussive components in the subsequent step, following the                                               the harmonic amplitude spectrogram.
              algorithm of FitzGerald (2010). The harmonic component of                                                    Finally, we reconstruct the tremor signal time series from
              the repeating spectrogram shows the final result for the                                                  the complex spectrogram T, using the inverse STFT. The

              Volume XX                                       •     Number XX   •   – 2021   •   www.srl-online.org                                                                         Seismological Research Letters    5

Downloaded from http://pubs.geoscienceworld.org/ssa/srl/article-pdf/doi/10.1785/0220210016/5364359/srl-2021016.1.pdf
by 19407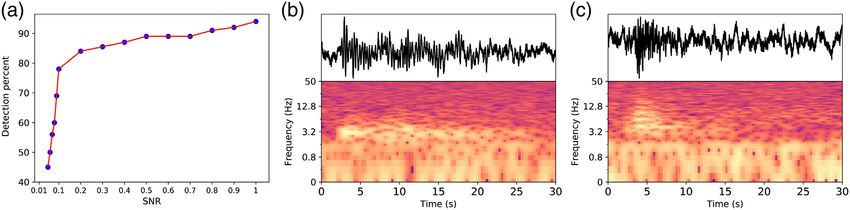
inversion process is done using the Griffin–Lim algorithm                                       Figure 2. Method flowchart. (a) Processing steps of the method
                  (Griffin and Lim, 1984) for converting a complex-valued                                         and (b) illustration of the processing steps with a real data
                  spectrogram to a time series by minimizing the mean squared                                     example. STFT, short-time Fourier transform. The color version of
                                                                                                                  this figure is available only in the electronic edition.
                  error between the complex STFT of the estimated signal and
                  the modified STFT T. Using a part of the phase information
                  sees the Griffin–Lim algorithm converging to a reasonable
                  time-domain signal, whereas it will not if starting with ran-                                   Figure 3b, which is reasonable as both Figure 3b,d are extracted
                  domly selected phases.                                                                          from the HARM spectrogram. However, a significant differ-
                      Figure 3 shows the seismic signal (Fig. 3a, blue) and a com-                                ence compared with the seismic signal is visible in
                  parison of the reconstructed volcanic tremor signal for 1 min of                                Figure 3d in terms of the shape of the signal. Also, the phase
                  seismic waveform from 3 September 2014 using our approach                                       is not reconstructed correctly. Therefore, this signal (Fig. 3d) is
                  (Fig. 3a, green, and 3b) and two other methods (Fig. 3c,d)                                      not applicable for seismological purposes. This shows the
                  described later. As shown in Figure 3b, the reconstructed                                       importance of using appropriate phase information for recon-
                  tremor signal using our method is not noisy and shows almost                                    structing a seismic signal in the time domain.
                  no trace of transient signals. Figure 3c shows the reconstructed                                    We note that a prefiltering of the original seismic data is
                  signal using the inverse STFT, after applying horizontal                                        necessary to remove microseismic signals before applying our
                  median filtering (FitzGerald, 2010) on the STFT spectrogram                                     algorithm. Indeed, microseisms are harmonic signals, which
                  with the goal of separating and extracting the harmonic tremor                                  may have a dominant energy in the tremor spectrogram.
                  signal. In this case, the tremor signal is reconstructed by adding                              Therefore, the amplitude and the phase of the reconstructed
                  the phase of the original seismic waveform to the modified                                      tremor signal could be significantly affected by such micro-
                  STFT. Transient signal energy still exists in the reconstructed                                 seism signals if they are not filtered out beforehand. We
                  harmonic signal, which demonstrates that horizontal median                                      applied a high-pass filter with a cutoff frequency of 0.5 Hz on
                  filtering is not sufficient for extracting a clean tremor signal                                our real dataset.
                  without signs of transient events.
                      In Figure 3d, we show the estimated tremor signal using                                     Transient signal detection and timing estimation
                  the original Griffin–Lim algorithm for phase reconstruction.                                    In a second step, we use the transient spectrogram to locate the
                  The effect of earthquake signals is almost eliminated, as in                                    occurrence of transient signals in time. We do so by integrating

                  6       Seismological Research Letters                                                               www.srl-online.org   •   Volume XX   •   Number XX   •   – 2021

Downloaded from http://pubs.geoscienceworld.org/ssa/srl/article-pdf/doi/10.1785/0220210016/5364359/srl-2021016.1.pdf
by 19407
the spectral amplitudes over the full frequency band at each Figure 3. Comparison of the extracted tremor signal using the
time frame, thus deriving a characteristic function suitable proposed method and two other methods visualized for a short
for detecting transient events. At the time of transient events, time window of data from 3 September 2014 (HHZ component
of FLUR station from network 7Z; White, 2010). (a) The raw
this function has large values compared with zero or very small seismic signal (blue) and the reconstructed tremor signal using
values in other parts of the function. our method (green). (b) Same as the green trace in (a). (c) The
Most observed transient signals in the seismic recordings reconstructed tremor signal using horizontal median filtering.
can be interpreted as seismic-wave arrivals of earthquakes. The traces of transient events still exist in this signal. (d) The
A standard task in observational seismology is then to estimate estimated tremor signal using the Griffin–Lim algorithm for phase
reconstruction. The vertical red line is drawn to illustrate the
arrival times of wave groups from timing the onset of transient
phase alignment of the signals. The color version of this figure is
signals. Proposing the detection of transient signals with the available only in the electronic edition.
characteristic function described earlier, we further aim to
extract an accurate onset time of the transient signals. For
detection, we use a local maximum (peak) search on the tran-
sient characteristic function. Two thresholds are applied to the characteristic function for the prepeak interval time window
characteristic function—the upper threshold and the lower from the largest local maximum found in the characteristic
threshold. The upper threshold is used for transient signal function (Fig. 4).
detection, and the lower threshold is used for accurate onset We used a 5 s prepeak interval time window, because most
timing. The upper threshold prevents picking up minor local of the earthquakes in this study are local, and t S − t P differ-
maxima representing coda waves or other fluctuations in the ence times are less than 5 s. This time window is shown in
earthquake records. This threshold is determined by visually Figure 4. It is recommended to use a larger prepeak interval
analyzing the peak value distribution on some smaller test set time window for regional earthquakes. We shorten this pre-
in the data. The local maxima, which are larger than the peak interval time window preceding each peak using the fol-
threshold, are then considered to represent detected earth- lowing criterion. First, we adjust the lower threshold visually
quakes. The maximum peak of the characteristic function cor- to the level of residual signal energy from the harmonic signal
responds mostly to S-wave arrivals, whereas the P-wave onset component remaining after the separation process. The lower
can be associated with the earliest break in the characteristic threshold is the smallest nonzero number in the characteristic
function. We have, therefore, developed a straightforward function, which does not correspond to the transient signals.
procedure to find the first-arrival onset of the transient events This allows the removal of minimal amount of residual
by considering amplitude and amplitude derivatives of the energy due to the separation process. Using the lower
Volume XX • Number XX • – 2021 • www.srl-online.org Seismological Research Letters 7
Downloaded from http://pubs.geoscienceworld.org/ssa/srl/article-pdf/doi/10.1785/0220210016/5364359/srl-2021016.1.pdf
by 19407threshold improves the accuracy of onset time picking. We set Figure 4. Flowchart for backtracking the peaks to the arrival time.
all values of the characteristic function below the lower The example shows an earthquake time history and its charac-
threshold to zero. Second, we check if there are some neigh- teristic function. The vertical green line in the top left figure
shows the first selected peak, which is sent back in time to the P-
boring zero samples in the time window and change the start-
arrival time step by step. In the top left, the prepeak interval time
ing point of the window to one sample after the last zero window is demonstrated as [start, end). The bracket means
sample to prevent mixing with a very close preceding event. including the start point in the time window, and the parentheses
Indeed, neighboring zero samples means that there is no tran- means excluding the end point from the time window. The
sient signal, and shortening the window avoids confusion uncertainty of the P-arrival time in this example is 0.1 s through
visual inspection. The color version of this figure is available only
with a close preceding event. We skip the samples following
in the electronic edition.
a local maximum within the window, if there are any. Then,
we calculate the slope between each two neighboring samples,
and, we skip the samples following a slope reduction, if there
are any. Finally, the starting point of the transient signal resolution and the frequency resolution. A better frequency
(P-wave arrival) is the point showing the maximum slope resolution requires a longer time window for the spectral
increase (see Fig. 4). analysis (longer FFT length), which implies a reduced temporal
resolution. Similarly, using a shorter FFT window increases the
Parameters selection temporal resolution, whereas the frequency resolution will be
Although the separation process creates a harmonic and per- reduced. For extracting the tremor signal, we need a high res-
cussive spectrogram, the process must be repeated twice with olution in the frequency domain, and, therefore, a large num-
different fast Fourier transform (FFT) window lengths, if both ber of FFT points is chosen. We use an FFT window length of
tremor signals and the timing of the transient events are to be 81.92 s with an overlap of 75%, corresponding to an FFT size of
determined. Because of the uncertainty principle in Fourier 8192 at a sampling frequency of 100 Hz. To detect transient
analysis, it is impossible to increase both the temporal events, a high resolution in the time domain is needed, and
8 Seismological Research Letters www.srl-online.org • Volume XX • Number XX • – 2021
Downloaded from http://pubs.geoscienceworld.org/ssa/srl/article-pdf/doi/10.1785/0220210016/5364359/srl-2021016.1.pdf
by 19407a small number of FFT points and short hop size (number of recordings randomly in time to the resulting time series of
samples between each successive FFT window) are chosen. We synthetic tremor and noise (Fig. S3). Each earthquake signal,
use an FFT size and FFT window length of 1.28 s, with an over- which is used for semisynthetic data creation, is cut from the
lap of 75%. Considering the data’s 100 Hz sampling frequency, beginning of the P wave until the signal amplitudes return to
neighboring FFT windows are spaced in time by an interval of the pre-event noise level after the S- or surface-wave coda part.
0.32 s (3.125 samples per second). Fourier transforms with a We used different types of the earthquakes’ signals, that is, both
narrower FFT size are not recommended for our algorithm LP and volcano-tectonic events within the time period from 15
due to the resulting limited frequency resolution. September to 20 September 2014 show significantly different
There are two sets of median filter procedures used in signal durations. In total, we created 24 hr of semisynthetic
our method. The first one, which is described in the HPS data by combining 500 real earthquake recordings with syn-
Algorithms section, is part of the REPET-SIM algorithm and thetic harmonic waveform and a seismic noise series. More
is depicted in the flowchart of Figure 2a. After identifying the details about the semisynthetic data generation can be found
similar frames and storing them in the array J, the median of J in Figures S1–S3. Figure 5a–c shows the components of the
is taken for each frequency to construct W. semisynthetic signal, and Figure 5d shows the created semisyn-
The second median filter procedure is described in the thetic signal.
Volcanic Tremor Extraction Approach section in which a We applied our method to this semisynthetic dataset. The
second HPS approach is applied using the median filtering synthetic harmonic signals were extracted, and the earthquakes
method of FitzGerald (2010). Both a horizontal median filter were detected via the characteristic function. Figure 5e shows the
and a vertical median filter are applied separately to the spec- semisynthetic signal after subtracting the extracted tremor signal
trograms of R and NR (see the flowchart in Fig. 2a). We use a from it, and we name it the detremored signal. As shown in
standard kernel size of 31 for both the horizontal and vertical Figure 5e, this signal has a larger earthquake SNR, and an
median filters, as it has been shown by Driedger et al. (2014) improvement in the first-motion piking is seen. This is useful
that the choice of this parameter is not critical if not choosing when we need to remove a harmonic noise from the seismic
extreme values. Both R and NR are decomposed into two spec- waveform. Figure 5f,g shows the extracted harmonic signal and
trograms, that is, containing harmonic and percussive signal the earthquake characteristic function as outputs of the method.
components. The harmonic component of the R spectrogram
is the final harmonic spectrogram (HARM, see Fig. 2b). The Testing the tremor extraction algorithm using
percussive component of the NR spectrogram is the final semisynthetic data
spectrogram of the transient components (TRAN, see Fig. 2b). To evaluate the ability of the method for tremor signal extrac-
tion, we use the created semisynthetic data with different SNR
Datasets and Testing of the harmonic signal. To set different SNRs, we normalize
Generation of semisynthetic data each component of the semisynthetic data by dividing it by
We created a synthetic harmonic signal, convolving equally its standard deviation, and then we weight them based on
spaced spikes with a real-valued Morlet wavelet (Fig. S1a, the desired SNR. Our harmonic signal extraction process is
available in the supplemental material to this article). In this performed on the semisynthetic data, and the harmonic signal
way, we can model the basic features of a harmonic spectra is then reconstructed. The cross correlation of the synthetic
(Schlindwein et al., 1995). Instead of using exact constant harmonic signal and the reconstructed harmonic signal using
repetition intervals and a fixed amplitude, which produces a our method is measured (Fig. 6). Cross correlations measure
perfect harmonic tremor signal, we varied the interval times the similarity of two time series, so we calculate them to evalu-
as well as the amplitude of the spikes according to a normally ate how similar the reconstructed harmonic signal is to the
distributed random variable around some mean value with synthetic harmonic signal. If the two time series are identical,
about 10% variance. This results in slightly broadened peaks of the cross-correlation coefficient will be 1, and, if they are com-
the harmonic spectrum and reproduces the variation that we pletely different, the cross-correlation coefficient will be 0. We
observe in seismic records of volcanic tremors (Eibl, Bean, can reconstruct the tremor signal for an SNR of at least 0.4 with
Vogfjörd, et al., 2017; Fig. S1b). After creating the harmonic a cross correlation of more than 0.8. The synthetic harmonic
signal, colored noise resembling Peterson’s low-noise model signal and the reconstructed signal match well in both phase
(LNM, Peterson, 1993) is added to the signal. The colored and shape (see Fig. 5b,f). The differences between these two
noise is synthesized by computing coefficients of a zero-phase signals are usually related to small fluctuations in the input
finite-impulse-response (FIR) filter via inverse FFT from the harmonic signal, which shows a random pattern instead of
spectral representation of the LNM. Then, we apply the FIR a repetitive pattern. The similarity matrix is not able to identify
filter to a random time series of arbitrary length and multiply random patterns, and, therefore, they are not reconstructed in
it with an amplitude factor to adjust the SNR of the tremor the output signal. Figure 6 shows the SNR and related cross
versus colored noise (Fig. S2). Finally, we add real earthquake correlation of input and output harmonic signal.
Volume XX • Number XX • – 2021 • www.srl-online.org Seismological Research Letters 9
Downloaded from http://pubs.geoscienceworld.org/ssa/srl/article-pdf/doi/10.1785/0220210016/5364359/srl-2021016.1.pdf
by 19407Testing the earthquake detection algorithm using Figure 5. Testing the method with semisynthetic data.
semisynthetic data (a) Earthquake signals, (b) synthetic tremor signal, and (c) seismic
To evaluate the capacity of our method for earthquake detection, noise signal are the elements for creating semisynthetic data.
Each of these three signals is normalized by dividing by their
we use the created semisynthetic data with different earthquake
standard deviation. (d) Weighted sum of the data in (a–c), which
SNR. We report the local SNR here, which refers to the ratio is used as an input for our method. The signal-to-noise ratio (SNR)
between the variance of the earthquake signal and the variance of the earthquakes is 0.2, and the harmonic SNR is equal to 2.
of the local related segment of the semisynthetic data. The local (e) The detremored signal derived by subtracting the extracted
related segment is the time window that contains the earthquake tremor signal from the semisynthetic signal. (f) Extracted tremor
signal and (g) transient characteristic function as outputs of our
signal as well as synthetic tremor signals and seismic noise in the
method. The color version of this figure is available only in the
background. The segment has a variable length that corresponds electronic edition.
to the earthquake signal duration. The advantage of the semisyn-
thetic signals is that we can measure and control the individual
components. The results show that for SNR = 0.1, we can detect
more than 78% of the events; however, below SNR = 0.3, there is shows a typical volcano-tectonic event for comparison. That LP
a significant number of false picks (up to 30% of all events), events that are often not detected can be explained by the proper-
whereas the average percentage of false picks is 6% for SNR ties of the detection characteristic function. This function is
between 0.3 and 1. For SNR higher than 0.1, 42% of the missed derived from summing all frequencies in the transient spectro-
events are LP events. The SNR and related detection rates are gram for each time frame. Thus, the characteristic function is
reported in Figure 7a. Some examples of semisynthetic data with sensitive to broadband signals. However, LP events are narrow-
different earthquake SNR and different SNR of harmonic signal band, which results in a poor performance, although the signals
component are presented in Figures S4–S7. are contained in the transient spectrogram. Also, if LPs persist
Most missed events are similar to that shown in Figure 7b, longer, it becomes more difficult to detect them because of the
which are classified as LP events (Woods et al., 2018). Figure 7c basic structure of the method. Indeed, to create the repeating
10 Seismological Research Letters www.srl-online.org • Volume XX • Number XX • – 2021
Downloaded from http://pubs.geoscienceworld.org/ssa/srl/article-pdf/doi/10.1785/0220210016/5364359/srl-2021016.1.pdf
by 19407based on an automatic detection method using Coalescence
Microseismic Mapping (Drew et al., 2013) with the velocity
model used in Ágústsdóttir et al. (2016, their fig. S2c). The bul-
letin earthquakes were relocated (Ágústsdóttir et al., 2019) using
cross-correlated, subsample relative travel times following the
method of Woods et al. (2019). A dense local seismic network
comprising 72 three-component broadband instruments was
used to create the 1 yr bulletin. Our detection process currently
uses only one component of seismic recording from a single sta-
tion. In the future, the result could be improved using three-com-
ponent signals and additional stations, because some of the
smaller events may have larger amplitudes on the other compo-
nents or stations. An event with a larger amplitude shows a larger
peak in the characteristic function, and hence the probability of
Figure 6. Cross correlation of the semisynthetic harmonic signal
and the reconstructed harmonic signal versus the SNR of har- its detection using our algorithm will increase.
monic signal. The color version of this figure is available only in Our method can detect two adjacent earthquakes with a
the electronic edition. minimum interval of around 10 s. This interval is defined
by the number of samples, which must be waited after picking
a peak in the local maximum finder. The interval value
depends on the number of FFT points, the hop size, and the
spectrogram, for all time frames, we derive the corresponding type of earthquake. In our dataset, earthquakes are mostly
frame (in the repeating spectrogram) by taking the median of local, where shorter waiting time values will result in the detec-
the similar frames (which are identified using the similarity tion of more than one peak for one event.
matrix) for each frequency bin. For a transient (short duration Using the algorithm described in the Transient Signal
in time) event, there are a few numbers of similar frames in the Detection and Timing Estimation section, we are able to find
spectrogram, so it is identified as a nonrepeating pattern. P-wave arrival times using the detected peaks via the local
Therefore, it will show a short-lasting sharp peak in the transient maximum finder. The uncertainty in the example shown in
characteristic function. In contrast, for a long-lasting event, Figure 4 is 0.1 s through visual inspection. The pattern of the
there are some adjacent similar frames, which will be replaced characteristic function for different types of events is, however,
in the repeating spectrogram by the median of them. not always similar to the simple shape we have assumed, which
Therefore, it shows some long-lasting, less sharp, adjacent peaks mostly corresponds to the energy shape of a local event and
in the transient characteristic function, which is less likely to be could have more fluctuations; thus, the uncertainty in detecting
detected by the local maximum finder compared with sharper the P arrivals could be higher. We compared the P-arrival-time
peaks. residuals of our method and those given by the bulletin of
Ágústsdóttir et al. (2019) for one month. For 52% of the events,
Real data tests the time difference is less than 1 s, whereas 48% of the events
In a final step, we applied the method to a dataset of the show a time difference of between 1 and 6 s. A significant part
Holuhraun 2014–2015 eruption and extracted volcanic tremor of large time differences is related to LP events, in which the
signals from the seismological records. As discussed in the duration of the event is long compared with volcano-tectonic
Volcanic Tremor Extraction Approach section and showed events in the characteristic function, in which the first arrival is
in Figure 3a,b, the reconstructed tremor signal matches well outside of the prepeak interval time window. In this case, the
with the original seismological records and has no trace of algorithm is able to send the first selected peak back in time to
transient, earthquakes-related signals. This dataset consisted the starting point of the window and shorten the time differ-
of one month (September 2014) of recordings by the FLUR ence; however, the emergent onset of the LP event is still earlier
station, and we use a single vertical component to detect earth- in the time axis. This algorithm (finding P-wave arrival times
quakes. We compared our detected earthquakes with the bul- using the detected peaks) could be improved upon by assigning
letin presented in Ágústsdóttir et al. (2019). For the station different parameters for different event types.
location with respect to the eruption fissures, please see The algorithm that is proposed here is a simple way to
Figure 1 and Woods et al. (2018). About 84% of the total of attribute the peaks to the starting point of changes in the char-
5071 events listed by Ágústsdóttir et al. (2019) were detected by acteristic function. This could be applied in different fields
our proposed approach. when a function has not only rather stable values but also expe-
We detected a total of 12,619 events, which is more than twice riences sudden changes, and finding the first point of the start-
the number of listed events in the bulletin. The bulletin is made ing changes is important. One could develop the algorithm by
Volume XX • Number XX • – 2021 • www.srl-online.org Seismological Research Letters 11
Downloaded from http://pubs.geoscienceworld.org/ssa/srl/article-pdf/doi/10.1785/0220210016/5364359/srl-2021016.1.pdf
by 19407adding more criteria based on the information about the Figure 7. Detection rate of earthquakes in the semisynthetic data as
phenomena that are attributed to the changes to decrease the well as two earthquakes as samples of detected and not-detected
uncertainty in finding the starting point of change. events by our method. (a) Detection rates for semisynthetic data as
a function of the SNR. (b) Seismic waveform and spectrogram of a
not-detected long-period (LP) event on 16 September 2014.
Feasibility of the method with respect to (c) Seismic waveform and spectrogram of a detected volcano-
processing speed tectonic event on 16 September 2014. The color version of this
The average computation time for the tremor extraction of a figure is available only in the electronic edition.
one-day-long record with an FFT window length of 81.9 s, over-
lap of 75%, and a sampling frequency of 100 Hz, is about 70 s,
when implemented in Python using Librosa on a PC with an SNRs of the synthetic harmonic signal above 0.4. In addition,
Intel core i7 (six-core) processor of 2.2 GHz and 16 GB of RAM. more than 78% of earthquake signals in the semisynthetic data
For transient signal detection with an accuracy of 0.32 s, the with SNR = 0.1 can be detected using our method.
computation time is about 34 min with an FFT window length The capability of the method for earthquake detection was
of 1.28 s and an overlap of 75%. The significant difference in the also evaluated in comparison to a real earthquake catalog. The
computation time between the tremor extraction and transient detection of more than twice the number of the Ágústsdóttir
signal detection is due to the different FFT window lengths of the et al. (2019) bulletin events demonstrates the ability of the pro-
two processes. Reducing the FFT length and using the same over- posed method for detecting smaller seismic events, even when
lap of 75% increases the number of FFT windows for the overall only a single station and component is available.
data time range and the associated computation time. The developed method is able to extract harmonic tremor
signals and is applicable to other volcanoes that exhibit such
Conclusions and Outlook phenomena. A possible application of the proposed method
In this work, we have developed a method to extract and recon- is to extract volcanic tremor signals using a network or an array
struct volcanic tremor signals, as well as to detect transient during a period of heightened volcanic activity. In particular,
signals from seismic waveforms. We used a combination of the clean tremor signal can be used for tremor source location
two HPS algorithms from the field of MIR to separate har- using array analysis, given that the tremor signal reconstruction
monic and percussive elements of the seismic waveform in provides the true phase of the signal. This may provide an
the time–frequency domain. This combination leads to a better improved analysis of the spatial and temporal evolution of
separation of the components and results in clean tremor and volcanic tremors during active volcanic periods.
transient spectrograms. The tremor signals are reconstructed Another application of this method is in the field of earth-
in the time domain using weighted phase information of quake analysis research. Here, we suggest using the seismic wave-
the initial seismic complex spectrogram at each time frame form after subtracting the tremor signals (if tremors are
through the energy contribution of the tremor spectrogram. present). We named this signal as the “detremored” signal in the
We showed that it is important to use phase information to Generation of Semisynthetic Data section (see Fig. 5e). The
reconstruct a signal in the time domain for seismological pur- advantage of using the detremored signal is the resulting increase
poses to provide an accurate phase reconstruction. We also dis- in the earthquake SNR and improvements in the first-motion
cussed how to use a weighted phase matrix based on the picking.
dominant frequency band of the tremor spectrogram that can In our opinion, the transient signal detection algorithm
almost eliminate the noise contributions in the phase matrix of introduced in this study is a useful tool for detecting seismic
the seismic waveform. The reliability of the reconstructed sig- events and is especially applicable for detecting small events
nal was shown using semisynthetic tests. The cross correlation during an earthquake swarm. Although we used one compo-
between the synthetic harmonic signal and the reconstructed nent of one station for earthquake detection in this study, the
harmonic signal using our method was higher than 0.8 for results could be improved using three components and
12 Seismological Research Letters www.srl-online.org • Volume XX • Number XX • – 2021
Downloaded from http://pubs.geoscienceworld.org/ssa/srl/article-pdf/doi/10.1785/0220210016/5364359/srl-2021016.1.pdf
by 19407additional station, because some events with low amplitude on Southeast Crater eruption on Mount Etna in early 2000, J.
the current component and station may show larger amplitude Geophys. Res. 108, no. B5, doi: 10.1029/2002JB001866.
on the other components or stations. Cano, E., D. FitzGerald, A. Liutkus, M. D. Plumbley, and F. R. Stöter
In conclusion, the presented method could provide a basis (2018). Musical source separation: An introduction, IEEE
Signal Process. Mag. 36, no. 1, 31–40, doi: 10.1109/
for tremor source investigations as well as research into erup-
MSP.2018.2874719.
tive activity, because it provides simultaneous information
Chouet, B. A. (1996). Long-period volcano seismicity: Its source and
about tremors and earthquakes and allows the extraction of use in eruption forecasting, Nature 380, no. 6572, 309–316.
a clean signal of the tremor for detailed investigations. Davi, R., G. S. O’Brien, L. De Barros, I. Lokmer, C. J. Bean, P. Lesage,
M. M. Mora, and G. J. Soto (2012). Seismic source mechanisms of
Data and Resources tremor recorded on Arenal volcano, Costa Rica, retrieved by wave-
All data used in this article are openly available at Incorporated form inversion, J. Volcanol. Geoth. Res. 213, 1–13, doi: 10.1016/
Research Institutions for Seismology (IRIS; network code 7Z, j.jvolgeores.2011.10.008.
White, 2010). The Python code related to the proposed method is Dmitrieva, K., A. J. Hotovec-Ellis, S. Prejean, and E. M. Dunham
freely available from https://gitup.uni-potsdam.de/zali/harmonic- (2013). Frictional-faulting model for harmonic tremor before
tremor-extraction-and-transient-signal-detection (last accessed Redoubt Volcano eruptions, Nature Geosci. 6, no. 8, 652–656,
March 2021). A Jupyter notebook with all the Python codes and doi: 10.1038/NGEO1879.
parameters related to the proposed method is available as a supple- Drew, J., R. S. White, F. Tilmann, and J. Tarasewicz (2013).
mental material to this article. The supplemental material related to Coalescence microseismic mapping, Geophys. J. Int. 195, no. 3,
this article also contains illustrations of the semisynthetic data gen- 1773–1785, doi: 10.1093/gji/ggt331.
eration. The application of the method using some examples of semi- Driedger, J., M. Müller, and S. Disch (2014). Extending harmonic-
synthetic data with different earthquake signal-to-noise ratios (SNRs) percussive separation of audio signals, ISMIR, 611–616.
and different SNRs of the harmonic signal component are also pre- Eibl, E. P., C. J. Bean, I. Jónsdóttir, A. Höskuldsson, T. Thordarson, D.
sented in the supplemental material. Coppola, and T. R. Walter (2017). Multiple coincident eruptive seismic
tremor sources during the 2014–2015 eruption at Holuhraun, Iceland,
Declaration of Competing Interests J. Geophys. Res. 122, no. 4, 2972–2987, doi: 10.1002/2016JB013892.
Eibl, E. P., C. J. Bean, K. S. Vogfjörd, Y. Ying, I. Lokmer, M. Möllhoff, G. S.
The authors acknowledge that there are no conflicts of interest
O’Brien, and F. Pálsson (2017). Tremor-rich shallow dyke formation
recorded.
followed by silent magma flow at Bárðarbunga in Iceland, Nature
Geosci. 10, no. 4, 299–304, doi: 10.1038/NGEO2906.
Acknowledgments Falsaperla, S., S. Alparone, S. D’Amico, G. Grazia, F. Ferrari, H.
Zahra Zali is grateful for the support by the German Academic Langer, T. Sgroi, and S. Spampinato (2005). Volcanic tremor at
Exchange Service (DAAD) through the Graduate School Scholarship Mt. Etna, Italy, preceding and accompanying the eruption of
Programme under Reference Number 91721165. This work was also July–August, 2001, Pure Appl. Geophys. 162, no. 11, 2111–2132,
supported by the German Research Foundation (DFG MU 2686/13- doi: 10.1007/s00024-005-2710-y.
1, SCHE 280/20-1), and the Daimler Benz Foundation (32-02/18). FitzGerald, D. (2010). Harmonic/percussive separation using median
The dataset is openly available at Incorporated Research Institutions filtering, Proc. of the International Conf. on Digital Audio Effects
for Seismology (IRIS; network code 7Z, White, 2010). The authors (DAFx), Vol. 13, Graz, Austria, 6–10 September 2010.
thank Tom Winder for sharing the P-wave arrival times of the bulletin FitzGerald, D. (2012). Vocal separation using nearest neighbours and
in Ágústsdóttir et al. (2019). The authors thank Diana Roman and an median filtering, 23rd IET Irish Signals and Systems Conf.,
anonymous reviewer for their constructive comments. The authors Maynooth, Ireland, 28–29 June 2012, doi: 10.1049/ic.2012.0225.
thank Kevin Fleming for proofreading this article and for his spelling FitzGerald, D., and M. Gainza (2010). Single channel vocal separation
corrections and editorial improvements. using median filtering and factorisation techniques, ISAST Trans.
Electron. Signal Process. 4, no. 1, 62–73, ISSN: 1797-2329.
References Griffin, D., and J. Lim (1984). Signal estimation from modified short-
Ágústsdóttir, T., T. Winder, J. Woods, R. S. White, T. Greenfield, and time Fourier transform, IEEE Trans. Acoust. Speech Signal Process.
B. Brandsdóttir (2019). Intense seismicity during the 2014–2015 32, no. 2, 236–243, doi: 10.1109/icassp.1983.1172092.
Bárðarbunga-Holuhraun rifting event, Iceland, reveals the nature Gudmundsson, M. T., K. Jónsdóttir, A. Hooper, E. P. Holohan, S. A.
of dike-induced earthquakes and caldera collapse mechanisms, J. Halldórsson, B. G. Ófeigsson, S. Cesca, K. S. Vogfjörd, F.
Geophys. Res. 124, no. 8, 8331–8357, doi: 10.1029/2018JB016010. Sigmundsson, T. Högnadóttir, et al. (2016). Gradual caldera col-
Ágústsdóttir, T., J. Woods, T. Greenfield, R. G. Green, R. S. White, T. lapse at Bárdarbunga volcano, Iceland, regulated by lateral magma
Winder, B. Brandsdóttir, S. Steinthórsson, and H. Soosalu (2016). outflow, Science 353, no. 6296, doi: 10.1126/science.aaf8988.
Strike-slip faulting during the 2014 Bárðarbunga-Holuhraun dike Hellweg, M. (2000). Physical models for the source of Lascar’s har-
intrusion, central Iceland, Geophys. Res. Lett. 43, no. 4, 1495–1503, monic tremor, J. Volcanol. Geoth. Res. 101, nos. 1/2, 183–198,
doi: 10.1002/2015GL067423. doi: 10.1016/S0377-0273(00)00163-3.
Alparone, S., D. Andronico, L. Lodato, and T. Sgroi (2003). Hotovec, A. J., S. G. Prejean, J. E. Vidale, and J. Gomberg (2013).
Relationship between tremor and volcanic activity during the Strongly gliding harmonic tremor during the 2009 eruption of
Volume XX • Number XX • – 2021 • www.srl-online.org Seismological Research Letters 13
Downloaded from http://pubs.geoscienceworld.org/ssa/srl/article-pdf/doi/10.1785/0220210016/5364359/srl-2021016.1.pdf
by 19407You can also read