Visitor Trends Report - Tongariro Conservancy Whanganui - Tongariro Whanganui Taranaki Conservancy
←
→
Page content transcription
If your browser does not render page correctly, please read the page content below
Visitor Trends Report
    Tongariro                          Whanganui       Taranaki
    Conservancy

Prepared by:   Michael Harbrow
               Social Science Advisor (Visitor)
               Partnerships, Historic & Visitor Unit
               Wellington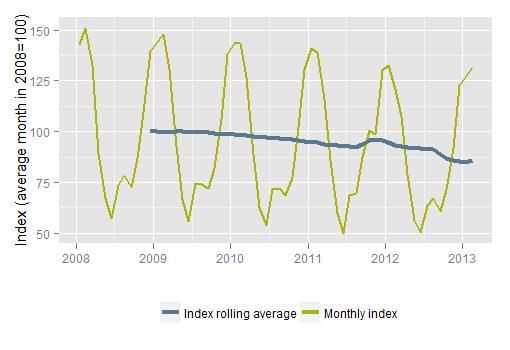
Introduction
This report outlines the key trends affecting recreation and tourism both nationally and in Tongariro
Whanganui Taranaki Conservancy. It has been written for Department of Conservation staff, contractors
and local stakeholders and is intended to provide supplementary information to support the Regional
Tourism Trends and Opportunities report being prepared by Angus & Associates.

Five broad topics with short and long term effects on recreation and tourism are discussed in the report.
These are
    •   International tourism,
    •   Domestic tourism
    •   Visitation to public conservation land in the Tongariro Whanganui Taranaki region
    •   New Zealanders’ participation in outdoor recreation
    •   Demographic change at national and local level.

Each chapter covers the major sources of available information drawing on both publically available data,
such as national tourism datasets, and information held by the Department. Information has been
summarised at the beginning of each chapter.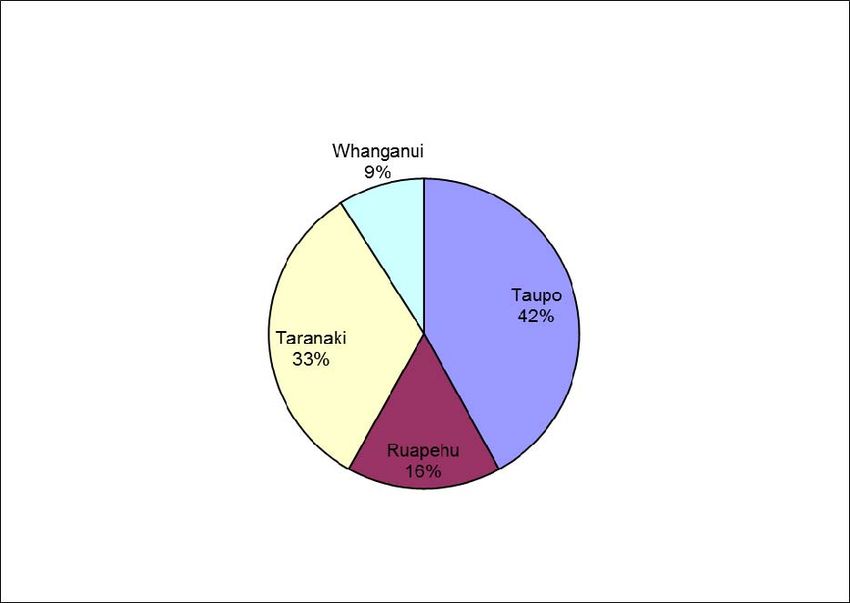
International tourism trends
This section outlines the major sources of information regarding the number and origin of international
visitors to New Zealand. Other aspects including visitors’ spending, length of stay and levels of demand
for park and nature based activities are also discussed.

The available information suggests that international tourism is changing and will continue to do so. The
number of overseas tourists visiting New Zealand is growing but visitors are spending less and taking
shorter trips. The mix of visitors is also changing with increasing numbers of visitors from China and
Australia and a sharp decline in some of New Zealand’s traditional markets including the UK, USA, Japan
and South Korea. This trend is forecast to continue over the next 5 years.

While park and nature based experiences remain popular the changing mix of international visitors
presents challenges for DOC. If the current trends continue there may be static or declining numbers of
international visitors for many areas of public conservation land, particularly those that are distant from
Auckland (and other main entry ports), or from major attractions and travel routes. The various data
sources are discussed in more detail below.

Visitor Arrivals
Growth in international visitor arrivals (Statistics New Zealand 2009, Ministry of Business,
Innovation & Employment 2013c) has slowed after a long period of rapid growth that finished in
2004. There were 2,564,618 international visitor arrivals in 2012 which was 21.8% higher than in 2003
but down slightly (-1.4%) on 2011 (Figure 1).

While the number of international visitor arrivals has increased the mix of visitors has changed
significantly (Figure 2). The key trends are;

    •   The number of arrivals from Australia, New Zealand’s largest market, continues to grow.
        Australian visitor arrivals increased by 27.9% between 2006 and 2012.

    •   The Chinese market has grown by 86.4% over the same period to become New Zealand’s
        second largest source of overseas visitors in 2012. In 2006 China was New Zealand’s 6th
        largest market.

    •   Visitor arrivals from four of New Zealand’s traditional markets have declined sharply. These
        are;

            o    United Kingdom -35.7%
            o    USA -21.3%
            o    Japan -47.2%
            o    South Korea -52.5%

    •   Arrivals from Germany have increased 7.5% since 2006.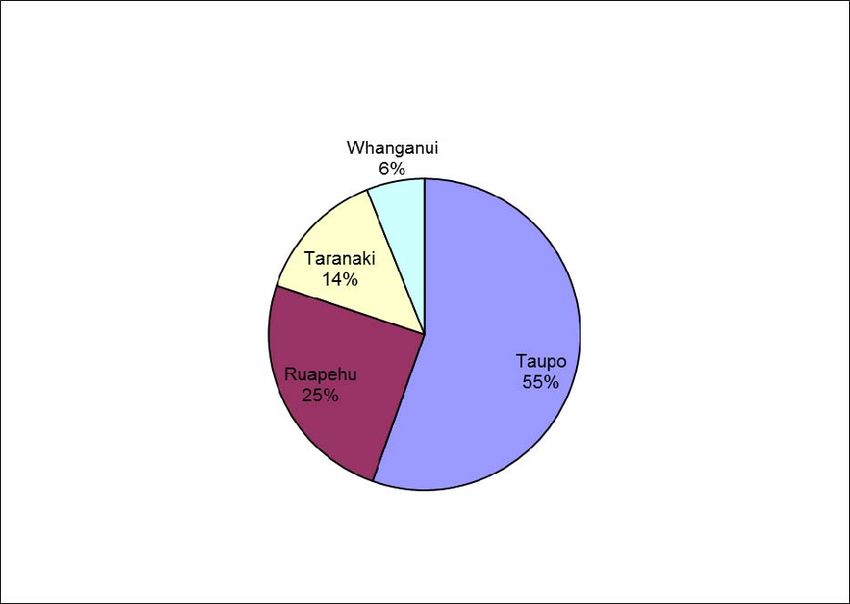
Figure 1: International visitor arrivals 2003 - 2012 (Source: Statistics New Zealand)

Figure 2: Annual visitor arrivals from key markets 2006 – 2012 (Source: Statistics New Zealand)
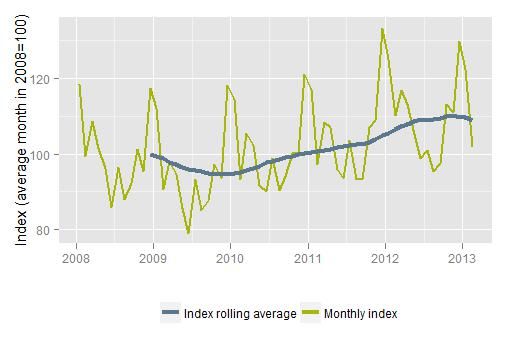
Length of stay
The mean length of stay for overseas visitors to New Zealand in 2012 was 19.1 days. The mean figures
are skewed by long stay visitors (e.g. those on working holidays) however, and the median length of
stay is a more useful indicator. In 2012 the median length of stay for international visitors was only 9
days (Ministry of Business, Innovation & Employment 2013d). Both the median and mean length of
stay in 2012 were 1 day lower than in 2010 (Ministry of Economic Development 2011).

Length of stay for different overseas markets varies widely (Table 1). For example the median length
of stay for Chinese visitors is only four days, while for the United Kingdom it is 20 days (Ministry of
Business, Innovation & Employment 2013d). These differences and the changing mix of visitors are
likely to be behind the reduction in average length of stay. This could be caused, for example, by
there being fewer long stay visitors from the UK, more short stay visitors from China along with a
tendency for Australian visitors to take shorter trips.

A decrease in length of stay means that visitors will tend not to travel as far from Auckland, the main
port of entry, and will be less likely to visit areas away from main attractions and tourist routes.

Table 1: Length of stay for key markets in 2012 (Source: International Visitor Survey)
 Country                         Mean stay (days)                 Median stay (days)
 Australia                       10.5                             7
 China                           16.0                             4
 United Kingdom                  29.9                             20
 United States                   18.4                             10
 Japan                           18.4                             7
 Germany                         50.1                             24
 South Korea                     20.2                             6

Visitor spending
In the year to February 2013, spending by international visitors (Figure 3) was 14% below 2008 levels
(Ministry of Business, Innovation & Employment 2013f). In 2012 the average spend by international
visitors (Table 2) during their trip (excluding international airfares) was $2300 and the median spend
was $1400 (Ministry of Business, Innovation & Employment 2013d).
Figure 3: International tourism spending 2008 – 2013 (Source: Regional Tourism Indicators)

Table 2: Spending in New Zealand for key markets (Source: International Visitor Survey)
 Country                       Average spend                   Median spend
 Australia                     $1500                           $1100
 China                         $3600                           $2000
 United Kingdom                $2700                           $1900
 United States                 $2600                           $1700
 Japan                         $4100                           $2600
 Germany                       $3200                           $2600
 South Korea                   $3100                           $1800

Commercial guest nights
The Commercial Accommodation Monitor (Figure 4) provides another indicator of overall tourism
activity. Despite the increase in the number of visitor arrivals, commercial guest nights from
international visitors declined by 10.8% between 2008 and 2012 (Statistics New Zealand 2013). This
again reflects the shorter stays and changing tourism market.
Figure 4: International commercial guest nights 2008 - 2012 (Source: Commercial Accommodation
         Monitor)

International tourism forecasts
The changes to tourism markets outlined above are forecast to continue in the short to medium term
according to forecasts released in November 2012 (Ministry of Business, Innovation & Employment 2012).
Total visitor numbers are expected to increase by 28% between 2011 and 2018 but the mix of visitors will
be different. It is expected that traditional markets such as the United Kingdom and United States will
continue to decline but this will be offset by strong growth in the Australian and Chinese markets. Visitor
spending is predicted to increase by 9% and return to pre-global financial crisis levels by 2018. The
average spend per day is expected to remain steady at $112 but the average length of stay for overseas
visitors is forecast to decline by 15% to 16.9 days. This is due to a shift in the market in favour of short-haul
trips from Asia and Australia.

Activities undertaken by international visitors
Trends in the activities undertaken by international visitors during their visit (Figure 5 & 6) are captured
in the International Visitor Survey (Ministry of Business, Innovation & Employment 2013a). The key
trends are;

    •    Walking and trekking has remained the third most popular activity for overseas visitors behind
         shopping and dining. In 2012 more than 1.7 million international visitors walked or trekked
         during their stay in New Zealand. Participation in this activity by overseas visitors has increased
         strongly since 2008 but fell in 2012 with the decrease in visitors.

    •    Demand for a number of more passive experiences offered on public conservation land including
         other scenic / natural attractions and lookouts and viewing platforms have also increased.

    •    Land based sightseeing declined sharply between 2006 and 2009. Numbers are growing again
         but are currently 25.9% below their 2005 peak.
• Interest in volcanic / geothermal attractions is static, while the number of overseas visitors who
visited cultural and heritage attractions has declined.
• Interest in cultural attractions has been declining since 2005 while interest in historic attractions
has also begun to decline.
Figure 5: Annual number of international visitors undertaking selected active outdoor recreation
activities (Source: International Visitor Survey)
2000000
1800000
1600000
1400000
1200000
# visitors
Walking And Trekking
1000000
Canoeing, Kayaking,
800000 Rafting
Fishing
600000
Snow Sports
400000
200000
0
1997 1999 2001 2003 2005 2007 2009 2011
YearFigure 6: Annual number of overseas visitors undertaking selected passive recreation activities (Source:
International Visitor Survey)
1600000
1400000
1200000
1000000
Other Scenic/Natural
# visitors
Attractions
800000
Sightseeing (Land)
Volcanic/Geothermal
600000 Attractions
Heritage Attractions
Lookouts And Viewing
400000 Platforms
Cultural Attractions
200000
0
1997 1999 2001 2003 2005 2007 2009 2011
Year
Demand for park and nature based activities by overseas market
Tourism New Zealand’s Visitor Experience Monitor (Tourism New Zealand 2012b-h) tracks participation
and interest in a wide range of park and non park based activities. Analysis of four activities – tramping /
hiking, visits to National Parks, scenic bush walks and scenic drives (Figures 7-10) shows that there are
significant implications for DOC in the changing nature of New Zealand’s overseas tourism markets.
The declining UK and USA markets are ones that have high levels of participation in these four activities.
While growth is occurring in New Zealand’s two largest tourism markets - Australia and China, these are
markets that have lower levels of participation. Over time this will lead to a visitor mix with lower
participation levels than is the case currently. Combined with the trend towards shorter stays in New
Zealand, this could lead to static or decreasing number of international visitors using public conservation
land.
While there are lower levels of participation among Australian and Chinese visitors it does not appear
that this is because they necessarily lack interest in the outdoors. Instead there is significant latent
demand i.e, interest that is not flowing through into actual participation. There is an opportunity to grow
the number of Australian and Chinese visitors using public conservation land if their needs and barriers
to participation are understood and if the right opportunities are provided in the right places.Figure 7: Demand for tramping / hiking by overseas market (Source: Visitor Experience Monitor
2011/12)
100
21
26 15
36
41
45
75
% of visitors
36
50 29
52 62
80
44
40
25
38
35
22
15 17 15
0
Australia China United Kingdom USA Japan Germany South Korea
Country of origin
Interested & participated Interested but did not participate Were not interested
Figure 8: Demand for visits to national parks by overseas market (Source: Visitor Experience
Monitor 2011/12)
100
6 7
12 12 11
22
75 48
37
50
66 63
61
% of visitors
50
77
25 52 51
38
28 30
27
0
Australia China United Kingdom USA Japan Germany South Korea
Country of origin
Interested & participated Interested but did not participate Were not interestedFigure 9: Demand for scenic bush walks by overseas market (Source: Visitor Experience Monitor
2011/12)
100
8
13
16
19
22
31
75
52
50
% of visitors
61
56 48
50
63
65
25
40
34
30
25 26
15
0
Australia China United Kingdom USA Japan Germany South Korea
Country of origin
Interested & participated Interested but did not participate Were not interested
Figure 10: Demand for scenic drives by overseas market (Source: Visitor Experience Monitor 2011/12)
100
8 9 7 9
17
30
75 30
49
53
65
% of visitors
57
36
50
66
61
25
43
38
34
26 28
0
Australia China United Kingdom USA Japan Germany South Korea
Country of origin
Interested & participated Interested but did not participate Were not interestedOne obvious barrier is length of stay. As indicated above, the median length of stay in New Zealand is only 4 days for Chinese visitors and 7 days for Australians. This compares with 20 days for British visitors and 10 days for those from the USA (Ministry of Business, Innovation & Employment 2013d). Investment in opportunities that are easily accessible from Auckland and that offer short, instant immersion experiences in the natural environment are likely to be more successful than some of the traditional opportunities that DOC provides.
Domestic tourism trends
The following section summarises available information on domestic tourism trends. Information is
provided on the percentage of New Zealanders taking holidays within the country along with trends in
spending and commercial guest nights from domestic visitors. The Domestic Travel Survey is used to
show the significance of various outdoor activities to domestic tourism.

The data suggests that commercial guest nights are increasing after a number of years of decline.
However, visitor spend is only marginally above 2008 levels and fewer New Zealanders overall are taking
holidays within New Zealand. The Domestic Travel Survey shows that walking or trekking, land based
sightseeing and other scenic / natural attractions were each included in more than 4.7 million trips in 2011
(Ministry of Business, Innovation & Employment 2013b). Each of these information sources is discussed
in more detail below.

Commercial guest nights
The Commercial Accommodation Monitor (Figure 11) shows that the total number of domestic guest
nights across New Zealand increased slightly from 18,823,409 in 2008 to 19,251,820 in 2012. This was
an increase of 2.3% (Statistics New Zealand 2013).

Figure 11: Domestic guest nights 2008 – 2012 (Source: Commercial Accommodation Monitor)

Spending
According to the Regional Tourism Indicators (RTI), spending by domestic tourists is increasing
after reaching a low point in June 2009 (Figure 12). Spending in the year to January 2013 was 10%
above 2008 levels (MBIE 2013e).
Figure 12: Domestic tourism spending 2008 – 2013 (Source: Regional Tourism Indicators)
Number of trips
The Domestic Travel Survey (DTS) records the number and characteristics of trips undertaken by
New Zealanders. Unlike the International Visitor Survey discussed earlier, long term trend data is not
available as the DTS was revised in September 2009 and new data is not comparable with older data.
Recent data (Table 3) shows an increase in tourism between 2010 and 2011 (Ministry of Business,
Innovation & Employment 2013b).
Table 3: Total number of domestic trips 2010 – 2011 (Source: Domestic Travel Survey)
2010 2011 % change
Total day trips 28,204,988 32,386,682 14.8%
Total overnight trips 15,872,307 17,680,867 11.4%
Total trips 44,077,295 50,067,549 13.6%
Percentage of New Zealanders taking domestic holidays
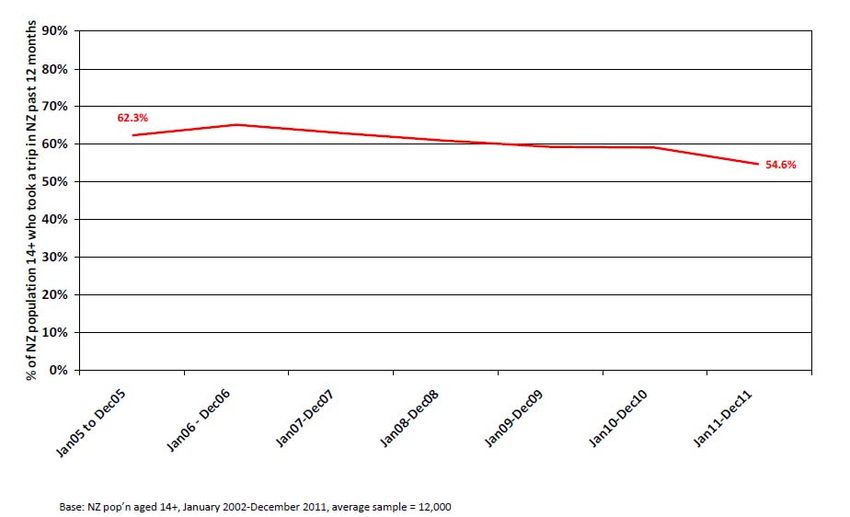
Information on New Zealanders’ domestic tourism behaviour is also available from ongoing surveys
carried out by Roy Morgan Research (Figure 13). This information shows that the percentage of New
Zealanders taking holidays within New Zealand has been declining since 2006 (Roy Morgan Research
2012).Figure 13: Percentage of New Zealanders taking holiday trips in New Zealand 2005 - 2011(Source: Roy
Morgan Single Source Database)
Activities undertaken by domestic visitors
Information on activities undertaken by New Zealanders’ on trips within New Zealand is available from
the Domestic Travel Survey (Ministry of Business, Innovation & Employment 2013a). Walking and
trekking was the most popular activity under taken by New Zealanders. This is supported by other
information sources such as the Active New Zealand and Roy Morgan Surveys which are discussed later
in this report. New Zealanders made more than 4.7 million domestic trips involving walking and trekking
in 2012. Swimming, fishing and sightseeing were also popular activities (Tables 4 & 5).
Table 4: Number of trips by New Zealanders involving selected active recreation activities (Source:
Domestic Travel Survey)
Activity 2010 2011 % change
Walking and trekking 4,751,928 4,739,845 -0.3
Swimming 1,850,169 1,908,711 +3.2
Fishing 1,726,771 1,536,556 -11.0
Hunting/shooting 350,802 470,597 +34.1
Snow sports 315,473 345,992 +9.7Table 5: Number of trips by New Zealanders involving selected passive recreation activities (Source:
Domestic Travel Survey)
Activity 2010 2011 % change
Sightseeing (land) 5,018,337 4,872,718 -2.9
Other scenic/natural
attractions 4,383,647 4,511,105 +2.9
Volcanic/geothermal
attractions 819,931 964,406 +17.6
Lookouts and viewing
platforms 101,748 148,734 +46.2
Heritage attractions 189,086 146,384 -22.6Tourism in the Tongariro Whanganui Taranaki This section of the report discusses tourism activity at the local and regional level. Data from the Commercial Accommodation Monitor shows that New Zealanders are responsible for the majority of tourism activity in Tongariro Whanganui Taranaki. Within the region, domestic tourism is focussed on Taupō and Taranaki while the smaller international market is centred around the Taupō and Ruapehu areas. International and domestic tourism have both declined in the Tongariro Whanganui Taranaki region since 2008, but there are different trends operating in different sub-regions. International tourism has actually increased in Taupō and Taranaki, against the regional and national trend, although spending by international visitors has declined across the region. Commercial guest nights The Tongariro Whanganui Taranaki region is predominantly a domestic holiday destination. In 2012 domestic visitors accounted for 73% of guest nights in the region while 27% were from international visitors (Statistics New Zealand 2013). The Taupō Regional Tourism Organisation (RTO) area received the largest share of domestic guest nights with 42% while one third of domestic guest nights were in Taranaki. The Whanganui RTO area received less than 10% of the region’s domestic guest nights (Figure 14). Figure 14: Share of domestic guest nights by RTO (Source: Commercial Accommodation Monitor 2012)
The Taupō RTO area (55%) received more than half of all international guest nights in the Tongariro
Whanganui Taranaki region in 2012 while a quarter were received by the Ruapehu RTO area. Taranaki is
a much less significant area for international tourism compared to domestic and received only 14% of the
region’s international guest nights. The Whanganui RTO area received only 6% (Figure 15).

Figure 15: Share of international guest nights by RTO (Source: Commercial Accommodation Monitor
           2012)

The four Regional Tourism Organisation areas within Tongariro Whanganui Taranaki Conservancy
together received 2,054,151 guest nights in 2012. This represented approximately 6% of New Zealand’s
total guest nights (Statistics New Zealand 2013). Information on the percentage of overseas tourists
visiting the region shows a slightly higher level of activity. According to the Visitor Experience Monitor
(Tourism New Zealand 2012a), 9% of international tourists visited the Taranaki area in 2011/12 while 14%
visited the combined Manawatu – Whanganui area. The percentage who visited the Taupō and Ruapehu
areas was not clear as these were combined into other regions.

Total commercial guest nights in the region were down 3.3% on 2008 (Figure 16 & 17) and on the
surface this appears to closely reflect the national trend over the same period (-3.2%). Analysis by
market (domestic or international) and at the individual RTO level shows a more complex picture
(Statistics New Zealand 2013). Overall the region has been relatively insulated from the decrease in
international tourism experienced nationally but, in contrast to the national trend, domestic tourism
has declined. The key changes were;

    •   Domestic guest nights have decreased by 4.3% in the Tongariro Whanganui Taranaki region
        despite a small increase nationally. This was largely driven by a 9.3% decrease in the Taupō
        RTO area.

    •   International guest nights increased by 6.1% in Taupō and 5.6% in Taranaki.
• A 12% decrease in international guest nights in the Ruapehu RTO was largely offset by
increased domestic guest nights.
• Guest nights in Whanganui fell by 14.1% with large decreases in both the international and
domestic markets.
Further information at the individual RTO level is provided in Figures 18 – 21.Figure 16: Annual guest nights for Taupō, Taranaki, Ruapehu and Whanganui RTOs 2008 - 2012
(Source: Commercial Accommodation Monitor)
Figure 17: Percentage change in annual guest nights 2008 - 2012
(Source: Commercial Accommodation Monitor)Figure 18: Taupō RTO annual guest nights 2008 - 2012 (Source: Commercial Accommodation Monitor)
1000000
800000
# Guest nights
600000
400000
200000
0
2008 2009 2010 2011 2012
Year
Domestic International Total
Figure 19: Taranaki RTO annual guest nights 2008 - 2012 (Source: Commercial Accommodation
Monitor)
1000000
800000
# Guest nights
600000
400000
200000
0
2008 2009 2010 2011 2012
Year
Domestic International TotalFigure 20: Ruapehu RTO annual guest nights 2008 – 2012 (Source: Commercial Accommodation
Monitor)
1000000
800000
# Guest nights
600000
400000
200000
0
2008 2009 2010 2011 2012
Year
Domestic International Total
Figure 21: Whanganui RTO annual guest nights 2008 - 2012 (Source: Commercial Accommodation
Monitor)
1000000
800000
# Guest nights
600000
400000
200000
0
2008 2009 2010 2011 2012
Year
Domestic International Total
Country of origin and spending by international visitors
Official tourism statistics no longer include information on the number of overseas tourists visiting
particular areas of New Zealand. Instead the Regional Tourism Indicator collects information on the
number and value of electronic transactions. These are analysed by country to indicate size of the
international market in each region (Table 6 & &). The Regional Tourism Indicator data shows that;• Australia is the largest international market in all four RTO areas. Spending by Australian
visitors has increased in all RTO areas in the region since 2008.
• Tourism in the Tongariro Whanganui Taranaki region is vulnerable to the decline in numbers
from the UK and USA being experienced nationally.
o Spending by UK visitors decreased in all four RTO areas by between 22% and 41%.
o Spending by American visitors has dropped sharply in Taupō (-30%) and Whanganui (-
22%). However, there were small increases in spending both Ruapehu and Taranaki.
• Spending by Chinese visitors has increased substantially in two RTO regions but the overall
level of activity from this market is still very small. Other markets including Canada and a
number of European countries are currently larger markets for the Tongariro Whanganui
Taranaki region.
• Overall spending by international tourists since 2008 is down 16% in Taupō, down 15% in
Whanganui and down 6% in the Ruapehu.. Spending increased by 6% in Taranaki.
Table 6: Percentage of international tourist transactions from key markets by RTO 2012 (Source:
Regional Tourism Indicators)
Australia China UK USA Japan Germany South Total
Korea transactions
Taupō 32.1% 0.7% 17.6% 12.6% 1.2% 7.3% 0.4% 219,443
Ruapehu 26.7% 0.4% 14.4% 11.6% 0.8% 11.9% 0.4% 52,601
Taranaki 45.8% 0.4% 14.4% 10.2% 0.7% 5.0% 0.2% 112,254
Whanganui 42.9% 1.0% 15.0% 9.6% 1.0% 7.9% 0.3% 32,282
Table 7: Change in average monthly visitor spend from key markets by RTO between 2008 & 2012
(Source: Regional Tourism Indicators)
Australia China UK USA Japan Germany South Overall
Korea change
Taupō +15% +176% -43% -30% +4% -12% -7% -16%
Ruapehu +4% No -37% +1% -33% -4% -36% -6%
data
Taranaki +32% +60% -22% +6% +52% -7% No data +6%
Whanganui +31% No -41% -22% -65% -31% No data -15%
dataUse of public conservation land in Tongariro
Whanganui Taranaki Conservancy
The Department of Conservation manages a number of significant visitor sites in the Tongariro
Whanganui Taranaki region. Limited visitor count data is available from the Department’s booking
system and network of visitor counters. However there is little long term data available. This data is
discussed by area below.
Taupō
The Department manages a large number of popular sites in the Taupō area including Huka Falls, walks
along the Waikato and Tongariro Rivers, the Tokaanu Thermal Walk and the Tongariro National Trout
Centre. It also manages the Taupō fishery which is a significant driver of tourism in the area.
Long term monitoring data is only available for the Taupō Fishery and two of the region’s tracks - the
Lake Rotopounamu and Round the Mountain Tracks. Counting has recently been established at a
number of other locations however. Because of the limited amount of data it is not possible to assess the
long term trends in use of public conservation land in the area or to compare this with official tourism
statistics. The available data is summarised below.
• The track between Spa Road and Huka Falls is the busiest monitored site in the Taupō area. It
received more than 25,000 visitors in 2012. This was down 10.5% on the previous year.
• Three other tracks in the vicinity of Taupō are monitored.
o The Kawakawa Bay Track was enjoyed by 6896 visitors in 2012 (up 24.6%). More than
three quarters of visitors on this track were riding bikes.
o A single year of data for the Rangatira Point shows that 3090 people visited in 2012.
o 18,732 hits were recorded on the W2K counter in 2012, an increase of 27.6%. This track is
managed by Bike Taupō and more than 80% of visitors to the track are bikers.
• Total Taupō fishing licence sales decreased from 54,086 to 41,363 (-23.5%), between the 2007/08
and 2011/12 seasons continuing a general downward trend in licence sales over the past 24 years,
since sales peaked at over 82,000 in the 1987/88 season.
• Numbers on the Lake Rotopounamu Track, near Turangi, peaked in 2010 but overall increased
13.4% between 2008 and 2012. The annual number of visitors rose from 9067 to 10279 (Figure 22).
• More than 20,000 hits were recorded on the Tongariro River Walkway track counter. There was
an increase of 0.9% between 2011 and 2012.• Counters are also installed on two tracks in the Kaimanawa Forest Park.
o Hits on the Tree Trunk Gorge Track counter increased from 2471 to 2522 (+2.1%)
o Hits on the Umukarikari Track increased 11.4% from 1273 to 1418.
• Use of the Round the Mountain tramping track has declined by 21% since 2008 (Figure 23).
Figure 22: Annual visitor numbers: Lake Rotopounamu Loop Track
14000
12231
12000
11244
10695
10279
10000
9067
8000
# Visitors
6000
4000
2000
0
2008 2009 2010 2011 2012
YearFigure 23: Annual counter activity: Round the Mountain Track
1400
1239
1200
1008 1022
1000 979
932
Counter activity
800
600
400
200
0
2008 2009 2010 2011 2012
Year
Taranaki
DOC manages a number of sites accessed from road ends on Mt Taranaki. Popular sites include Stratford
Plateau, North and East Egmont, Dawson Falls and Lucys Gully. DOC also manages a number of lower
profile sites in the wider Taranaki Area. Long term trend data for sites in Taranaki does not show an
overall trend across the area. The data is as follows:
• North Egmont Visitor Centre is the most popular monitored site in Taranaki. It received 72,481
visitors in 2012 which was up from 69,260 in 2011 (+4.7%). In contrast the number of visitors on the
North Egmont Nature Walk dropped 12.2% between 2008 and 2011 from 7784 to 6838 (Figure 24).
Other tracks at the North Egmont Road End are not monitored.
• There is also significant visitor use at Dawson Falls on the South Eastern side of Mt Taranaki
(Figure 25).
o The Kapuni Loop Track received 35,459 visitors in 2012 which was a decrease of 16.1%
from the previous year.
o 37,993 visitors used the Dawson Falls Visitor Centre. This was up 3.6% on the number of
visitors in 2010.
o The Ridge Loop Track was monitored between 2006 and 2011. Use of the track declined
by 24.6% over this period from 3722 down to 2805 visitors.• Use of the Manganui Gorge Track on the eastern side Mt Taranaki has trended downward in
recent seasons but there was a sharp increase in 2011/12. Numbers in 2011/12 were 5.2% above
2006/07 levels. The wheelchair accessible Potaema Track is also monitored but caters for fewer
than 1000 visitors annually (Figure 26).
• Four other visitor counters are located around Mt Taranaki. Two tramping tracks on the western
side of Mt Taranaki (the Ihaia and Oanui Tracks) both receive fewer than 600 visitors per year.
Use of the Pouakai Circuit, in the north, is unclear as visitor flows are more complex. Activity on
one section - the Ahukawakawa Track increased 24% between 2009 and 2012. A smaller increase
of 6.1% was recorded on the Henry Peak – Kaiauai Track between 2008 and 2011 (Figure 27).
• Counters are also installed at three other sites in the wider Taranaki area.
o Visitor activity at the Ratapihipihi Scenic Reserve Track (Figure 28) has declined
sharply. There were 4404 hits on the visitor counter in 2012 compared to 6612 in 2009 (-
33.4%).
o A single year of activity data is available for the Whitecliffs Walkway for 2011/12. 1403
hits were recorded on the counter.
o Two years of visitor counts are available for the Arahake Bush Loop Walk. Visitor
numbers declined from 1490 in 2010 to 1203 in 2011. A drop of 19.3%.Figure 24:Annual visitor numbers: North Egmont Visitor Centre & Nature Walk
80000
72481
69260
70000
60000
50000
# visitors
40000
30000
20000
10000 7784 6838
5130 5801
0
2008 2009 2010 2011
Year
North Egmont Nature Walk North Egmont Visitor Centre
Figure 25: Annual visitor numbers: Dawson Falls Visitor Centre, Kapuni and Ridge Loop Tracks
45000
42285
40000
37993
36671 36419
35459
35000
30000
25000
# Visitors
20000
15000
10000
5000 3722 4223
2483 2805
2125
0
2006 2007 2008 2009 2010 2011 2012
Year
Dawson Falls Visitor Centre Kapuni Loop Track Ridge Loop TrackFigure 26: Annual visitor numbers: Manganui Gorge & Potaema Tracks
8000
7000 6688
6000 5745
5462
5027
5000
# Visitors
4000
3000 2834
2000
1000 854 763 846
0
2007/08 2008/09 2009/10 2010/11 2011/12
Season
Manganui Gorge Track Potaema Track
Figure 27: Annual counter activity: Pouakai Circuit
2500
2327
2288
2000
1857
1497
1500
1312
1244
1172
1004
1000
500
0
2008 2009 2010 2011 2012
Ahukawakawa Track Henry Peak - Kaiauau TrackFigure 28: Annual counter activity: Ratapihipihi Scenic Reserve Track
8000
7007
7000 6816
6612
6000
5000
Counter activity
4404
4000
3000
2000
1000
0
2009 2010 2011 2012
Year
Ruapehu
Popular DOC sites in the Ruapehu area include the Tongariro Alpine Crossing, Tongariro Northern
Circuit, the Whakapapa Visitor Centre, local walks around Whakapapa Village and the Ohakune Old
Coach Road. Visitor numbers at three sites around the Central Plateau (Taranaki Falls, Tongariro Alpine
Crossing and Tongariro Northern Circuit) peaked in 2010 but have shown an upward trend over the last
5-6 years. This contrasts with a relatively static tourism trend for the Ruapehu area overall. Numbers at the
Whakapapa Visitor Centre followed the downward trend in international tourism in the region. Trends
for specific sites are as follows:
• The number of visitors using the Whakapapa Visitor Centre declined 17.5% between 2002 and
2010 (Figure 29).
• Use of the Tongariro Alpine Crossing peaked in 2010 (Figure 30). Usage is estimated at 70-
80,000 visitors per year but the track counters only approximate the scale of use. This is because
some visitors do short return trips from either end of the track and cross the appropriate counter
twice. Prior to the recent eruption most visitors carried on to the Ketatahi Road End and crossed
both counters only once.
• Use of the Tongariro Northern Circuit Great Walk (Figure 31) has increased 14.1% from 4950 in
the 2006/07 season to 5649 in 2011/12. This increase was driven by a 46.2% increase in domestic
visitors. International use declined by 3.9% over this period. Use of the track has dropped slightly
from its peak of 5882 visitors in the 2010/11 season.• The number of visitors using the Taranaki Falls Track, near Whakapapa Village, peaked at 46,630
in 2010 but dropped to 39520 in 2012. This is still 13.8% above 2006 levels (Figure 32). A single
year of data is also available for the Tama Lakes Track. It received 7489 visitors in 2012.
• Use of the Ohakune Old Coach Road increased 13.9% from 12991 in 2010/11 to 14803 in 2011/12.
Figure 29: Annual visitor numbers: Whakapapa Visitor Centre
300000
252317
250000
237330 236392
227307
221071 220172
212654
206316
201949
200000
# Visitors
150000
100000
50000
0
2002 2003 2004 2005 2006 2007 2008 2009 2010
Year
Figure 30: Annual counter activity: Tongariro Alpine Crossing
100000
91380
90000
83589
79985 80046
80000 77354
75132 73889
70000 68064
59678 59993
60000 57811
Counter activity
55686
50000
40000
30000
20000
10000
0
2007 2008 2009 2010 2011 2012
Year
Mangatepopo KetetahiFigure 31: Annual visitor numbers: Tongariro Northern Circuit
7000
6000 5882
5580 5649
5185
5060
4950
5000
4000
# Visitors
3289 3348 3335
3168 3225
3043
3000
2547 2606
2232
1960
2000 1782 1771
1000
0
2006/07 2007/08 2008/09 2009/10 2010/11 2011/12
Season
Total International Domestic
Figure 32: Annual visitor numbers: Taranaki Falls Track
50000
46630
45000
41929
39520
40000
34728 34829
35000
32900
30000
Year
25000
20000
15000
10000
5000
0
2006 2007 2008 2009 2010 2011 2012
# visitors
Whanganui
There are only a handful of popular DOC managed sites in the Whanganui area and the available data for
these sites is very limited. While tourism has declined significantly in Whanganui, use of two high profilesites – the Whanganui River Journey and the Bridge to Nowhere Walk, has not followed this trend (Figure
33). These sites are accessed from Ohakune and domestic tourism has actually grown in this part of the
region. Trends for specific sites are as follows:
• The number of visitors on the Whanganui River Journey (a canoe trip within the Department’s
Great Walk brand) increased 25% between 2006/07 and 2011/12. It now receives approximately
5500 visitors. Over this period the number of New Zealanders doing the trip increased by 43.5%
while international visitors decreased 1.7%.
• Use of the Bridge to Nowhere Walk increased only slightly (1%) between the 2009/10 and 2011/12
seasons. It received 14,190 visits in 2011/12.
• Activity at Gordon Park Scenic Reserve, near Whanganui dropped 8.3% between the 2009/10 and
2010/11 seasons. 5438 hits on the counter were recorded in 2010/11.
• A newly established visitor counter on the Mangapurua Track recorded 1983 hits on the counter
in 2012 but complex visitor flows make it difficult to convert this into an estimated visitor count.
Three other locations in the Whanganui area (Atene Viewpoint Walk, Te Maire Loop Track and
an additional site at Mangapurua) have track counters but they each receive fewer than 1000
visitors per year.
Figure 33: Annual visitor numbers: Bridge to Nowhere & Whanganui River Journey
16000
14051 14085 14190
14000
12000
10000
# visitors
8000
6000 5507
4407
4034
4000
2000
0
2006/07 2007/08 2008/09 2009/10 2010/11 2011/12
Season
Bridge to Nowhere Walk Whanganui River JourneyTrends in New Zealanders’ use of the outdoors This section examines trends in New Zealanders’ participation in various outdoor recreation activities. Available information shows that walking is the most popular activity for New Zealanders both on and off public conservation land. However there is no information on whether its popularity is increasing or decreasing. In contrast, interest in tramping and hunting appears to be on the rise while participation in freshwater fishing is static or declining. There is no long term data that supports the popular perception that mountain biking is increasing in popularity. Information at regional levels is relatively limited and in some cases contradictory. However residents of Tongariro Whanganui Taranaki are more likely to visit public conservation land than New Zealanders as a whole. The available data on participation in outdoor recreation is summarised below. Data sources There are two main sources of trend information for outdoor recreation activities at national level; the Active New Zealand Survey (Sport NZ 2013) and the Roy Morgan Single Source Database (Roy Morgan Research 2012). The Roy Morgan Single Source Database (referred to as the Roy Morgan Survey) is likely to be the more reliable of the two data sources due to its scale (approximately 12,000 surveys per year), consistency of method, frequency and the fact that it is more up to date (it covers the period from 2002- 2011). On the other hand it may under estimate participation levels as the available data only tracks the number of people who define themselves as “regular” participants. The Active New Zealand Survey was conducted by Sport and Recreation New Zealand (now Sport NZ). It was last conducted in 2007/08 and will run for the fifth time in 2013. Unlike the Roy Morgan Survey, Active New Zealand counts a respondent as a participant if they engaged in an activity at least once in a 12 month period. This results in higher participation levels in the Active New Zealand Survey compared to the Roy Morgan. Higher participation levels may also occur because the methodology of using face to face interviews in people’s homes is more conducive to gathering detailed information on participation than the self completion surveys used by Roy Morgan. Data from previous Active New Zealand surveys was summarised in an earlier internal DOC report (Rundle 2009) and this report highlighted some deficiencies with the trend data (which Sport NZ do not themselves publish). The specific issues identified were that definitions of different activities have not been consistent across the four iterations of the survey. Also the surveys have not used consistent age categories. The 1997, 1999 and 2001 surveys captured respondents aged 18 years and over, while the most recent interviewed those aged 16 years and over. Two other surveys also provide useful data. The Domestic Travel Survey provides information about attractions visited and the activities undertaken by New Zealanders while on holiday. Data from the DTS is only available for two full years (2010 and 2011) and activities undertaken within 40 km of a respondent’s home (i.e. local recreation) are generally excluded. This data has already been summarised in an earlier section of this report.
The National Survey of New Zealanders, now in its second year, provides an indication of the popularity
of various recreation activities on public conservation land. It asks respondents to indicate the main
activity undertaken on their most recent visit to a DOC managed area. There a number of other surveys
providing information relevant to specific activities such as camping, hunting and fishing. These reports
are introduced alongside the discussion of individual activities below.

The strengths and weaknesses of both surveys should be considered when using the information
reported below. Other data sources used include DOC’s national survey of New Zealanders (Premium
Research 2012), the Domestic Travel Survey and a number of surveys that are relevant to single activities.

Participation levels and trends
A short summary is provided below on New Zealanders participation in six of the most common outdoor
recreation activities that take place on public conservation land. These are walking, tramping, mountain
biking, camping, freshwater fishing and hunting.

Walking
Walking is the most popular sport and recreation activity undertaken by New Zealanders. Estimates on
the scale of walking as a recreational activity vary;

    •   In the 2007/08 Active New Zealand Survey 64.1% of New Zealanders were found to have walked
        for recreation at least once in the preceding 12 months (Sport and Recreation New Zealand
        2009a).

    •   Walking and trekking was the most common active pursuit undertaken by New Zealanders on
        trips within New Zealand (Ministry of Business, Innovation & Employment 2013a). It was
        undertaken on more than 4.7 million trips in 2011.

    •   Walking is by far the most significant recreational activity undertaken by New Zealanders on
        public conservation land. Of the 56% of New Zealanders who had visited a DOC managed area in
        2011 /12, 35% had undertaken a walk of less than three hours and 10% had undertaken a day walk
        on their most recent visit. Both the percentage who were walking (+6%) and the overall
        percentage of New Zealanders visiting areas managed by the Department (+5%), increased
        significantly compared to the previous year (Premium Research 2012).

Trend data on walking is very limited. It is unknown whether the number of people walking for recreation
is increasing or decreasing in the long term.

Participation in walking is high across most groups in society. However some differences are evident.

    •   The Active New Zealand Survey found that men (52.6%), adults aged 16-24 (42.6%) and Māori
        (56.6) were less likely to have walked for recreation than other demographics (Sport and
        Recreation New Zealand 2009d).
• The 2012 National Survey of New Zealanders found that women were significantly more likely
than men to have undertaken a short walk (< 3 hours) on their most recent visit to public
conservation land (Colmar Brunton Research unpublished data).
Tramping
The Department of Conservation provides a significant number of facilities for trampers across New
Zealand however understanding participation levels and trends for tramping is difficult. This arises
because
• The term “tramping” can mean different things to different people.
• The Active New Zealand (tramping) and Roy Morgan (bush walking / tramping) both use single
categories that could contain both day and overnight activities.
• There is disagreement between the two main data sources on whether adult participation in
tramping is increasing or decreasing (Figure 34).
Estimates of participation in tramping vary.
• Data from Roy Morgan Research indicates that the number of New Zealanders who are regular
participants in tramping and bushwalking has increased from 126,000 (4.2%) in 2002 to 179,000
(5.1%) in 2011 (Roy Morgan Research unpublished data). This suggests the number of trampers
has increased by 42% over this period.
• The Active New Zealand survey estimated that approximately 306,000 (5.1%) New Zealanders
participated in tramping (Sport and Recreation New Zealand 2009a).
• In the 2011/12 National Survey of New Zealanders 3% of visitors to public conservation land had
undertaken an overnight or multi day tramp on their most recent visit (Premium Research 2012).
This percentage was unchanged from the previous year.Figure 34: Adult participation in tramping (Source: Sport and Recreation New Zealand & Roy Morgan
Single Source Database)
14
13 13
12
11
10
% of New Zealanders participating
9.4
8
6
5.1
4.2
4
2
0
1996 1998 2000 2002 2004 2006 2008 2010 2012
Year
Roy Morgan Active New Zealand
There is more agreement between the surveys on the demographic characteristics of trampers. They
suggest that more than 60% of trampers are aged 35 and over and that there are more male than female
trampers (Sport and Recreation New Zealand 2009c, Roy Morgan Research 2011).
Concerns that tramping does not appeal to younger age groups appear to be unfounded.
• The Roy Morgan Survey shows a recent trend of increased participation in tramping among New
Zealanders aged 18-24. It is estimated that there were only 9,000 regular trampers in this age
group in 2002 but this rose sharply to 29,000 in 2011 (Roy Morgan Research unpublished data).
• The Active New Zealand survey estimated that there were 58,000 trampers in the 16-24 age
group. Their participation rate of 9.4% was only slightly below the 10.7% participation found in the
25-49 age group (Sport and Recreation New Zealand 2009c).
• The National Survey of New Zealanders also found much higher levels of participation in
tramping among 18-24 year olds compared to the overall population (Colmar Brunton Research
unpublished data).
Mountain biking
Mountain biking covers a diverse range of biking activities and, like tramping, there are issues with
definitions. In particular people using easier off road cycle trails, such as the Otago Central Rail Trail, may
not self-identify as mountain bikers in surveys. They may also not fall into other categories that are used,
(such as road cycling in the Active New Zealand Survey). This means that the importance of cycling or
mountain biking as an activity could be under estimated or that data will not adequately track changes in
participation.Estimates of participation in mountain biking are as follows:
• The 2007/08 Active New Zealand Survey estimated that 6.1% of New Zealanders (202,000 people)
had participated in mountain biking (Sport and Recreation New Zealand 2009a).
• The Roy Morgan Survey found that 2.5% of New Zealanders (or 89,000 people) were regular
mountain bikers in 2011 (Roy Morgan Research 2011 and unpublished data).
• In 2011/12 two percent of visitors to public conservation land indicated that mountain biking was
the main activity on their most recent visit (Premium Research 2012).
Despite a widely held perception that the number of mountain bikers is increasing there is no long term
data that supports this.
• Participation levels in the Active New Zealand survey have stayed at around 6% since the first
survey in 1997 (Rundle 2009).
• Data has only been collected on mountain biking by Roy Morgan Research from 2009 onwards. It
is estimated however, that the number of regular mountain bikers has increased 7% since 2008
(Roy Morgan Research unpublished data).
Like tramping there is agreement between the two surveys on the demographics of mountain bikers. Men
make up approximately three quarters of New Zealand mountain bikers and the largest age group (38 –
41% of participants) is those aged 35-49 (Sport and Recreation New Zealand 2009b, Roy Morgan Research
2011).
Camping
Participation figures for camping are not available from either the Roy Morgan or Active New Zealand
Surveys. However a survey undertaken by Mobius Research in 2006 found that 37% of New Zealanders
were regular campers and 43% were non-campers (i.e. didn’t camp and weren’t interested). A further 20% of
New Zealanders were described as latent campers. These were made up of two groups; those who were
not regular campers but who had a continuing interest in camping, or those who had never camped but
were interested in camping in the future (Mobius Research 2006). The high number of latent campers
indicates that there is considerable scope to grow the number of campers. Unfortunately there is no data
to indicate whether the number of New Zealanders who are camping is increasing or decreasing.
Information on the scale of camping on public conservation land varies. According to the National
Survey of New Zealanders, out of the 56% of New Zealanders who visited public conservation land in
2011/12, 5% had gone camping on their most recent visit (Premium Research 2012). However, this statistic
probably reflects the timing of the survey which was carried out in May and June. When respondents in
the same survey were asked specifically about the DOC facilities they had used in the past three years,
20% said that they had stayed at a basic DOC campsite, 16% at a standard DOC campsite and 9% at a
serviced DOC campsite.Mobius Research (2006) found that there were few demographic attributes that were characteristic of
regular campers. Instead they suggested that camping was an activity enjoyed by a wide cross section of
New Zealanders – male and female, mixed ages and across a range of incomes.
Freshwater fishing
Freshwater fishing is a significant recreational activity carried out on public conservation land. While
Fish & Game manage most freshwater fishing in the country, marginal strips and other areas of public
conservation land are important for river and lake access. The Department of Conservation also directly
manages the Taupō Fishery.
The Fish & Game National Angler Survey (Unwin 2009) is an additional source of participation data
alongside the Roy Morgan and Active New Zealand surveys and the National Survey of New Zealanders.
The surveys show that participation in freshwater fishing is static or declining.
• The National Angler Survey estimated that New Zealand resident anglers had spent 1.156 million
angler-days within Fish & Game managed fisheries in 1994/95. This declined to 1.111 million
angler days in 2001/02 and increased to 1.202 million angler days in 2007/08. The total number of
angler-days increased by only 4% over a period of 13 years (Unwin 2009).
• The Roy Morgan survey estimated that the number of New Zealanders who were regular
freshwater fishers decreased 9% between 2002 and 2011 from 67,000 to 63,000 (Roy Morgan
Research unpublished data). This was a decline in participation rate from 2.2% to 1.8% of New
Zealanders (Roy Morgan Research 2012).
• The Active New Zealand Survey estimated that 5.7% of New Zealanders participated in
freshwater fishing in 2007/08 (Sport and Recreation New Zealand 2009a).
• In 2011/12 2.5% of visitors to DOC managed areas indicated that they had been fishing on their
most recent visit (Colmar Brunton Research unpublished data).
Freshwater fishing is a male dominated activity. 72% of New Zealanders who participated regularly in 2011
were male and 28% were female. 46% were aged 50 years and over.
Hunting
Hunting appears to be one of only two major outdoor activities that is growing strongly.
• According to the Roy Morgan Survey the number of regular hunters increased 32.6% between
2002 and 2011 from 46,000 to 61,000 New Zealanders (Roy Morgan Research unpublished data).
Participation was estimated to have increased from 1.5% to 1.7% of New Zealanders (Roy Morgan
Research 2012).• The Active New Zealand Survey estimated that 4.6% of New Zealanders were hunters in 2007/08
(Sport and Recreation New Zealand 2009a).
• According to the Domestic Travel Survey, hunting and shooting was included in 470,000
domestic trips in 2011. This was a 34.1% increase from the previous year (Ministry of Business,
Innovation & Employment 2013a).
The overwhelming majority of hunters (93.8%) are male while there is a relatively even distribution across
age categories (Roy Morgan Research 2012).
How does participation in outdoor recreation in the Central North
Island differ from the rest of New Zealand?
Overall participation
Residents of Tongariro Whanganui Taranaki Conservancy are significantly more likely to visit areas
managed by the Department of Conservation than New Zealanders overall. In 2011/12 62.5% of
conservancy residents had visited at least one DOC managed area in the previous 12 months. The figure
for New Zealand overall was only 56%. This was also the highest level of participation for any North
Island Conservancy (Colmar Brunton Research unpublished data).
Participation in selected recreational activities
While overall participation in outdoor recreation among local residents is high, assessing demand for
individual activities at regional level is difficult. There are several reasons for this:
1. DOC and RTO boundaries do not correspond to the regions used in either the Active New
Zealand Survey or the Roy Morgan Surveys.
2. There is no trend data available at regional level only one-off snapshots of participation.
3. Only the ten most popular activities in each region are listed in the Active New Zealand Survey
4. Mountain biking and freshwater fishing are not listed as a separate activities at regional level in
the Active New Zealand Survey and are instead combined with other categories.
5. Information on participation levels for tramping from the two surveys is contradictory.
The graphs below show participation data from the Roy Morgan Survey for four activities: bush walking /
tramping, hunting (including game shooting), mountain biking and freshwater fishing. Data is provided
for five North Island regions along with data for New Zealand as a whole. The information may indicate
where in the region new opportunities are more likely to be successful and can be summarised as follows.
• Tramping participation is high in the Waikato, Hawkes Bay and Taranaki (Figure 35).• Hunting participation is high in the Bay of Plenty and Manawatu – Whanganui areas and is very
low in Hawkes Bay (Figure 36).
• Participation in mountain biking is high in the Waikato, Bay of Plenty and Taranaki areas.
Participation levels in the Manawatu-Whanganui region are the lowest in the country (Figure 37).
• Freshwater fishing is most popular in the Waikato, Bay of Plenty and Manawatu- Whanganui
regions and is low in Taranaki (Figure 38).
Figure 35: Participation in tramping by region (Source: Roy Morgan Single Source Database 2011)
9
8 7.7
7
6.6 6.6
% of population who are regular trampers
6
5.1
4.9
5
4.4
4
3
2
1
0
New Zealand Waikato Bay of Plenty Hawkes Bay Taranaki Manawatu - WhanganuiFigure 36: Participation in hunting by region (Source: Roy Morgan Single Source Database 2011)
4.5
4 3.9
3.5
% of population who are regular hunters
3
3
2.5
2.2
2
1.7
1.5
1.5
1
0.5
0.5
0
New Zealand Waikato Bay of Plenty Hawkes Bay Taranaki Manawatu - Whanganui
Figure 37: Participation in mountain biking by region (Source: Roy Morgan Single Source Database
2011)
3.5
3.2
3
3
% of population who are regular mountain bikers
2.5
2.5
2.2
2
1.5 1.4
1 0.9
0.5
0
New Zealand Waikato Bay of Plenty Hawkes Bay Taranaki Manawatu - WhanganuiFigure 38: Participation in freshwater fishing by region (Source: Roy Morgan Single Source Database
2011)
3
2.7
2.5
% of population who are regular freshwater fishers
2.1 2.1
2
1.8
1.5 1.4
1
0.5 0.4
0
New Zealand Waikato Bay of Plenty Hawkes Bay Taranaki Manawatu - Whanganui
In contrast the 2007/08 Active New Zealand survey noted higher levels of participation in tramping for
most central North Island regions compared to the national figure of 9.4%.
• Bay of Plenty 10.7%
• Taranaki 10.6%
• Manawatu 11.8%
• Whanganui 11.9%
Participation was lower in Hawkes Bay at 8.2% and levels for the Waikato were not stated.
The data for tramping for both Hawkes Bay and the Bay of Plenty contradicts the information from the
Roy Morgan Survey. This is likely due to a number of factors including different regional boundaries, a
high margin of error for the Active New Zealand Survey at regional level, and the fact that the snapshots
were taken approximately three years apart.Demographic Trends The final section of this report looks at national, regional and local demographic trends in New Zealand. Three key trends are likely to significantly affect demand for outdoor recreation activities in the medium to longer term nationally. These are population growth or decline in certain areas, an aging population and increasing ethnic diversity. The Department and partners will need to be mindful of these trends when planning investment for new developments and significant upgrades to existing facilities. These trends are outlined below. National trends Population growth New Zealand’s population is increasing and is expected to reach 5.2 million people by 2031. The fastest growing areas nationally will be Auckland, Hamilton City, Waikato District and Tauranga in the North Island and the Selwyn, Waimakariri and Queenstown Lakes Districts in the South Island (Figure 39 & 40). It is expected that 60% of New Zealand’s population growth will occur in Auckland and by 2031 the region’s population will be almost 2 million. In contrast, a static or even declining population is expected in many rural areas in the central and lower North Island (Statistics New Zealand 2012a). Population changes are likely to affect domestic tourism flows and there may also be implications for where the Department and others choose to invest in recreation opportunities for local users. Many facilities have a long economic life, which may be several decades for huts and other major structures. Future use levels should therefore be an important consideration in choosing where to invest in building or upgrading facilities for visitors.
You can also read