Vehicle-to-Grid and/or Vehicle-to-Home round-trip efficiency - A practical case study
←
→
Page content transcription
If your browser does not render page correctly, please read the page content below

Vehicle-to-Grid and/or Vehicle-to-Home
round-trip efficiency
                       A practical case study

                       VIDEGAIN BARRANCO, P.
                       COVRIG, C.F.

                       2021

                                                EUR 30603 EN
This publication is a Technical report by the Joint Research Centre (JRC), the European Commission’s science and knowledge service. It
aims to provide evidence-based scientific support to the European policymaking process. The scientific output expressed does not imply a
policy position of the European Commission. Neither the European Commission nor any person acting on behalf of the Commission is
responsible for the use that might be made of this publication. For information on the methodology and quality underlying the data used
in this publication for which the source is neither Eurostat nor other Commission services, users should contact the referenced source. The
designations employed and the presentation of material on the maps do not imply the expression of any opinion whatsoever on the part
of the European Union concerning the legal status of any country, territory, city or area or of its authorities, or concerning the delimitation
of its frontiers or boundaries.

Contact information
Name: Catalin Felix COVRIG
Address: European Commission, Joint Research Centre, Westerduinweg 3, 1755 ZG - Petten, The Netherlands
Email: catalin-felix.covrig@ec.europa.eu
Tel.: +31.224.565196

EU Science Hub
https://ec.europa.eu/jrc

JRC123942

EUR 30603 EN

   PDF          ISBN 978-92-76-30608-5                ISSN 1831-9424             doi:10.2760/997207

Luxembourg: Publications Office of the European Union, 2021

© European Union, 2021

The reuse policy of the European Commission is implemented by the Commission Decision 2011/833/EU of 12 December 2011 on the
reuse of Commission documents (OJ L 330, 14.12.2011, p. 39). Except otherwise noted, the reuse of this document is authorised under
the Creative Commons Attribution 4.0 International (CC BY 4.0) licence (https://creativecommons.org/licenses/by/4.0/). This means that
reuse is allowed provided appropriate credit is given and any changes are indicated. For any use or reproduction of photos or other
material that is not owned by the EU, permission must be sought directly from the copyright holders.

All content © European Union/ 2021, except: Figure 5 [12] and Figure 6 [12]

How to cite this report:,
Videgain Barranco, P., Covrig, C.F. , Case study: Vehicle-to-Grid and/or Vehicle-to-Home round-trip efficiency, EUR 30603 EN, Luxembourg:
Publications Office of the European Union, 2021, ISBN 978-92-76-30608-5, doi:10.2760/997207, JRC123942

Contents

Abstract .......................................................................................................................................................................................................................................................................... 2
1 Smart Grid Interoperability Laboratory ............................................................................................................................................................................................. 3
2 Introduction ......................................................................................................................................................................................................................................................... 5
3 Equipment technical characteristics ................................................................................................................................................................................................... 6
        3.1          Technical limits and tests ............................................................................................................................................................................................................ 8
4 Experimental methodology and set up ..........................................................................................................................................................................................10
        4.1          Measurement of the EV battery parameters ................................................................................................................................................................10
                 4.1.1                 The Control Area Network (CAN) ........................................................................................................................................................................11
                 4.1.2                 The Nissan Leaf CAN bus........................................................................................................................................................................................11
                 4.1.3                 Access to the CAN bus ..............................................................................................................................................................................................12
5 Results .................................................................................................................................................................................................................................................................14
6 Conclusions ......................................................................................................................................................................................................................................................19
References .................................................................................................................................................................................................................................................................20
List of abbreviations and definitions ........................................................................................................................................................................................................21
List of figures ..........................................................................................................................................................................................................................................................22
List of tables ............................................................................................................................................................................................................................................................23
Annexes .......................................................................................................................................................................................................................................................................24
        Annex 1. Data retrieval code ...............................................................................................................................................................................................................24

                                                                                                                                          i
Authors
VIDEGAIN BARRANCO, P.
COVRIG, C.F.

                        1
Abstract
The battery of an electrical vehicle (EV) can be used to support the power grid (V2G, Vehicle-to-Grid) or can act
as a buffer for a home promoting self-consumption (V2H, Vehicle-to-Home). This technical report evaluates, in
laboratory conditions and for different charging/discharging power levels, the round-trip efficiency of an EV and
V2G/V2H charger setup. The round-trip efficiency of the setup was determined to be ca. 80% for the studied
charging/discharging power levels. The tests were performed in the Smart Grid Interoperability Laboratory,
located in the Joint Research Centre (JRC) site in Petten, Netherlands.

                                                       2
1    Smart Grid Interoperability Laboratory
The Smart Grid Interoperability Laboratory [1] is located in the Joint Research Centre (JRC) site in Petten,
Netherlands. The scope of this testing facility is the interoperability of smart grid systems, and along with other
JRC facilities aims to contribute to policymaking and industrial innovation towards the modernization of the
electricity grid. In summary, Interoperability is the ability of an equipment to be integrated in a system and
exchange meaningful information, understand the exchanged information and comply with the system rules
maintaining the quality of service. It is a fundamental element for the Smart Grid where a key challenge is
integration affecting components, information, systems and implementations.
In specific, the goal of the laboratory is to assess different technological implementations of smart systems,
mainly in a home environment, according to relevant standards and processes, by means of commonly agreed
use cases and applicable reference architectures. The technical activities include the verification of
interoperability among home appliances and grid components, the benchmarking of different solutions, and the
identification of gaps and challenges. A large portion of the work is performed in collaboration with industry
and research institutions.

                                      Figure 1. Smart Grid Interoperability Lab

                                                  Source: JRC, 2021.

                                 Figure 2. Smart Grid Interoperability Lab facilities

                                                  Source: JRC, 2021.

There are many stakeholders who can potentially benefit from the SGIL either directly by being involved in the
work activities, or indirectly by the contribution of the outcomes to better policymaking and research and
innovation. Manufacturers of smart appliances will benefit from a less fragmented market that opens up global

                                                          3
market opportunities and reduces production cost due to economy of scales. Promotion of open standards,
through identification of gaps or misalignments and recommendations for further global harmonization, is also
beneficial both for manufacturers and for consumers, who will have more choices for products without
restriction by closed proprietary ecosystems. Through the dissemination of testing results, the public will have
access to reliable information on interoperable energy-related products and services. Thus, the consumers will
be more certain for the plug-and-play functionality of digital energy solutions and the role that these can have
in increasing energy efficiency and allowing participation in the energy market. Last but not least, the grid
operators could also harvest the benefits from the outcomes of smart grid interoperability testing, e.g. to better
integrate distributed energy resources, or explore new opportunities for business models and services.

                                                        4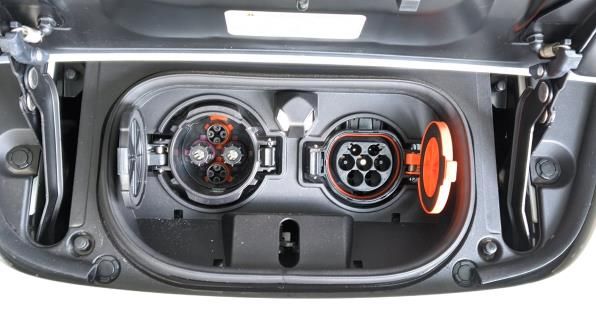
2    Introduction
Nowadays, the demanding environmental challenges call for greener and more efficient power systems.
Alongside, we are facing a change of architecture in power systems as we move from the previously centralized
design towards a decentralized architecture where boundaries between consumers and producers become
diffuse. As until recently electric energy could not be easily stored, electric power companies matched demand
and supply in a regional or national level by either increasing or decreasing production rate of their power plants
or importing power from other electric utilities. Since there are limits on what can be accomplished on the supply
side, bearing in mind that generating units can take a long time to produce full power and demand can at times
exceed the available supply, demand response aims to better match the demand for power in a more efficient
way and in different levels [2].
Furthermore, as the share of wind and solar energy in the electricity mix grows two issues need to be addressed:
lack of availability when required and during sunny days and/or in windy conditions, there is often a lack of
storage capacity for the energy generated - resulting in curtailment.
Integrating distributed energy resources in buildings and houses is a way to move towards this direction as they
produce cleaner energy while at the same time reducing energy losses due to electricity transport. Moreover,
the expansion of the electric vehicle as an active part of smart grids and buildings is a reality that is not only a
major step into a more sustainable mobility but a game changing actor in smart buildings [3][2]. The EVs can
be used as mobile energy storage system (buffers) - the capacity of the installed batteries can be the equivalent
of the consumption of an average household needs over a week.
An EV’s battery can be used to support the power grid (V2G, Vehicle-to-Grid) or can act as a buffer for a home
promoting self-consumption (V2H, Vehicle-to-Home). Homes who generate solar/wind power can store it locally
in their car and retrieve it when required, without stressing the power grid. V2G describes a system in which
plug-in electric vehicles, such as battery electric vehicles, plug-in hybrids or hydrogen fuel cell electric vehicles,
communicate with the power grid to sell demand response services by either returning electricity to the grid or
by throttling their charging/discharging rate [4]. V2G and V2H are considered helpful tools in improving the
robustness of the electric grid, for example mitigating the effects of the intermittent nature of renewable
energy. However, the successful implementation of these techniques faces a number of challenges. Since these
are emerging technologies, there is no standardized communication protocols, which affects interoperability.
Additionally, V2G/V2H requires inverting the DC power back to AC inevitably incurs some losses and it is unclear
how those losses would affect a large-scale V2G/V2H system. Furthermore, a successful implementation of
V2G/V2H technology would require a model to manage the energy stored in the EVs according to the preferences
of the owners as well as the needs of the electric grid.
This technical report evaluates, in laboratory conditions and for different charging/discharging power levels, the
round-trip efficiency of an EV and V2G/V2H charger setup.

                                    Figure 3. Example of a V2G/V2H arrangement

                                                   Source: JRC, 2021

Previous studies on the efficiency of V2G systems are available, such as [5]. This report complements on the
results [5] found in by following a methodology with key differences, such as performing the tests at multiple
charging/discharging power levels and measuring the power flow in two different points (grid level, battery
level).

                                                          5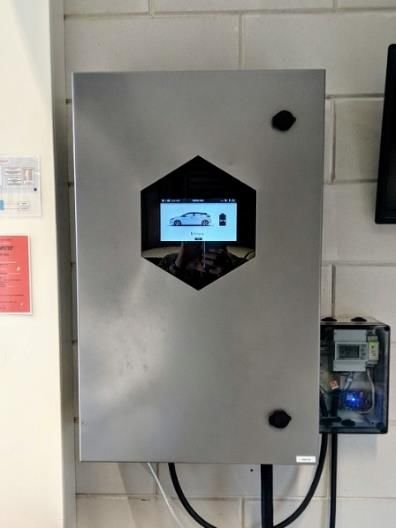
3    Equipment technical characteristics
The Smart Grid Interoperability Laboratory is equipped with an EV (Nissan Leaf ZE1) and a bidirectional 3-phase
10 kW CHAdeMO [6] charger (AME, Nissan partner).
The Nissan Leaf ZE1 (second generation) has a 40 kWh battery pack (under normal conditions – can be affected
by temperature or C/E-rate [7]) with an electric motor that produces 110 kW (148 hp) of power. It charges
through either a 6.6 kW regular plug (Type 2 connector in EU countries or SAE J1772 in US/Japan) or a 50 kW
CHAdeMO plug, and has the ability to send power back to the grid [8]. It has a range of ca. 220 km with an
efficiency of ca. 164 Wh/km (Vehicle Fuel Equivalent ca. 1.8 l/100km) [9].
The battery uses a 96s2p cell configuration (48 modules), having in total 192 cells in the battery pack. The
battery has a nominal voltage of ca. 360 V (with a usable range of 240V-400V) and a weight of ca. 300 kg
[10]. The individual cell parameters are presented in the table below.
                         Table 1 EV battery electrical specifications (manufacturer manual)

                    Rated capacity (IEC 62660-1 [11])                        53.6 Ah
                    Nominal voltage (IEC 62660-1)                            3.65 V
                    Energy density                                   460 Wh/l or 224 Wh/kg
                    Dimensions                                           261x216x7.91mm
                                              Source: Nissan, 2018 [10].

                                          Figure 4. Battery location [12]

                                             Source: Nissan, PushEVs [12].

                                             Figure 5. Battery details

                                                Source: Nissan, 2018..

                                                          6
The EV battery pack supplies power to the following components: traction motor inverter, traction motor, DC/DC
converter (car auxiliaries), electric air conditioner compressor. The DC/DC converter reduces the voltage of the
battery pack to provide power to the 12V battery in order to operate the vehicle’s electric auxiliary components
(e.g. headlights, audio, heater, etc.).

                                          Figure 6. High voltage system [10]

                                               Source: Nissan, 2018 [10].

The EV allows discharging via the CHAdeMO port at a capacity limited by the charger. All the communications
to the charger are done via the Open Charge Point protocol (OCPP 1.6) [13] – reading data, controlling power
set points.
For this experiment the only parameter that is being changed on the charger for the diverse tests is the power
set point. The electrical parameters are measured before the charger via a different meter (Camille Bauer
Sineax AM3000 [14]) than the one included in the charging station.
                    Table 2 Bidirectional charger electrical specifications (manufacturer manual)

                    Supply voltage                                      3-phase 400VAC
                    Efficiency, typical                                      95 %
                    Maximum DC output power                                  10 kW
                    Maximum DC output voltage                                450 V
                    Maximum DC output current                                  28 A
                    Communication protocol                                  OCPP 1.6
                    Class of protection                           Class 1 with PE connection
                                               Source: AME, Nissan, 2018.

                                 Figure 7. Bidirectional charger and EV connectors

                                                   Source: JRC, 2021.

                                                           7
3.1 Technical limits and tests
The table below present the standard charging power levels for the Nissan Leaf (some modes of charging might
not be widely available in certain countries). Furthermore, the bidirectional charger offers the possibility of
limiting the power to any value between -10 kW (discharge) and 6.6 kW (charge).
Table 3 Power charging levels [10]
Standard 3.6 kW On-Board Charger Type 2 (Mennekes - IEC 62196)
Wall Plug (2.3 kW) 230V / 1x10A / 2.3 kW
1-phase 16A (3.7 kW) 230V / 1x16A / 3.6 kW
1-phase 32A (7.4 kW) 230V / 1x16A / 3.6 kW
3-phase 16A (11 kW) 230V / 1x16A / 3.6 kW
3-phase 32A (22 kW) 230V / 1x16A / 3.6 kW
Optional 6.6kW On-Board Charger Type 2 (Mennekes - IEC 62196)
Wall Plug (2.3 kW) 230V / 1x10A / 2.3 kW
1-phase 16A (3.7 kW) 230V / 1x16A / 3.7 kW
1-phase 32A (7.4 kW) 230V / 1x29A / 6.6 kW
3-phase 16A (11 kW) 230V / 1x16A / 3.7 kW
3-phase 32A (22 kW) 230V / 1x29A / 6.6 kW
CHAdeMO
CHAdeMO (50 kW DC) 46 kW
Source: Nissan, 2018 [8].
In order to study the energy losses associated to V2G/V2H, a set of efficiency tests are performed. In this tests
the EV battery is first completely charged and then discharged. By using the set up presented in the following
sections it is possible to determine what fraction of the energy used to initially charge the EV is recovered at
the discharge time.
Figure 8. Electric vehicle and Vehicle-to-Grid/Home (V2G/V2H) charger
Source: JRC, 2021.
Based on the limits of the bidirectional charger and the standard power charging levels mentioned in the table
(directly linked to the electrical grid connection standards) above a total of 7 tests have been performed:
Charge 2.3 kW
Discharge 2.3 kW
8 Charge 3.7 kW
Discharge 3.7 kW
Charge 6.6 kW (limit charger)
Discharge 6.6 kW
Discharge 10 kW (limit charger)
Each test was performed twice in order to validate the acquired data.
In terms of the E-rate [7], the chosen power levels do not exceed 10kW/40kW=0.25E. The E-rate is defined as
the ratio between the power being used to charge (discharge) the battery and the power that would charge
(discharge) the battery in an hour. The E-rate is used because it is independent of the battery capacity, any
battery charging at 1E would require 1 hour to charge completely, at 2E it would require half an hour, and so
on.
For all tests, both the vehicle and the charger were located indoors at a constant temperature of ca. 20°C.
Between each charging/discharging cycle the vehicle and charger were allowed to return to room temperature
indifferent of the required time. The charger will not bring the EV below 10 % state of charge (battery
protection).
94 Experimental methodology and set up
While in an ideal system it would be possible to store a certain amount of energy and then recover it completely,
in real systems every component causes energy losses. In the case of V2G/V2H, the charger and the battery
are responsible for most of these losses. By performing efficiency tests it is possible to determine how much
energy is lost. The methodology followed to perform such tests is presented in this section.
The experimental setup consists of a V2G/V2H arrangement as the one shown in Figure 4. The electric vehicle
is first charged completely, and then discharged 1 while measuring the energy used by the charger and the EV
battery. During the charge cycle, the energy consumed by the charger is compared with the energy stored in
the battery. This is then compared with the energy that can be recovered during the discharge cycle and finally
with the energy that is released to the grid by the charger.
In order to obtain the energy consumed by each component during one cycle, a set of measurements is taken
at the charger and at the EV battery during the charge and discharge. The charger is equipped with a collection
of meters that retrieve the power being consumed or released (charge or discharge), the electric current and
voltage, and the SOC of the EV battery 2. The power consumption of the EV battery is obtained by using the
internal meters it is equipped with. These meters report the voltage and current of the whole battery as well as
the voltage of each of the 96 cell pairs. Additionally the EV battery is equipped with 3 thermal sensors which
are used to study the temperature changes during the tests. A diagram showing the measuring points is shown
in Figure 9. Considering the long duration of the experiments a fast measurement acquisition frequency is not
critical in obtaining accurate results. The setup was set to send a value of each of the variables every 10
seconds, which was considered adequate to perform the tests.
Figure 9. Measuring points for the experimental setup
Source: JRC, 2021.
4.1 Measurement of the EV battery parameters
The values before the EV shown in Figure 9 are obtained using the On Board Diagnostics (OBD) system of the
EV. OBD systems are present in almost every automobile. They are used to retrieve information about the
vehicle components, such as fuel indicators, temperature sensors, airbag systems, etc. The Nissan Leaf used in
this work has a female OBD II port located under the steering wheel. A diagram of the connector is shown on
Figure 10. It can support up to 16 connection pins, out of which 7 are in used in the Nissan Leaf. Of this 7 pins,
pins 6 and 14 are used to retrieve the battery information and pins 4 and 16 to power the device performing
the measurements.
Figure 10. Diagram of the OBD II connector of the Nissan Leaf
Source: JRC, 2021.
1 The Nissan Leaf used in these tests has a safety system that prevents the battery from being discharged below 10%, so the charging
tests go from 10% to 100% and the discharge tests from 100% to 10%.
2 The charger is aware of the EV battery SOC, since this is necessary to control the charging and discharging process, e.g., when the
charge is completed, when the battery is empty and thus the discharge shall stop, etc.
104.1.1 The Control Area Network (CAN)
As mentioned, pins 6 and 14 of the ODB II connector (Figure 10) are used to obtain the necessary values from
the EV battery. This is done through the Control Area Network (CAN) bus, which is the network standard that
allows the internal subsystems of the vehicle to exchange information. The physical layer is formed by two
twisted wires named CAN LOW and CAN HIGH (they can be seen on Figure 10). By changing the voltage
difference between the two cables, the vehicle components can share information with each other. A diagram
of the physical layer of the CAN bus is shown on Figure 11. It is important notice that the CAN standard is a
broadcast based network, this is, every node sends information to all other nodes, instead of aiming the
messages at one specific node.
Figure 11. Physical layer of the CAN bus
Source: JRC, 2021.
The information is sent over the CAN bus in package-like entities called frames. The main type of CAN frame
are the dataframes, which, as the name indicates, carry some type of data. However, other types of frames are
defined on the CAN bus specification, such as error frames, which is used to handle network issues.
A CAN dataframe has 4 main fields:
— The arbitration field, which acts as a header and is used to indicate the urgency of the message. Due to
the limited bandwidth, it is important to establish a system to determine which node has priority when two
or more are contending for the bus. This field contains an identifier that can be 11-bit (CAN 2.0A) or 29-bit
long (CAN 2.0B) depending on the CAN version. The Nissan Leaf operates with CAN 2.0A or standard CAN,
and thus the identifiers are 11-bit long.
— The data field, which can contain between 0 and 8 bytes, in the case of the Nissan Leaf, the data field is
always 8-byte long.
— A checksum used to verify the integrity of the dataframe.
— An acknowledgment bit which is set when any node receives the dataframe.
4.1.2 The Nissan Leaf CAN bus
The way in which the Nissan Leaf components communicate over the CAN bus has changed considerably over
the years. On previous models dataframes were constantly broadcasted over the network, on the ZE1 model
used in this work, however, a request needs to be sent before the Nissan Leaf subsystems broadcast any
information. Because of these significant changes together with the lack of documentation on the specific
identifiers and messages used by the Nissan Leaf, it was necessary to research how to access the battery
information. Based on the work of [22] and [23] it was possible to retrieve the values for the battery current
and voltage, the voltage of each of the 96 cell pairs, and the reads of the battery temperature of three different
sensors. Even though these works are based on previous Nissan Leaf models, some of the techniques presented
were successfully tested on the ZE1 model.
The magnitudes used to study the V2G/V2H efficiency of the Nissan Leaf are the battery current, voltage and
temperature and the 96 cell-pair voltages. In order for the corresponding sensor to send the values over the
CAN bus, first a request needs to be sent. This request is a CAN dataframe with the identifier 0X79B whose
datafield depends on the magnitude being requested. According to [23], the battery magnitudes are divided into
11groups. Group 1 contains the battery voltage and current, group 2 contains the voltage of each cell pair and
group 4 contains the battery temperatures. The request datafield (to be sent to the vehicle) corresponding to
each group has the following structure3:
0x02, 0x21, 0xGP, 0xFF, 0xFF, 0xFF, 0xFF, 0xFF
where GP is the number of the group being requested. After sending the request, a response dataframe with
the identifier 0x7BB is received. The data field of such dataframe has the following structure:
0x10 0xGS 0x61 0xGP 0xDT 0xDT 0xDT 0xDT
where GS indicates the size of the group, GP is the group number and DT are bytes containing actual battery
data. Because the CAN bus is limited to 8-bytes datafields, the data of each group has to be split across multiple
dataframes. To retrieve the next dataframe of the group after the initial response the following dataframe is
sent, again with the identifier 0X79B:
0x30, 0x01, 0x00, 0xFF, 0xFF, 0xFF, 0xFF, 0xFF
The corresponding sensors then answers with an additional dataframe corresponding to the initial group. This
process can be repeated until the whole group is delivered. The dataframes of each group that are received
beyond the first one contain 1 byte that acts as an index, increasing on each additional dataframe and 7 bytes
of actual data. Table 4 shows the data contained in each group and the number of CAN dataframes required to
send the whole group.
Table 4 Data groups used by the Nissan Leaf CAN bus.
Group number Data it contains Number of dataframes
1 Battery voltage and current 6
2 Individual cell pair voltages 28
4 3 battery temperatures 5
Source: MyNissanLeaf.com, 2021 [23].
4.1.3 Access to the CAN bus
A ESP8266 [15] microcontroller (others can also be used) is managing and coordinating the appropriate CAN
bus dataframes. The microcontroller is connected to a MCP2515 [16] CAN bus interface which allows it to use
the CAN standard. An optional LCD screen is also connected to the microcontroller to display debugging
information throughout the different tests, such as the time the test has been running for and the number of
CAN requests sent. The whole system is powered using the 12V pin available at the OBD II port (Figure 10).
Since the ESP8266 and the MCP2515 require 5V to operate, a voltage regulator is used to reduce the voltage.
Finally a power switch is also included. A diagram of the electronic components used can be seen on Figure 12.
The ESP8266 microcontroller is programmed using the Arduino IDE [17]. In order to control the MCP2515 CAN
interface, the [25] library is used. The system is configured to regularly send requests for the battery variables
required for the efficiency tests in the following order:
— First the cell pair voltage values are requested. There are 96 cell pairs and thus 96 voltage values. The
values are sent in mV using 2 bytes for each value. The initial response, received after sending the request
for information about group 2 contains 4 bytes of data, which correspond to the first 2 voltage values.
After this dataframe is received, a request for additional data is sent and the response is recorded. This is
repeated until the the 28 dataframes containing the cell pair voltages are received. Since the additional
3 For convenience the CAN dataframes are presented in hexadecimal.
12data frames contain 7 bytes of data, and 2 bytes are required to send a voltage value, a value of every 4
has to be split over two dataframes. If the 96 values are successfully retrieved, they are sent to a database
via WiFi, where they are stored.
— Next the battery temperatures are obtained. A request for group-4 data is sent and after receiving the
initial response, 4 additional data frames are sent and the answers are stored. 3 values for the battery
temperature are obtained corresponding to 3 different sensors. These values are expressed in Celsius, each
value using 1 byte. If all temperature values are received, they are transmitted to the database.
— Finally the battery voltage and current are requested. Again this is done by sending a request frame, in this
case for group 1 data and 5 additional data requests. The battery voltage is sent in cV using 2 bytes and
the current is sent in mV using 4 bytes. It should be noticed that the battery current is the only variable
that can have either positive (charge) or negative (discharge) values. If both values are obtained they are
sent to the database.
The database used to store the values is a local InfluxDB [18] database. To access it the microcontroller is
connected to a WiFi network using an ESP8266 WiFi library [19] and the Influx packages are sent using a web
representational state transfer (RESTful API) library [20], [21]. Overall this system is able to send a value of
each of the variables every 10 seconds, which is considered satisfactory to perform the tests.
The code used to program the microcontroller can be found on Annex 1 and online at [25]. Overall this system
is able to send a value of each of the variables every 10 seconds, which is considered satisfactory to perform
the tests.
Figure 12. Data acquisition electronics
Source: JRC, 2021.
135 Results
The numbers presented in this chapter relate to the combined particular charger and EV setup.
We must highlight that all tests were performed in laboratory conditions, the environmental parameters not
changing significantly from one test to another. Although this brings an advantage when comparing the results,
in real life conditions a vehicle providing V2G/V2H services would face e.g. diverse outdoor temperatures - which
will greatly influence the capacity of the battery. Other similar literature, such as [5], mentions that charging at
lower ambient temperatures has a statistically significant adverse effect on the round-trip efficiency. It is
also mentioned that the efficiency at high and low state of charge was found to be marginally lower than
around medium state of charges
Additionally, all tests study the efficiency of full charge/discharge cycles (performed between 10% and 100%
state of charge - related to EV battery capacity), which is not expected to occur in V2G/V2H implementations (a
real life V2G/V2H scenario would use only a portion of the battery capacity, the starting and ending state of
charge being generally different from one occurrence to another).
The acquired power data is shown in the figures below for the charging and discharging tests. First the measured
power along the duration of each test is presented. As expected, comparing similar charging and discharging
tests (e.g. +/-4 kW power setpoint) the charging duration is different from the discharging duration. The effects
of the technical limit of the EV charger can be seen in the charging profile for the 7kW test.
Figure 13. Active power over time for the charging (top) and discharging (bottom) tests
Source: JRC, 2021.
Next, the relation between the battery temperature and voltage is shown on Figure 14. As mentioned in the
previous chapters, both the vehicle and the charger were located indoors at a constant temperature of ca. 20°C.
Between each charging/discharging cycle the vehicle and charger were allowed to return to room temperature
indifferent of the required time. As expected, the temperature increases during both the charging and
14discharging tests, by a value of ca. 4°C. The resolution of the temperature data provided by the 3 battery sensors
is 1°C.
Figure 14. Battery temperature averages for all tests and sensors
Source: JRC, 2021.
Figure 16 illustrates the evolution of the maximum and minimum values for the cell voltages. The small
difference between them across the different tests indicates that the energy stored in the battery is equally
distributed across the cell pairs.
Figure 15. Cell voltages over time (top - charging tests, bottom - discharging tests)
Source: JRC, 2021.
15Figure 15 shows the voltage profiles for each test. We observe that the power setpoint values generate similar
profiles.
Figure 16. Energy charged/discharged vs battery voltage measured at the battery and grid side
Source: JRC, 2021.
On Figure 17 the charging and discharging efficiency obtained for each test are shown. These are computed by
comparing the energy values at both measuring points. A slightly increasing trend in the efficiency with the
increase of the test power setpoint is noticed. Both the charging and discharging efficiencies are comparable at
ca. 90% with a round-trip efficiency of ca. 80%. These numbers represent the efficiency of the entire
experimental setup: EV and EV charger. For the 10 kW test the efficiency could not be calculated because of
technical limits (EV charger is limited to maximum 6.6 kW charging power). The numbers obtained are
comparable to the results of [5], although the tests presented in this report were performed over 90% of the
capacity of the EV battery. A lower current has a negative impact on the efficiency of the process.
The round-trip efficiency was calculated under the assumption that the EV is charged and discharged at similar
power levels (i.e. charging at e.g. 4 kW and discharging at e.g. -4 kW). This is similar to real life situations,
considering that it most instances EV users charge their vehicle using a preferred charger.
Figure 17. Efficiency of the charging/discharging tests
Source: JRC, 2021.
16In terms of absolute values (Figures 18, 19) we notice round-trip losses of ca. 6.5-8 kWh, including the minimal
battery standby losses (while the setup was allowed the recover to room temperature before a new test).
Figure 18. Absolute energy values for the charging/discharging tests
Source: JRC, 2021.
Figure 19. Absolute energy losses for the charging/discharging tests
Source: JRC, 2021.
We notice the efficiency is better for a higher charge/discharge power setpoint and for a greater amount of
charged/discharged energy (figure below). We highlight again the fact that the charge/discharge cycles
happened between the extreme state of charge values, which does not correspond to real life scenarios.
The following charts give an idea of what to expect for different situations (regarding charging/discharging
power), however they change depending on the environmental factors and the particular battery start and end
17state of charge. The charts were generated by applying a linear interpolation between the performed
experiments. They should only be seen as a basic reference.
Figure 20. Efficiency function of charge/discharge power setpoint and charged/discharged energy
(start 10%/100% SOC, end 100%/10% SOC)
Source: JRC, 2021.
186 Conclusions
The round-trip efficiency of the setup was determined to be ca. 80% for the studied charging/discharging power
levels and the specific equipment setup used in the tests. As expected, the charger plays an important role in
the setup and can influence the round-trip efficiency to a high degree. For the setup under study, 80% efficiency
translates in ca. 8kWh loss – this energy should be sufficient to power an average house for a day.
However, putting aside the fact that there is still room for efficiency improvements, V2G and V2H are solutions
that will help in the energy transition to renewable energy. Considering the variable nature of renewable energy,
storage is required to capture the excess energy or to provide energy when the demand is high (i.e. power grid
balancing). Electric vehicles offer large energy storage capacities, can stay connected to the grid most of the
time and combined together into a virtual power plant they can act as a significant storage capacity for the
power grid. A storage efficiency of 80% is more than desirable compared to the alternative of not being able
to use renewable energy because there is not sufficient storage for it.
Added to this, the battery and EV sector are seeing fast developments which will translate in better
charging/discharging efficiencies, higher energy density and larger energy storage capacities (translating in
longer EV ranges).
A real life V2G/V2H scenario would use only a portion of the battery capacity, the starting and ending state of
charge being generally different from one occurrence to another. The next step in our study is to perform real
life long-term testing for V2G/V2H use, combined with road use, with different power levels and starting/ending
state of charges.
19References
[1] Smart Grid Interoperability Laboratory, [Online]. Available: https://ses.jrc.ec.europa.eu/sgil-petten
[2] Covrig, C.F., Munoz Diaz, M.A., Georgiopoulos S. and Marinopoulous, A., Smart Grid Interoperability
Laboratory: A toolkit for smart energy management, EUR 30211 EN, Publications Office of the
European Union, Luxembourg, 2020, ISBN 978-92-76-18820-9, doi:10.2760/822668, JRC120540,
EUR 30211 EN.
[3] Y. Wi, J. Lee, and S. Joo, “Electric vehicle charging method for smart homes/buildings with a
photovoltaic system,” IEEE Transactions on Consumer Electronics, vol. 59, no. 2, pp. 323–328, May
2013.
[4] Cleveland, Cutler J.; Morris, Christopher (2006). Dictionary of Energy. Amsterdam: Elsevier. p. 473.
ISBN 978-0-08-044578-6.
[5] W. Schram, N. Brinkel, G. Smink, T. van Wijk and W. van Sark, "Empirical Evaluation of V2G Round-trip
Efficiency," 2020 International Conference on Smart Energy Systems and Technologies (SEST),
Istanbul, Turkey, 2020, pp. 1-6, doi: 10.1109/SEST48500.2020.9203459
[6] CHAdeMO fast charging for EVs, https://www.chademo.com/
[7] A Guide to Understanding Battery Specifications,
http://web.mit.edu/evt/summary_battery_specifications.pdf
[8] Nissan Leaf Versions & Specs https://www.nissan.nl/
[9] Electric Vehicle Database, https://ev-database.org/car/1106/Nissan-Leaf
[10] 2018 Leaf First Responders’ Guide
https://www-europe.nissan-
cdn.net/content/dam/Nissan/ireland/Brochures/First%20Responders%20Guide/2018%20Leaf%20Firs
t%20Responders%20Guide.pdf
[11] IEC/EN 62660-1 Standard, Secondary batteries for the propulsion of electric road vehicles - Part 1:
Performance testing for lithium-ion cells
[12] PushEVs, https://pushevs.com/2017/09/06/2018-nissan-leaf-represents-evolution-not-revolution/
[13] Open Charge Alliance, https://www.openchargealliance.org
[14] GMC Instruments, https://www.gmc-instruments.de/en/products/sineax-am3000
[15] Espressif, https://www.espressif.com/en/products/socs/esp8266
[16] Microchip, https://ww1.microchip.com/downloads/en/DeviceDoc/MCP2515-Stand-Alone-CAN-
Controller-with-SPI-20001801J.pdf
[17] Arduino, https://www.arduino.cc/en/software
[18] InfluxDB, https://www.influxdata.com/products/influxdb/
[19] ESP8266WiFi library, https://arduino-esp8266.readthedocs.io/en/latest/esp8266wifi/readme.html
[20] InfluxDB RESTfull API, https://docs.influxdata.com/influxdb/v1.8/tools/api/
[21] InfluxDB ESP8266 library, https://influxdb-python.readthedocs.io/en/latest/api-documentation.html
[22] Tseng CM, Zhou W, Al Hashmi M, Chau CK, Song SG, Wilhelm E. Data extraction from electric vehicles
through OBD and application of carbon footprint evaluation. Proceedings of the Workshop on Electric
Vehicle Systems, Data, and Applications 2016 Jun 21 (pp. 1-6).
[23] Active EV-CAN sampling https://www.mynissanleaf.com/viewtopic.php?f=44&t=11676
[24] MCP_CAN Arduino Library https://github.com/coryjfowler/MCP_CAN_lib
[25] Data retrieval code: https://github.com/covrig/EV-V2X-Data-Reading-CANbus
20List of abbreviations and definitions
EV Electric Vehicle
V2G Vehicle-to-Grid
V2H Vehicle-to-Home
SGIL Smart Grid Interoperability Laboratory
JRC Joint Research Centre
PV Photovoltaic
BESS Battery Energy Storage Systems
DC Direct Current
AC Alternate Current
OCPP Open Charge Point Protocol
SOC State Of Charge
OBD On Board Diagnostics
CAN Control Area Network
LCD Liquid Crystal Display
REST Representational State Transfer
21List of figures
Figure 1. Smart Grid Interoperability Lab ..........................................................................................................................................................3
Figure 2. Smart Grid Interoperability Lab facilities ......................................................................................................................................3
Figure 3. Example of a V2G/V2H arrangement ..............................................................................................................................................5
Figure 4. Battery location [12] ..................................................................................................................................................................................6
Figure 5. Battery details ...............................................................................................................................................................................................6
Figure 6. High voltage system [10]........................................................................................................................................................................7
Figure 7. Bidirectional charger and EV connectors ......................................................................................................................................7
Figure 8. Electric vehicle and Vehicle-to-Grid/Home (V2G/V2H) charger ......................................................................................8
Figure 9. Measuring points for the experimental setup ....................................................................................................................... 10
Figure 10. Diagram of the OBD II connector of the Nissan Leaf ................................................................................................... 10
Figure 11. Physical layer of the CAN bus ...................................................................................................................................................... 11
Figure 12. Data acquisition electronics........................................................................................................................................................... 13
Figure 13. Active power over time for the charging (top) and discharging (bottom) tests ........................................... 14
Figure 14. Battery temperature averages for all tests and sensors ............................................................................................ 15
Figure 15. Cell voltages over time (top - charging tests, bottom - discharging tests) ..................................................... 15
Figure 16. Energy charged/discharged vs battery voltage measured at the battery and grid side ......................... 16
Figure 17. Efficiency of the charging/discharging tests ....................................................................................................................... 16
Figure 18. Absolute energy values for the charging/discharging tests ...................................................................................... 17
Figure 19. Absolute energy losses for the charging/discharging tests ....................................................................................... 17
Figure 20. Efficiency function of charge/discharge power setpoint and charged/discharged energy (start
10%/100% SOC, end 100%/10% SOC) ............................................................................................................................................................ 18
22List of tables
Table 1 EV battery electrical specifications (manufacturer manual) .............................................. 6
Table 2 Bidirectional charger electrical specifications (manufacturer manual) ................................... 7
Table 3 Power charging levels [10] ................................................................................... 8
Table 4 Data groups used by the Nissan Leaf CAN bus. ...........................................................12
23Annexes
Annex 1. Data retrieval code [25]
#include
#include
#include
#include
#include
#include "Adafruit_SSD1306.h"
extern "C" {
#include
}
// WiFi: ---------------------------------------------------------------------------
const char* ssid = "";
const char* password = "";
//Influx DB: -----------------------------------------------------------------------
#define INFLUXDB_URL ""
#define INFLUXDB_DB_NAME ""
#define INFLUXDB_USER ""
#define INFLUXDB_PASSWORD ""
InfluxDBClient client(INFLUXDB_URL, INFLUXDB_DB_NAME);
// Variables used to store the results: --------------------------------------------
// The following variables may have strange units because converting them to more suitable
// units (maybe volts or amperes would result in working with floating point numbers, which
// is undesirable in general.
// Array containing the voltage of each battery cell in millivolts mV.
int cellVoltages[96];
// Battery voltage in centivolts cV.
long batVoltage;
// Battery instensity in miliamps mA.
long batIntensity;
// Battery packs temperatures in °C
byte batTemperatures[3];
// CAN Variables: ------------------------------------------------------------------
// All the information requests on the Nissan Leaf need to be sent with this identifier.
#define requestID 0x079B
// These are the messages that need to be sent to the Nissan Leaf in order to get different
// data:
// This requests the temperatures of the battery packs
byte requestBattTempBytes[] = {0x02, 0x21, 0x04, 0xFF, 0xFF, 0xFF, 0xFF, 0xFF};
// This request some general parameters of the battery, such as state of charge, voltage or
// current.
byte requestBattInfoBytes[] = {0x02, 0x21, 0x01, 0xFF, 0xFF, 0xFF, 0xFF, 0xFF};
// This requests the voltage of each battery cell.
byte requestVoltageCellsBytes[] = {0x02, 0x21, 0x02, 0xFF, 0xFF, 0xFF, 0xFF, 0xFF};
// This request additional data. Because the Nissan Leaf only sends 8 bytes long CAN
// dataframes, it splits the battery inoformation across multiple dataframes. Once the first
// of these dataframes has been delivered, these bytes can be used to request the following
// ones.
byte addionalDataBytes[] = {0x30, 0x01, 0x00, 0xff, 0xff, 0xff, 0xff, 0xff};
// The following bytes can be used to ask for all the following data, but are not used in this
// script.
byte allAdditionalDataBytes[] = {0x30, 0x00, 0x18, 0xff, 0xff, 0xff, 0xff, 0xff};
// The following variables are used when sending and receiving CAN dataframes:
// Used to store the sending ID of the incoming CAN dataframes.
unsigned long IDIncoming;
// Used to store the length of the CAN dataframes. The ones used by the Nissan Leaf are always
// 8 bytes long.
byte dlc;
// Used to store the 8 bytes that form the CAN dataframes returned by the Nissan Leaf.
byte canBytes[8];
// An array used to print information on the serial monitor.
char msgString[128];
// PINs: ---------------------------------------------------------------------------
// The INT is on pin 0, which corresponds to D3.
const int CAN0_INT = 0;
// Set CS to pin 15, which corresponds to D8.
MCP_CAN CAN0(15);
// Other variables: ----------------------------------------------------------------
// Number of times a CAN message requesting information has been sent
unsigned int numTest = 0;
// Number of errors that have occurred in the data retrieving process. These errors can
// be CAN messages not being send properly, not receiving an answer in time etc.
// A small number of errors represents some points missing in the final dataset and
// should not be a big concern.
unsigned int numErr = 0;
// Delay (in miliseconds) that the programs wait when it encounters an error before
// continuing.
24unsigned int errDelay = 2000;
// Debugging. If set to true the functions that read the CAN data print the raw hex
// values on the serial monitor
bool printHex = false;
// Variables used to measure the time the test has been runing for.
unsigned int timeMinutes;
unsigned int timeHours;
// Display configuration: ----------------------------------------------------------
const int oledReset = -1;
Adafruit_SSD1306 display(oledReset);
void setup(){
Serial.begin(9600);
while (!Serial);
// Display setup: ----------------------------------------------------------------
// Initialize the display and set the text properties
Serial.println("Initializing display");
display.begin(SSD1306_SWITCHCAPVCC, 0x3C);
display.display();
display.setTextSize(1);
display.setTextColor(WHITE);
display.clearDisplay();
display.setCursor(0,0);
// WiFi connection setup: --------------------------------------------------------
Serial.print("MAC: ");
Serial.print(WiFi.macAddress());
// Printing the MAC adress on the screen
display.print("Connecting");
display.setCursor(0,10);
display.print("MAC:");
display.setCursor(0,20);
for (byte i =0; iSerial.println("*****************************");
}else {
WiFi.disconnect();
Serial.println("WiFi error! Resetting chip!");
display.clearDisplay();
display.setCursor(0,0);
display.print("Unable to connect: restartingchip");
display.display();
delay(1500);
ESP.restart();
}
// Influx connection setup: ------------------------------------------------------
// Configure Influx client authentication
client.setConnectionParamsV1(INFLUXDB_URL, INFLUXDB_DB_NAME, INFLUXDB_USER, INFLUXDB_PASSWORD);
// Configure the Influx library so it doesn't close the http connection:
client.setHTTPOptions(HTTPOptions().connectionReuse(true));
// Check db connection
if (client.validateConnection()) {
Serial.print("Connected to InfluxDB: ");
Serial.println(client.getServerUrl());
display.print("influx..ok");
display.display();
} else {
Serial.print("InfluxDB connection failed: ");
Serial.println(client.getLastErrorMessage());
display.print("influx..Er");
display.display();
}
Serial.println("*****************************");
// MCP2515 connection setup: -----------------------------------------------------
// Initialize MCP2515 running at 16MHz with a baudrate of 500kb/s and the masks and
// filters disabled.
if (CAN0.begin(MCP_STDEXT, CAN_500KBPS, MCP_8MHZ) == CAN_OK){
Serial.println("MCP2515 Initialized Successfully!");
display.print("mcp.....ok");
display.display();
}
else {
Serial.println("Error Initializing MCP2515... Permanent failure! Check your code &
Con ections");
display.print("mcp.....Er");
display.print("Restartingchip");
display.display();
delay(1500);
ESP.restart();
}
// Set operation mode to normal so the MCP2515 sends acks to received data.
CAN0.setMode(MCP_NORMAL);
// Debugging:
// If no messages messages are being received, uncomment the setMode line below
// to test the wiring between the Ardunio and the protocol controller.
// The message that this sketch sends should be instantly received.
//CAN0.setMode(MCP_LOOPBACK);
// Configuring pin for /INT input.
pinMode(CAN0_INT, INPUT);
delay(1500);
}
void loop(){
timeMinutes = millis()/60000 % 60;
timeHours = millis()/3600000 % 24;
// The data requests are only sent if the microcontroller is properly connected
// to the WiFi
if(WiFi.status()== WL_CONNECTED){
// After checking the WiFi connection, the connection to the databse is
// checked.
if (!client.validateConnection()){
display.clearDisplay();
display.setCursor(0,0);
display.print("Influx error restartingchip");
display.display();
delay(1500);
ESP.restart();
}
numTest++;
// The all the functions defined to retrieve data from the CAN bus return a boolean
// indicating if all the were successfully obtained. If this is the case the function
// returns true and the information is sent to the database.
if (readCellVoltages()){
displayMsg("receiving");
for (byte i=0; i// Tags identifying the data.
measurement1.addTag("entity_id", "nissan_canbus_cells");
measurement1.addTag("cellPair", String(i));
measurement1.addField("value", cellVoltages[i]/1000.);
client.writePoint(measurement1);
// The following function is used to display the current status of the tests
// on the lcd display. An argument is used to indicate what type of information
// should be displayed.
displayMsg("sending");
// Print the data being sent on the serial monitor.
Serial.print(client.getLastErrorMessage());
Serial.print(" writing cell voltage: ");
Serial.println(client.pointToLineProtocol(measurement1));
}
}
// In case some error occurred during the acquisition of the data, the corresponding
// function returns false, an error message is displayed and nothing is sent to
// the database.
else{
numErr++;
displayMsg("receivingError");
delay(errDelay);
}
numTest++;
// The battery temperature is requested in a similar manner to the cell pair voltages
if (readBattTemps()){
displayMsg("receiving");
for (byte i=0; i}
/**
* The intensity is the only variable that can be positive (charging) or
* negative (discharging) because of that, it is returned as 4 bytes
* that need to be converted into a signed decimal value. This function
* does that by first checking if the decimal number is positive or
* negative (fist bit) and applying the Two's complement method
* accordingly.
*/
long convertIntensity(byte byte1, byte byte2, byte byte3, byte byte4){
long decimalIntensity = (byte2/**
* This function requests additional data to the CAN BUS. Because the Nissan Leaf only
* sends 8 bytes long CAN dataframes, it is necessary to split the battery information
* across multiple dataframes. Once the first of these dataframes has been delivered,
* this function can be used to request the following ones.
*
* The function returns true if it executed properly and false if it encounters any errors.
*/
bool readAdditionalData(){
if (CAN0.sendMsgBuf(requestID, 8, addionalDataBytes) != CAN_OK) {
Serial.println("An error ocurred during the request for additional data");
return false;
}
delay(500);
// Variable that indicates if a response to the request has been received.
bool msgReceived = false;
// Maximum number of times the wile loop is runned. If no value is receive before
// this maximum is reached, the function is aborted and returns false.
byte maxIterations = 25;
byte numIterations = 0;
while (!msgReceived){
if (numIterations==maxIterations){
Serial.println("No response to the initial request received before time expired");
return false;
}
msgReceived = !digitalRead(CAN0_INT);
// If CAN0_INT pin is low, read receive buffer.
if (msgReceived){
CAN0.readMsgBuf(&IDIncoming, &dlc, canBytes);
// Determines if message is a remote request frame.
if ((IDIncoming & 0x40000000) == 0x40000000) {
Serial.println("The request for additional data returned a remote request frame");
return false;
}
// Checks if the ID of the response is 0x7BB
else if (IDIncoming != 1979ul) {
sprintf(msgString, "Response received from an unexpected ID: %.3lX", IDIncoming);
Serial.println(msgString);
return false;
}
else {
return true;
}
}
else{
numIterations++;
delay(300);
}
}
}
/**
* This function is defined to read Nissan Leaf battery voltage and current. It
* checks that the received dataframes correspond to the desired information and the
* results are stored on the variables batIntensity and batVoltage.
*
* The function returns true if it executed properly and false if it encounters any errors.
*/
bool readBattInfo(){
if (CAN0.sendMsgBuf(requestID, 8, requestBattInfoBytes) != CAN_OK) {
Serial.println("Battery information error: An error ocurred during the initial request");
return false;
}
else{
Serial.println("Battery information: Initial request sent");
}
delay(100);
// Variable that indicates if a response to the request has been received.
bool msgReceived = false;
// Maximum number of times the wile loop is run. If no value is received before this maximum
// is reached, the function is aborted and returns false.
byte maxIterations = 25;
byte numIterations = 0;
while (!msgReceived){
if (numIterations==maxIterations){
Serial.println("Battery information error: No response to the initial request received
before time expired");
return false;
}
msgReceived = !digitalRead(CAN0_INT);
// If CAN0_INT pin is low, read receive buffer
if (msgReceived){
29You can also read