Utilizing Quantitative Reliability Optimization to Better Drive Facility-Wide Reliability and Maintenance Budgets
←
→
Page content transcription
If your browser does not render page correctly, please read the page content below

ASSET INTEGRITY INTELLIGENCE

Utilizing Quantitative Reliability
Optimization to Better Drive Facility-Wide
Reliability and Maintenance Budgets
Michael Wallace, Senior Solutions Engineer at Pinnacle
Nathanael Ince, Vice President of Business Development at Pinnacle
Ryan Myers, Product Manager at Pinnacle

VOLUME 27, ISSUE 3
MAY | JUNE 2021

Utilizing Quantitative Reliability Optimization
to Better Drive Facility-Wide Reliability and
Maintenance Budgets
Michael Wallace, Senior Solutions Engineer at Pinnacle
Nathanael Ince, Vice President of Business Development at Pinnacle
Ryan Myers, Product Manager at Pinnacle

Introduction                                                         reliability performance using cutting-edge data science, and
Current reliability methodologies such as risk-based inspection delivers continually optimized reliability plans.
(RBI), reliability-centered maintenance (RCM), and reliability
                                                                     In this article, we’ll discuss how QRO is the industry’s next step in
availability maintainability (RAM) have helped the industry make
                                                                     reliability by looking at three industry challenges and how QRO
great advances in managing reliability. While proper deployment
                                                                     addresses them:
of these methodologies adds ample value, reliability and oper-
ational leaders today still struggle to objectively answer mac- 1. Identifying failure modes across different asset and
ro-level reliability questions across their facilities. For example,   failure types
how can facility leaders defend their maintenance and reliability
                                                                     2. Quantifying the failure curve
budgets going into the next fiscal year? How can leaders decide
which areas of their budget to adjust when asked to reduce their 3. Connecting individual assets to facility performance and
spending across their operations? These budgets are comprised of        driving better plans
smaller reliability programs and budgets ranging from predictive
maintenance to fixed equipment inspection, and therefore mak- Identifying Failure Modes Across Different
ing objective decisions in how to make a broad reduction chal- Asset and Failure Types
lenging and arduous even with the best methodologies.
                                                                     What current challenges do facility leaders face?
Quantitative reliability optimization (QRO) is an approach that Reliability leaders need to be able to understand how and when
enables reliability and operations leaders to make smarter and their assets will fail, and what activities need to be performed to
more confident reliability decisions for their facilities. This mitigate the probability of those failures from occurring and pre-
approach both evolves and integrates the best elements of cur- pare for maintenance at the optimal point in time when required.
rent models and methodologies while introducing novel analy- Current reliability methodologies typically target a particular set
sis concepts to quantitatively balance process safety availability of failure modes or equipment types with approaches like failure
targets with maintenance and reliability investments. QRO takes modes and effects analysis (FMEA) and RCM. These approaches
large volumes of reliability and economic data, analyzes system usually focus on functional failure modes, failure mechanisms,

    Figure 1. QRO brings the best of all methodologies together to empower reliability leaders to drive their budgets appropriately.

2     Inspectioneering Journal    MAY | JUNE 2021
Figure 2. Example of asset risk analysis (ARA) for the inner bearing of a pump.

and general task selection. Risk-based inspection, on the other                   condition monitoring systems. This information is used to better
hand, focuses on specific damage mechanisms that could result                     predict failure and forecast facility performance enabling facility
in a loss of containment and the associated inspection tasks to                   leaders to make better reliability decisions with accurate, up-to-
manage risk.                                                                      date information.
The information associated with these disparate programs is
often stored in different spreadsheets and software systems,
                                                                                  Quantifying the Failure Curve
forcing facility leaders to navigate through multiple data sources
                                                                                  What current challenges do facility leaders face?
whenever they need to compare the risks of various assets. This
                                                                                  While determining the potential failure modes and failure mech-
situation can be especially frustrating for leaders whenever they
                                                                                  anisms of each asset is important, the next major challenge is
have to quickly compare and prioritize their limited resources;
                                                                                  understanding the probability of failure (POF), and therefore the
due to their siloed nature, there is not a common approach to
                                                                                  risk at any point in time of that specific failure occurring. When it
quantifying risk which makes this task near impossible to effec-
                                                                                  comes to determining an asset’s POF, existing reliability method-
tively or consistently complete. For example, if a facility has
                                                                                  ologies vary widely in their approach.
extra budget to invest into their reliability programs, how will
they know which programs or specific assets they should invest                    For example, methodologies used in RBI can vary between highly
in? Alternatively, if a facility needs to reduce their budget, how                qualitative to quantitative where generic failure frequencies for
can they identify which area they can cut out of the budget                       specific equipment types and asset specific information, such as
with minimal impact? In these situations, leaders need to be                      thickness data and corrosion rates, are used to determine a POF.
able to quickly compare the risks and the associated impact of                    The approach taken in RCM, however, is typically highly qualita-
reliability investment to make educated reliability decisions in                  tive and results fall into generalized risk matrix categories based
resource prioritization.                                                          on the individual(s) running the study and available historical
                                                                                  data. Additionally, while the POF may be determined on this qual-
QRO Uses Asset Risk Analysis to Break Down
                                                                                  itative/quantitative spectrum in the initial study, it is often not
Siloed FMEA
                                                                                  linked to real-time process or operational changes, especially in
To address this challenge, QRO analyzes every asset in a facility
                                                                                  highly sensitive areas where damage rates could highly fluctuate
through a single, data-driven approach by using an asset risk
                                                                                  based on these changes. As a result, the POF for a single failure
analysis (ARA). The ARA integrates first principles engineering
                                                                                  mode of an asset can easily become outdated, especially when
analysis, quantitative asset data, and field execution to assess
                                                                                  studies or re-validations are not performed on a regular basis,
each asset effectively and consistently. The ARA identifies and
                                                                                  which can also be a manual, time-consuming effort.
links the functions, failure modes, and failure mechanisms for
all assets in a facility as well as the sources of critical reliability
                                                                                  QRO Quantifies the POF Curve Through Lifetime
data (the data tasks that help to monitor damage and predict
                                                                                  Variability Curves
failure), as well as the maintenance tasks required to maintain
                                                                                  To address this challenge, QRO uses lifetime variability curves
or restore function. This holistic approach to evaluating and
                                                                                  (LVCs) to more precisely determine the POF of an asset’s applica-
managing risks for all asset types ensures that other resources
                                                                                  ble failure modes by leveraging available facility data such as pro-
such as people, processes, and technology are included in the
                                                                                  cess data, condition monitoring data, thickness data, and other
analysis while laying the foundation for common language and
                                                                                  sources of critical reliability data. Future performance is modeled
quantitative assessment.
                                                                                  based on data behavior and dynamically adjusts failure forecasts
Figure 2 shows an example of an ARA for the inner bearing of                      through identifying and quantifying trends, changes in data
a pump. The ARA shows the function, failure modes, and failure                    states, and uncertainty in key data features and inputs. As LVCs
mechanisms of the inner bearing, along with the linked data and                   are fed real-time facility data, the LVC’s projections and associ-
maintenance tasks that will help manage the risk of the pump. All                 ated band of uncertainty becomes more accurate and refined over
failure modes, mechanisms, and tasks are quantitatively linked                    time which enables better failure prediction of assets and, more
to near real-time data, such as information from the CMMS and                     importantly, when specific actions should be taken.

                                                                                                           MAY | JUNE 2021   Inspectioneering Journal   3
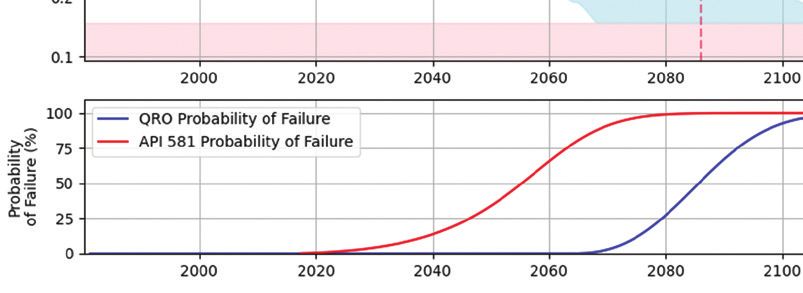
Figure 3. Comparing the LVC of API 581 with QRO for general thinning on a drum.

Figure 3 compares the calculations from API 581, a common                   modeling, most reliability methodologies are equipment-centric
approach to RBI, and QRO for thinning degradation on a vessel               and do not directly relate a specific asset’s FMEA and risk results
wall. While both methodologies utilize thickness data in their              to the overall unit or facility even though assumptions are made
calculations, the LVC takes advantage of other available infor-             in an attempt to approximate this. As a result, it can be difficult
mation such as the expected uncertainty in each thickness mea-              for facility leaders to answer questions like what is the value of
surement, the variability in measured degradation, subject matter           continued reliability data collection (i.e., a visual inspection, oper-
expert (SME) degradation expectations, and available process                ator round, vibration reading, etc.) or what is the impact of major
data. In addition to more precisely modeling failure, the LVC also          process or design changes (i.e., updating an equipment sparing
accounts for future variability in degradation modeling a proba-            plan, upgrading a metallurgy, changing an operational tempera-
bility weighted range of failure dates.                                     ture, etc.) on overall facility reliability the next three years? On
                                                                            a larger scale, it can be difficult for facility leaders to determine
Although the example above is for thinning, the LVC can be
                                                                            the value of their annual reliability and maintenance budget in
applied across various equipment types and failure modes, rang-
                                                                            terms of facility reliability and process safety, or identify where
ing from creep on fixed equipment to excessive vibration and
                                                                            there is waste in the annual budget and have the quantitative con-
lubrication issues on rotating assets to functional performance of
                                                                            fidence to make changes in the plan. As a result, the answers to
heat exchangers. The LVC enables a consistent, dynamic calcula-
                                                                            these questions are either painstaking or come up short and with
tion of the POF, risk, and availability for each asset in near real
                                                                            a large degree of uncertainty.
time.

Connecting Individual Assets to Facility                             QRO Connects LVCs To Overall Facility Performance
Performance and Driving Better Plans                                 QRO links each of the LVCs per asset to the performance of the
                                                                     overall system. This system could be as narrow as a single pro-
What current challenges do facility leaders face?                    cess system or as extensive as an entire supply chain ranging
At the end of the day, reliability and operations leaders care about from wellhead through pipeline to the refinery or petrochemical
how their equipment reliability connects to their overall facil- processing units. Each asset in this supply chain is statistically
ity production and process safety. With the exception of RAM related to each other, modeling each asset’s impact on the facility’s

4   Inspectioneering Journal   MAY | JUNE 2021
Figure 4. Example of QRO system model relating all LVCs to each other, showing pump breakout.

availability. Due to the live links of facility data to each asset’s LVC
                                                                     reliability methodologies have helped these leaders improve
models, system availability can now be forecasted and adjusted       planning over the past several decades, resulting in substantial
dynamically as new data is available and tasks are executed in       improvements in utilization, process safety, and spend. However,
the field.                                                           moving forward, QRO presents these leaders with a data-driven
                                                                     way to develop and maintain plans with a higher degree of con-
An example for a unit has been shown in Figure 4.
                                                                     fidence than ever before, while enabling agile adjustments based
When all of the LVCs are connected to the overall system, facility on economic, design, operational, or process changes. ■
leaders have access to a complete reliability model of the facility
                                                                     For more information on this subject or the author, please email
that can be used to effectively balance investments and outcomes.
                                                                     us at inquiries@inspectioneering.com.
With this in place, QRO uses optimization routines to optimize
all activities with specific targets in mind. For example, if a cur-
rent facility is targeting a three-year availability of 97%, QRO can
produce an optimized set of data and maintenance activities to
deliver that outcome. Further, with specific margins determined,
QRO can maximize facility bottom-line profit by optimizing
activities and total uptime while hitting process safety targets.
Additionally, QRO can provide objective spending implications of
pushing out a turnaround, adjusting warehousing stocking lev-
els, or develop a re-optimized reliability plan based on adjusted
facility margins. With this type of optimization capacity, the
ability to plan faster and with greater confidence can extend to
a myriad of use cases, including condition monitoring location
(CML) optimization, field sensor strategy optimization, and field
execution resourcing.

Conclusion
In the age of Industry 4.0 and the increasing availability of data and
heightened global competition, reliability and operational leaders
are faced with driving reliability and maintenance investments
that result in sustainable and profitable operations. Conventional

                                                                                                MAY | JUNE 2021   Inspectioneering Journal   5
CONTRIBUTING AUTHORS

                                                 Nathanael Ince
                                                 Nathanael Ince, Vice President of Business Development at Pinnacle, has more than 14 years
                                                 of experience in mechanical integrity and reliability programs. Nathanael has served process
                                                 facilities across the oil and gas, chemical, and mining sectors, and has held the roles of asset
                                                 integrity consultant, project lead, solutions engineer, solutions director, and now, vice presi-
                                                 dent of business development. In his current role, he focuses on ensuring Pinnacle is helping
                                                 industrial facilities leverage the right data to make better reliability and mechanical integrity
                                                 decisions. Nathanael obtained his Bachelor of Science in Mechanical Engineering from
                                                 Texas A&M University.

                                                 Ryan Myers
                                                 Ryan Myers, product manager at Pinnacle, oversees all new product development activities.
                                                 He leads multi-disciplinary technical teams across engineering, data science, and software
                                                 development fields to drive the creation of new products and services focused on increasing
                                                 customer value through transforming their reliability, integrity, and maintenance programs.
                                                 Ryan specializes in mechanical integrity and reliability engineering, project management,
                                                 operational excellence, digital transformation, and product management. Ryan also has
                                                 extensive experience both developing and applying decision analytics and mathematical
                                                 models to improve business performance. Ryan obtained his Bachelor of Science in
                                                 Mechanical Engineering with a minor in business from The University of Texas and is
                                                 also a certified Lean Six Sigma Black Belt.

                                                 Michael Wallace
                                                 Michael Wallace, senior solutions engineer at Pinnacle, collaborates and develops best-in-
                                                 class solutions to make heavy processing facilities more reliable. Michael manages Pinna-
                                                 cle’s sales process from detailed scope development to setting up projects for successful
                                                 execution and is passionate about finding creative approaches to accomplish greater results
                                                 than were originally imagined to improve our industry's safety and to help facilities run more
                                                 reliably. Michael is also an experienced quality manager with a demonstrated history of work-
                                                 ing in the oil and energy engineering service industry as well as leading special-emphasis
                                                 projects in mining, agricultural chemical, and nitrogen products facilities. Michael obtained
                                                 his Bachelor of Science in Mechanical Engineering from Texas A&M University.

6   Inspectioneering Journal   MAY | JUNE 2021
On average, global refineries spend between $1.20
 and $2.50 on reliability per barrel of throughput
   How does reliability affect your facility? Download Pinnacle’s
   Economics of Reliability Report at pinnaclereliability.com to
 learn how reliability can make the difference between being an
  industry leader or turning off the lights and closing the door.

                               Pinnacle’s Economics of Reliability Reports, released annually with
                    supplemental quarterly interim reports, analyzes the impact of reliability on
                   critical global industries. The next interim report will explore reliability in the
                      water and wastewater industry. Visit pinnaclereliability.com to learn more.

                                                                  MAY | JUNE 2021   Inspectioneering Journal   7

You can also read