MI COVID response
Data and modeling update
July 5, 2022
←
→
Page content transcription
If your browser does not render page correctly, please read the page content below
MI COVID response Data and modeling update July 5, 2022
Epidemiologic Surveillance: Key Messages
COVID-19 pandemic is surging in some parts of the globe and within the United States
• The surge in several European counties are continuing to increase and is being seen in more countries
• Within the U.S., case rates increased 7% over the past week
• Most midwestern states (region 5) are at a plateau but parts of the U.S. (Southeast and West) are seeing increases

COVID spread in Michigan is no longer declining
• COVID spread is assessed from many different markers including CDC community levels and other surveillance systems
• As of June 30, 17% of Michigan Counties at Medium or High COVID-19 Community Levels, which is a slight improvement
  from last week
  •   No Michigan counties are classified as High this week according to CDC’s Community Levels
  •   14 Michigan counties are currently at Medium level (17%). This represents 10% of the population.
• The Rt for Michigan is increasing above 1 indicating elevated COVID spread is potential
• The proportion of specimens sequenced and identified as BA.4, and BA.5 in the U.S. and Michigan continues to rise
• 30% of SWEEP sites saw an increase in the most recent week and another 10% of sites saw a plateau in trends

COVID-19 hospital metrics in Michigan remain lower than past surges
• COVID-19 hospital admissions, hospital census, ICU census, and pediatric hospitalizations are mostly steady this week
  from last week but there are some early signs of regional increases
Global and National Trends: BA.4 and BA.5 are causing resurgences
                                                                                                                                                  Region 5 New COVID-19 Cases, Reported to CDC
                                                                                                                                                       Seven-day moving average of new cases per 100K
                                                                                                                                   50

                                                                                                                                   40

                                                                                                                                   30

                                                                                                                                   20

                                                                                                                                   10

                                                                                                                                    0
                                                                                                                                        3/1      3/8     3/15     3/22      3/29      4/5   4/12   4/19   4/26   5/3   5/10   5/17
                                                                                                                                              Illinois       Indiana          Michigan       Minnesota      Ohio       Wisconsin

 Globally, 550,725,753 cases and 6,340,776 deaths (Data* through 7/5/2022)
 •    Case rates for several European countries are increasing
 United States: Reported cases (7-day average) have increased over 7.4% since the prior week¶
 •    In the U.S., the case rate is 232 cases/100,000 in last 7 days (last week: 216 cases per/100,000)
 Continued signs of plateaus in some parts of Region 5 (Midwest) states, including Michigan
 •    Illinois and Wisconsin have the highest case rates in Region 5 (6/27)

Source: * Johns Hopkins Coronavirus Resource Center; ¶ CDC COVID Data Tracker Weekly Review; † CDC COVID Data Tracker – CDC recently updated their methodology for reporting case rates
Cases are                                  East Coast                         South

increasing or
plateaued in all
regions of the US
• Increases in the South &
  West Coast Regions
• Plateau or increases in the
  East Coast & Midwest/Mtn                 Midwest & Mountain                 West Coast
  Regions
                                                        - includes Michigan

    10                                 1
           8                       2
                       5
    9              7           3

                           4
               6
Draft                                                                                                                                                                                SARS-CoV-2 Spread

     As of June 30, No Michigan Counties at High COVID-19 Community Level

                                                                                   •       In the US, 20% of counties have high risk for medically significant disease
                                                                                           and healthcare strain
                                                                                   •       0% of Michigan residents reside in a county with a High COVID-19
                                                                                           Community Level
                                                                                   •       14 Michigan counties are currently at Medium level (17%). This
                                                                                           represents 10% of the population.
                                                                                   •       69 Michigan counties are currently at Low level (83%). This represents
                                                                                           90% of the population.

 Percent of Counties
              United                                          Percent of MI
               States                       Michigan            Population
  Low            45%                            83%                    90%
  Medium         35%                            17%                    10%
  High           20%                              0%                     0%

Source: CDC COVID-19 Community Levels https://covid.cdc.gov/covid-data-tracker/#county-view?list_select_state=all_states&list_select_county=all_counties&data-type=CommunityLevels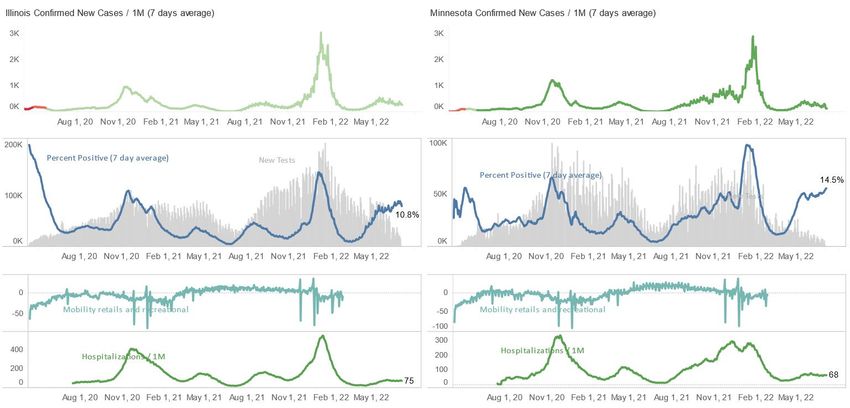
Source: mistartmap.info

Local Prevention Decisions Should Use Community Levels in Concert
with Other Pandemic Indicators
Case rates are plateaued in Michigan, and are showing some signs
  of potential increase
        Michigan Rt has reached 1 (plateau)               11 counties currently showing increases and 12 in
                                                          elevated incidence plateaus (via mistartmap.info
                                                          as of 6/27/22, data through 6/20/22).

                    Michigan Case Rates

Sources: MDSS cases plotted by onset date as of 7/1/22.
Identified COVID-19 Cases Caused by Variants of Concern (VOC) in
  US and Michigan
    SARS-CoV-2 Variants Circulating in the                                 VOC Distribution in Michigan
    United States, May 15 – Jul 2 (NOWCAST)

                                                                               •   Since May 15, there have 2,589 VOC specimens sequenced
                                                                               •   100% of specimens sequenced are Omicron
                                                                                      • A majority of those are BA.2 (93.5%)
                                                                                      • The fraction of specimens identified as BA.4 (n=76) and BA.5
                                                                                         (n=95), and recombinant is increasing
Data last updated Jul 5, 2022
Source: CDC COVID Data Tracker: Genomic Surveillance and Michigan’s MDSS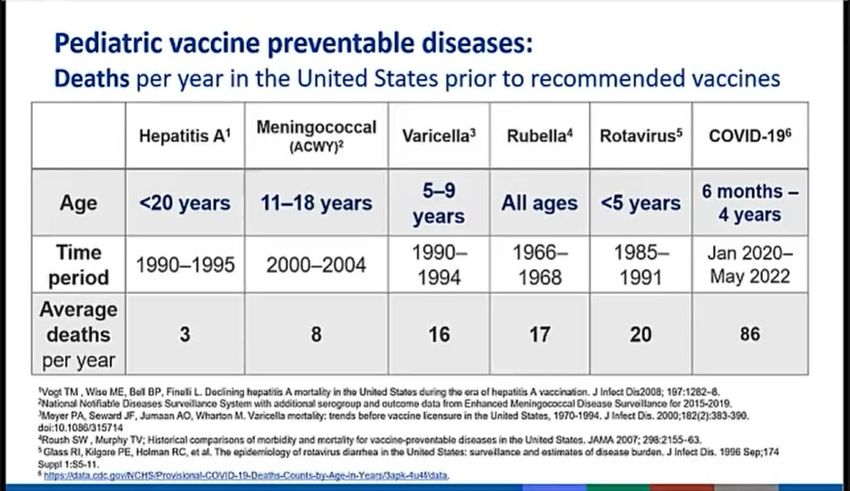
SWEEP Summary
                                                                                                                                                       •   30% (6/20) of
                                                                                                                                                           sentinel sites are
                                                                                                                                                           showing increasing
                                                                                                                                                           trends over last 15-
                                                                                                                                                           days
                                                                                                                                                       •   10% (2/20) of sites
                                                                                                                                                           have plateaued over
                                                                                                                                                           the last 15 days
                                                                                                                                                       •   60% (12/20) of
                                                                                                                                                           sentinel sites are
                                                                                                                                                           showing declines in
                                                                                                                                                           the previous 15-days

Source: MDHHS – Sentinel Wastewater Epidemiology Evaluation Project - https://www.michigan.gov/coronavirus/0,9753,7-406-98163_98173-573480--,00.html                        10
Interpreting Wastewater Should Be In Context with Other Indicators
• When levels of virus in wastewater are low, a
modest increase overall in virus level can appear
much larger as numbers are translated into
percentages
• This does not necessarily mean we will see
major increases in transmission in the
community
• When increases are seen within one wastewater
site, public health officials compare with
neighboring communities and other data sources
to understand potential of surges
• For example, the Ypsilanti WWTP saw
increases in SARS-CoV-2 levels which
correlated with increasing presence of Omicron
BA.2 lineage and then followed by an increase
in cases
Source: MDHHS – Sentinel Wastewater Epidemiology Evaluation Project - https://www.michigan.gov/coronavirus/0,9753,7-406-98163_98173-573480--,00.html 11Case rates by age, race, and ethnicity show mixed trends
Daily new confirmed and probable cases per million by age group (7-day rolling average)
500 0-9 30-39 60-69
10-19 40-49 70-79
20-29 50-59 80+
• Case rates by onset date for all age groups are
400
between 67.3 and 195.0 cases per million
300 (through 6/24)
• Case counts and case rates are highest for 30-
200
39-year-olds this week, followed by 80+year-olds
and the 40-49-year age groups
100
0
4/1 4/15 4/29 5/13 5/27 6/10 6/24
Daily new confirmed and probable cases per million (7 day rolling average) by race & ethnicity category
500 500
American Indian/Alaska Native Black/African American Hispanic or Latino Not Hispanic or Latino • Case rates are highest
Asian/Pacific Islander White
400 400
for Asian/Pacific
Islander populations
300 300 (169.1 cases/million)
• Between 21-26% of
200 200
cases in last 30 days
100 100 have missing
race/ethnicity data
0 0
4/1 4/15 4/29 5/13 5/27 6/10 6/24 4/1 4/15 4/29 5/13 5/27 6/10 6/24
Note: Case information sourced from MDHHS and reflects date of onset of symptoms 12
Source: MDHHS – Michigan Disease Surveillance SystemNew MDHHS dashboard shows cases among K-12 age individuals by ISD & School District
• Case rates among school-aged populations show signs of decline along with other age groups
• Interactive dashboard is available & updated weekly at https://www.michigan.gov/coronavirus/stats/k-to-12-aged-isd-reporting
13Cases Among Staff and Residents Experienced Signs of Plateaus and
Decreases in Long Term Care Facilities
STATE OF MICHIGAN WEEKLY TOTAL CONFIRMED COVID-19 CASES IN STATE OF MICHIGAN WEEKLY TOTAL CONFIRMED COVID-19 CASES IN
AFC/HFA RESIDENTS AND STAFF SNF
06/30/2021 TO 06/29/2022 RESIDENTS AND STAFF
1800 07/02/2021 TO 07/01/2022
1800
1600
1600
1400
Number of Cases
Number of Cases
1400
1200 1200
1000 1000
800 800
600 600
400 400
200 200
0 0
6/30 7/30 8/29 9/28 10/28 11/27 12/27 1/26 2/25 3/27 4/26 5/26 6/25 7/2 8/2 9/2 10/2 11/2 12/2 1/2 2/2 3/2 4/2 5/2 6/2
Weekly Total Confirmed Cases Resident Weekly Total Confirm Cases Staff Weekly Total Confirmed Cases Resident Weekly Total Confirm Cases Staff
• Case counts in residents increased in AFC/HFA (111 to 147) but decreased in SNFs (210 to 149) since last week
• Case counts in staff are plateaued within AFC/HFA (116 this week, 115 last week), and decreased in SNFs (291 to 243) since last week
• 30% of SNFs are reporting nursing shortages and 31% of SNFs are reporting aide shortages, which is stable from last week
Abbreviations: AFC: Adult Foster Care; HFAs: Homes for the Aged; and SNF: Skilled Nursing Facilities
14
The data is from weekly reporting by facilities with bed occupancy of at least 13 beds.Reported Number of Outbreaks in Long Term Care Facilities are Decreasing
Number of AFC/HFAs with 3 or more Confirmed Number of SNFs with 3 or more Confirmed Cases
Cases
120 120
100 100
Number of Facilities
80 80
Number of Facilities
60 60
40 40
20 20
0 0
7/2 8/2 9/2 10/2 11/2 12/2 1/2 2/2 3/2 4/2 5/2 6/2 7/2 8/2 9/2 10/2 11/2 12/2 1/2 2/2 3/2 4/2 5/2 6/2
• The number of Long-Term Care Facilities reporting 3 or more cases within a single reporting period increased in AFC/HFA
from 11 to 17; and decreased in SNF from 24 to 19 in most recent data.
The data is from weekly reporting by facilities with bed occupancy of at least 13 beds.Hospital admissions due to COVID-19 remain lower than past surges
• Trends for daily average hospital admissions saw a plateau (+1%) since last week (vs. -8% prior week)
• Most reported age groups were steady this week compared to last week
• Those 60-69, 70-79, and 80+ are seeing between 20-30 daily hospital admissions
Source: CHECC & EM Resource
16Hospital Admissions and Admission Rates by Age Group
Daily new hospital admission per million by age group (7-day rolling average)
Age Average† daily Average† Daily One Week • Through July 4, there were an average of 104.3
Group number of hospital Hospital % Change (Δ #) hospital admissions per day due to COVID-19; a
admissions Admission Rate* decrease from last week (+1%, +1)
0-11 3.1 2.3 -12% (-Statewide Hospitalization Trends: Total COVID+ Census
Hospitalization Trends 7/1/2021 – 7/5/2022
Confirmed Positive & Persons Under Investigation (PUI) COVID+ census in hospitals has increased by 5%
from last week (last week decreased 3% from
the previous week). Overall census is currently
742 patients.
Hospitalized COVID Positive Long Term
Trend (beginning March 2020)
Confirmed Positive
PUI
18Statewide Hospitalization Trends: Regional COVID+ Census
Hospitalization Trends 7/1/2021 – 7/5/2022 This week hospitalizations have decreased or
Confirmed Positive by Region remained flat in Regions 2N, 2S, and 3.
Hospitalizations have increased in Regions 1, 5, 6,
Region 1 7, and 8.
Region 2N
Region 2S
Region 3 All regions have less than 100 hospitalizations/M.
Region 5
Region 6
Region 7 Region COVID+ Hospitalizations COVID+
Region 8 (% Δ from last week) Hospitalizations /
MM
Region 1 65 (14%) 60/M
Region 2N 152 (-3%) 69/M
Region 2S 200 (-4%) 90/M
Region 3 96 (-1%) 85/M
Region 5 67 (14%) 70/M
Region 6 117 (17%) 80/M
Region 7 32 (52%) 64/M
Region 8 13 (18%) 42/M
19Statewide Hospitalization Trends: ICU COVID+ Census
Hospitalization Trends 7/1/2021 – 7/5/2022 Overall, the volume of COVID+ patients in ICUs has
decreased by 2% from last week. There are 88 COVID+
Confirmed Positive in ICUs patients in ICU beds across the state.
ICU occupancy is below 85% in all regions except Region 3.
All regions have 5% or fewer ICU beds occupied by COVID+
patients.
Region Adult COVID+ in ICU % of ICU beds
ICU (% Δ from Occupancy COVID+
Confirmed last week)
Positive in ICU Region 1 5 (-29%) 82% 3%
Region 2N 22 (47%) 64% 4%
Region 2S 27 (-16%) 75% 4%
Region 3 11 (-21%) 87% 4%
Region 5 7 (-22%) 62% 4%
Region 6 8 (14%) 73% 4%
Region 7 7 (133%) 79% 5%
Region 8 1 (-67%) 61% 2%
20Statewide Hospitalization Trends: Pediatric COVID+ Census
Hospitalization Trends 1/1/2021 – 7/5/2022
Pediatric Hospitalizations, Confirmed + PUI
21Average new deaths have decreased for those over the age of 80
Daily COVID-19 deaths in confirmed and probable Total COVID-19 deaths in confirmed and probable
cases per million by age group (7 day rolling average) cases by age group (past 30 days, ending 6/24/2022)
30 0-19 40-49 70-79 • 9.2% of deaths below age sixty
20-29 50-59 80+
25 30-39 60-69 Total
241
20
15
10 95
50
5
15
1-5 1-5 6 1-5
0
4/1 4/15 4/29 5/13 5/27 6/10 6/24 0-19 20-29 30-39 40-49 50-59 60-69 70-79 80+
• Through 6/24, the 7-day avg. death rate has decreased (9.4 deaths per million people) for those over the age of 80
• In the past 30 days, there are fewer than 15 among confirmed and probable COVID-19 cases under the age of 50
• 30-day proportion of deaths among those under 60 years of age is 6.9%. This proportion has decreased incrementally over the last two months
(last week 9.2%)
22
Note: Death information sourced from MDHHS and reflects date of death of confirmed and probable cases.
Source: MDHHS – Michigan Disease Surveillance System (MDSS)Daily average deaths per million people by race and ethnicity have
plateaued or are decreasing
Average daily deaths per million people by race Average daily deaths per million people by ethnicity
5 American Indian/Alaska Native Black/African American 5
Asian/Pacific Islander White Hispanic or Latino Not Hispanic or Latino
4 4
3 3
2 2
1 1
0 0
4/1 4/15 4/29 5/13 5/27 6/10 6/24 4/1 4/15 4/29 5/13 5/27 6/10 6/24
• Deaths are lagging indicator of other metrics
• Currently, the White population has the highest death rate (1.5 deaths/million)
Note: Death information sourced from MDHHS and reflects date of death of confirmed and probable cases.
Source: MDHHS – Michigan Disease Surveillance System
23Harm Reduction: Key Messages
Empowering community members to make best choices for their individual circumstances and to be prepared by making a COVID plan
Michiganders can take advantage of local, state, and national COVID-19 resources
Get tested, and if positive, seek care with therapeutics (e.g., antibodies or antiviral medications)
• Cumulative therapeutic availability and administration increased dramatically since April, then declined with falling cases and
hospitalizations but has recently increased
• Talk to your doctor about whether you should get antibody or antiviral treatment, and where you can find treatment.
• Therapeutics are authorized for people who meet select criteria
• Additional public health, regulatory, and policy efforts might help decrease barriers to oral antiviral access, particularly in communities with
high social vulnerability
Vaccinations remain the best way to protect from COVID-19, especially from severe disease
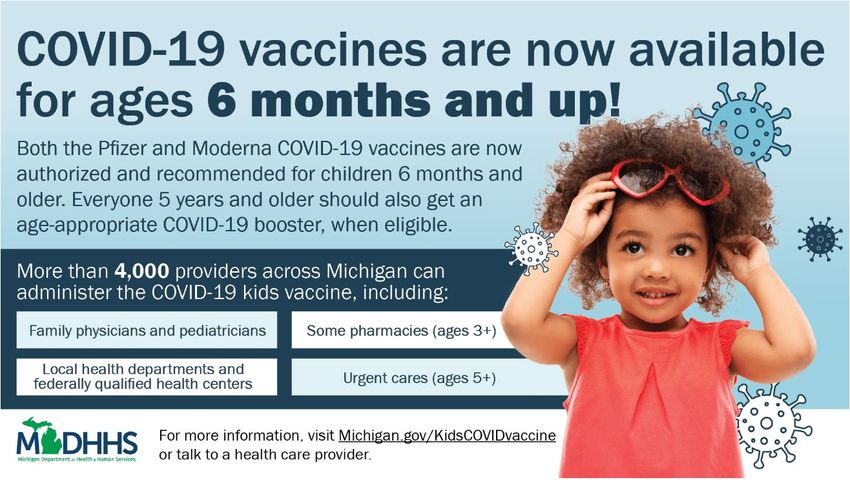
• COVID-19 vaccines are now available for ages 6 months and up
• Everyone 6 months and older should also get an age-appropriate COVID-19 booster, when eligible
• Over 6.7 million Michiganders have received at least one dose (67.5%)
• 55.3% of fully vaccinated Michiganders have received at least one booster
• 27.9% of people in Michigan (599K+) with a first booster dose have received a second booster doseFederal & Michigan websites assist COVID positive residents find treatment
COVID-19 resources available on federal website: COVID.gov
Test-to-Treat program simplifies access to COVID treatment:
Find a Test-to-Treat location near you
If you have COVID-19 symptoms, do not wait to get treated
You must take oral COVID-19 medication within 5 days of your first
COVID-19 symptoms
Use the tool to find a location that is right for you
COVID-19 Therapeutic Doses* Administered in 2022
12000 12000
Bebtelovimab
10000 Evusheld 10000
Molnupiravir
Paxlovid
8000 Sotrovimab 8000
Total Therapeutic Doses
6000 6000
Source: Screen capture of Michigan Test-to-Treat sites from linked website
4000 4000
Therapeutic administration increased during
2000 2000 Michigan's Spring Omicron surge. Supply
limitations in January 2022 required
0 0 strategic distribution and should not be
1/5 2/5 3/5 4/5 5/5 6/5 compared directly.
Source: HHS – Tiberius
*Data is reported as a single patient course, except for Evusheld, which is reported as the number of 300mg doses administered. Data Updated June 28Dispensing of Oral Antiviral Drugs for Treatment of COVID-19 by Zip Code–
Level Social Vulnerability — United States, December 23, 2021–May 21, 2022
• Lagevrio and Paxlovid are oral antiviral drugs effective at
preventing hospitalization and death in patients with
mild to moderate COVID-19 who are at risk for
progression to severe disease
• During December 23, 2021–May 21, 2022, 1,076,762
oral antiviral prescriptions were dispensed in the United
States.
• The overall number of antivirals dispensed
increased
• However, by the end of the study period,
dispensing rates were lowest in high vulnerability
zip codes, despite these zip codes having the
largest number of dispensing sites
• Additional public health, regulatory, and policy efforts
might help decrease barriers to oral antiviral access,
particularly in communities with high social vulnerability
Source: Gold JA, Kelleher J, Magid J, et al. Dispensing of Oral Antiviral Drugs for Treatment of COVID-19 by Zip Code–Level Social Vulnerability — United States,
December 23, 2021–May 21, 2022. MMWR Morb Mortal Wkly Rep 2022;71:825-829. DOI: http://dx.doi.org/10.15585/mmwr.mm7125eVaccinations and Boosters
• Over 16.3 million COVID-19 vaccine doses have been administered in Michigan
• Over 6.7 million Michiganders have received at least one dose (67.5%)
• Over 6 million Michiganders have completed a primary series (60.7%)
• Over 3.3 million additional/booster doses have been administered in Michigan
• 55.3% of the fully vaccinated population has received a booster
• 77.4% of the fully vaccinated population 65 years of age or older has received a booster
• Nearly 599,983 Michiganders 50 years of age or older who have received a first booster dose have
received second booster (27.9%)
COVID-19 Vaccine Coverage by Age Group
https://www.michigan.gov/coronavirus/0,9753,7-406-98178_103214_103272-547150--,00.html
27
https://covid.cdc.gov/covid-data-tracker/#vaccinationsCOVID-19 vaccines are now available for ages 6 months and up
https://www.michigan.gov/coronavirus/0,9753,7-406-98178_103214_103272-547150--,00.html
Michigan.gov/KidsCOVIDvaccine
https://www.cdc.gov/coronavirus/2019-ncov/vaccines/recommendations/children-teens.html
https://www.cdc.gov/vaccines/covid-19/clinical-considerations/covid-19-vaccines-us.html
https://www.cdc.gov/coronavirus/2019-ncov/vaccines/booster-shot.html#when-you-can-get-boosterUnvaccinated people in Michigan had 33 times the risk of dying from COVID-
`
19 in April compared to people up to date on their vaccination
*These data reflect cases among persons with a positive specimen collection date through March 19, 2022, and deaths among persons with a positive specimen collection date through February 26, 2022.
Please note that these provisional data are subject to change. **Data on immune status are unavailable, thus an additional dose in an immunocompromised person cannot be distinguished from a booster dose.Nationally, unvaccinated adults had 3.6 times the risk of hospitalizations from
`
COVID-19 in April compared to people up to date on their vaccinationEpidemiology of Myocarditis and Pericarditis Following mRNA Vaccination by Vaccine
Product, Schedule, and Interdose Interval Among Adolescents and Adults in Ontario, Canada
JAMA Network Open. 2022;5(6):e2218505
Key Points
Question: Do rates of reported myocarditis or pericarditis following COVID-19 mRNA vaccination vary by
vaccine product and interdose interval?
Population: Study of 297 individuals in Ontario, Canada from December 2020 to September 2021, with
myocarditis or pericarditis following COVID-19 vaccination
Findings: Higher rates of myocarditis or pericarditis were associated with receipt of mRNA-1273 [Moderna
Spikevax] compared with BNT162b2 [Pfizer-BioN Tech Comirnaty] as a second dose, particularly among male
individuals aged 18 to 24 years. Higher rates were also observed with shorter interdose intervals.
Meaning: Results suggest that there may be product-specific differences in rates of myocarditis or pericarditis
after receiving mRNA vaccines and that programmatic strategies may be associated with reduced risk of
myocarditis or pericarditis after receiving mRNA vaccines.
31Vaccines Tests
Protect against Prevent spread
severe outcomes Over-the-counter tests
Vaccines and boosters allow for testing at
are available for ages 6 home; an important
months and up. addition to on-site
Protect Yourself, antigen and PCR testing.
Protect Your
Masks, Distancing
Community
& Ventilation Treatment
Prevent spread Protect against
severe outcomes
People with symptoms, a
positive test, or exposure to Oral antivirals and
someone with COVID-19 monoclonal antibodies
should wear a mask. Masking can reduce the risk of
may also be based on personal hospitalization and
preference and informed by death from COVID-19.
personal level of risk.Pediatric Vaccination for those 6 months to 5 years: Key Messages
COVID-19 vaccines are now available for ages 6 months and up
Everyone 6 months and older should also get an age-appropriate COVID-19 booster, when eligible
Vaccinations remain the best way to protect from COVID-19, especially from severe disease
The youngest children can get infected and suffer from severe outcomes
• Hospital admissions due to COVID-19 for children follow statewide trend with youngest ages accounting for majority of pediatric
admissions
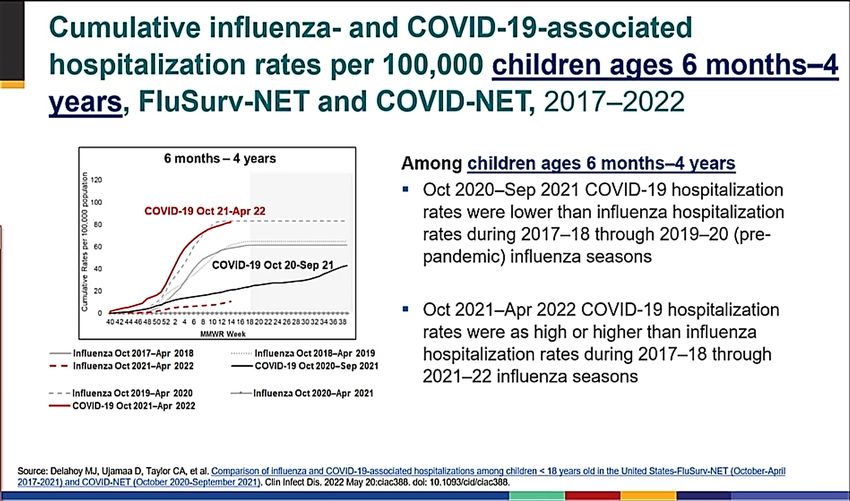
• During the Omicron surge, COVID-19 hospitalizations per capita was higher for those 6 months to 4 years than for children of other ages
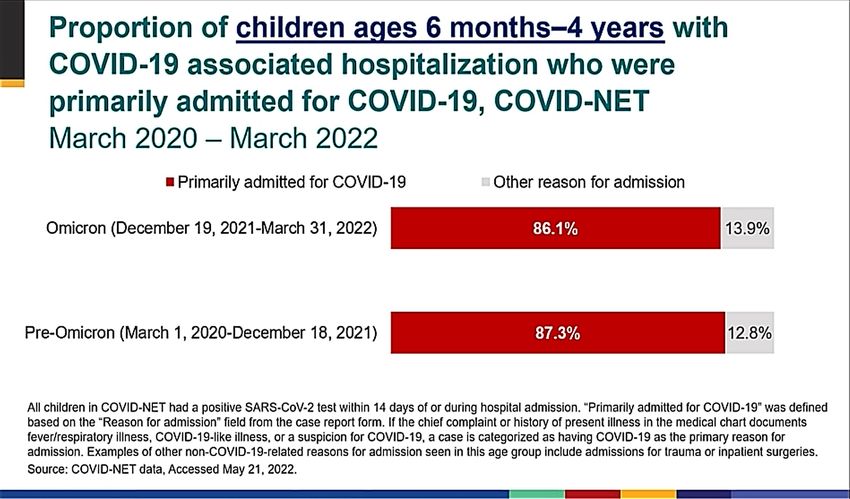
• The proportion of children ages 6 months to 4 years with COVID-19 associated hospitalization were primarily admitted for COVID-19 and
over half have no underlying medical conditions
• Compared to other vaccine preventable diseases, COVID-19 is responsible for more hospitalizations and deaths
• In Michigan, multisystem inflammatory syndrome in children (MIS-C), over a quarter of all cases have been reported from those under the
age of 5
• Nationally, over 60% of MIS-C cases under the age of 5 have been reported among Non-Hispanic Blacks and Hispanic/Latino
• COVID-19 is a leading cause of death among all children, including one of the leading causes of death for those under 5 years
• Based on cumulative total incidence, COVID-19 is the leading cause of death among infectious diseases for people aged 0-19
• Among children under the age of 5, COVID-19 is the fifth most common of all causes of death
COVID-19 vaccine has proven to be safe for children in other age groupsCOVID-19 vaccines are now available for ages 6 months and up
https://www.michigan.gov/coronavirus/0,9753,7-406-98178_103214_103272-547150--,00.html
Michigan.gov/KidsCOVIDvaccine
https://www.cdc.gov/coronavirus/2019-ncov/vaccines/recommendations/children-teens.html
https://www.cdc.gov/vaccines/covid-19/clinical-considerations/covid-19-vaccines-us.html
https://www.cdc.gov/coronavirus/2019-ncov/vaccines/booster-shot.html#when-you-can-get-boosterHospital admissions due to COVID-19 for children follow statewide trend with
youngest ages accounting for majority of pediatric admissions
• Hospital admissions reflect statewide infection trends where admissions are higher during surges of SARS-CoV-2
transmission
• Among those under 18 years of age, the majority of hospital admissions occurred in those 0-11 in Michigan
• Among those under 12 years of age, the majority of hospital admissions occurred in those 0-4 in Michigan
36
Source: CHECC & EM Resource• During the Omicron surge, COVID-19 hospitalizations per
capita was higher for those 6 months to 4 years than for 5- to
11-year-olds and 12- to 17-year-olds within the COVID-NET
surveillance program
Reported by the CDC at the Meeting of the Advisory Committee on Immunization Practices (ACIP) to discuss immunizations for 6 months to 5 years (Moderna and Pfizer), June 22-23, 2022Reported by the CDC at the Meeting of the Advisory Committee on Immunization Practices (ACIP) to discuss immunizations for 6 months to 5 years (Moderna and Pfizer), June 22-23, 2022
Reported by the CDC at the Meeting of the Advisory Committee on Immunization Practices (ACIP) to discuss immunizations for 6 months to 5 years (Moderna and Pfizer), June 22-23, 2022
Reported by the CDC at the Meeting of the Advisory Committee on Immunization Practices (ACIP) to discuss immunizations for 6 months to 5 years (Moderna and Pfizer), June 22-23, 2022
Reported by the CDC at the Meeting of the Advisory Committee on Immunization Practices (ACIP) to discuss immunizations for 6 months to 5 years (Moderna and Pfizer), June 22-23, 2022
Multisystem Inflammatory Syndrome in Children (MIS-C)
      Michigan Surveillance

       •    Higher community transmissions is
            followed by higher incidence of MIS-
            C cases

       •    304 cases identified in Michigan:
            highest numbers have occurred after
            most recent omicron surge

       •    More than 70% of those children are
            elementary and pre-school aged

       •    Black/African American children are
            disproportionately impacted
                                                                Age Group   Count   %       Race                      Count   %
Reported by the CDC at the Meeting of the Advisory Committee on Immunization Practices (ACIP) to discuss immunizations for 6 months to 5 years (Moderna and Pfizer), June 22-23, 2022
Reported by the CDC at the Meeting of the Advisory Committee on Immunization Practices (ACIP) to discuss immunizations for 6 months to 5 years (Moderna and Pfizer), June 22-23, 2022
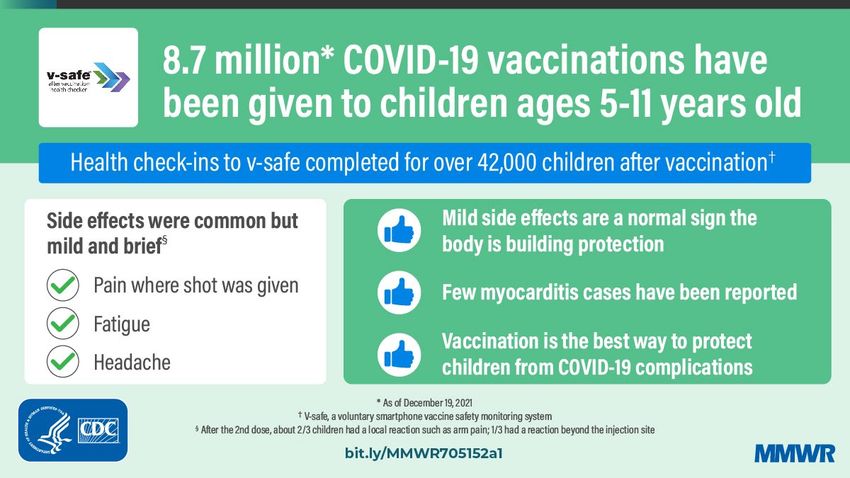
COVID-19 Vaccine Has Proven to be Safe for Children in Other Age
     Groups
       •    In preauthorization trials for Pfizer-
            BioNTech COVID-19 vaccine, vaccinated
            children aged 5–11 years reported mild to
            moderately severe local and systemic
            reactions
               • No serious vaccination-related
                   events were noted
       •    After authorization of Pfizer-BioNTech
            COVID-19 vaccine for children aged 5–11
            years during October 2021, and
            administration of approximately 8 million
            doses, local and systemic reactions after
            vaccination were reported to VAERS and
            v-safe for vaccinated children aged 5–11
            years.
               • Serious adverse events were rarely
                   reported
       •    Parents and guardians of children should
            be advised that local and systemic
            reactions are expected after vaccination
            and are more common after the second
            dose

Source: Hause AM, Baggs J, Marquez P, et al. COVID-19 Vaccine Safety in Children Aged 5–11 Years — United States, November 3–December 19, 2021. MMWR Morb Mortal Wkly Rep 2021;70:1755–1760. DOI:
http://dx.doi.org/10.15585/mmwr.mm705152a1
APPENDIX
Ohio, Indiana

                49
Wisconsin, Michigan
50Illinois, Minnesota
51Emerging Variant Update
• Omicron continues to be the predominant concern, including all its sublineages
• Omicron has several sublineages of this variant, including BA.1, BA.2, BA.4, BA.5, BA.2.12.1,
and recombinations of these.
• BA.4 and BA.5 (new sublineages of Omicron) may spread faster than current lineages of
Omicron in U.S. or U.K. These variants are spreading in other countries (BA.4 in S. Africa; BA.5
in Portugal), but data is still very preliminary.
• Here in the U.S., BA.2.12.1 is now the most predominant but the proportion of BA.2 is below
50% and decreasing
• BA.2.12.1 is most common variant in HHS Region 5 (Illinois, Indiana, Michigan,
Minnesota, Ohio, Wisconsin)
Sources: UKHSA technical briefings, WHO science briefing , GSAID – COVID sequencing , CDC Variant TrackerCase Rate Trends by Age Group
Daily new confirmed and probable cases per million by age group (7-day rolling average)
3000
0-9 30-39 60-69
10-19 40-49 70-79
2500 20-29 50-59 80+
2000
1500
1000
500
0
1/1 1/15 1/29 2/12 2/26 3/12 3/26 4/9 4/23 5/7 5/21 6/4 6/18
• Case rate trends for all age groups experienced a plateau over the last week
• Case rates by onset date for all age groups are between 67.3 and 195.0 cases per million (through 6/24/22)
• Case counts and case rates are highest for 30-39-year-olds this week, followed by 80+year-olds and 40-49-year-olds age
groups
Note: Case information sourced from MDHHS and reflects date of onset of symptoms
Source: MDHHS – Michigan Disease Surveillance System
53Case Rates by Reported Racial and Ethnic Group
Daily new confirmed and probable cases per million Daily new confirmed and probable cases per
(7 day rolling average) by race category million (7 day rolling average) by ethnicity category
2000 American Indian/Alaska Native Black/African American 2000 Hispanic or Latino Not Hispanic or Latino
Asian/Pacific Islander White
Race Case Rate Race Case Rate
Hispanic/Latino 106.5
1500 American Indian/ 85.3
1500
Alaskan Native Non-Hispanic 110.9
Asian/Pacific Islander 169.1
Black/African American 107.5
1000 White 108.5 1000
500 500
0 0
1/1 2/1 3/1 4/1 5/1 6/1 7/1 1/1 2/1 3/1 4/1 5/1 6/1 7/1
Updates since last week:
• Cases per million are decreasing at similar rate for all reported racial and ethnic groups
• In the past 30 days, 21.2% (↓ 0.6%) of race data and 26.2% (↓ 0.7%) ethnicity data was either missing or reported as unknown
Note: Case information sourced from MDHHS and reflects date of death of confirmed and probable cases.
Source: MDHHS – Michigan Disease Surveillance System
54CDC COVID-19 Community Levels are defined by County Case Rates and
Health Service Area (HSA) Hospitalizations
Source: CDC COVID-19 Community Levels https://www.cdc.gov/coronavirus/2019-ncov/science/community-levels.htmlYou can also read