UPDATE ON SARS-COV-2 VARIANTS AND THE EPIDEMIOLOGY OF COVID-19 - CDC.GOV/CORONAVIRUS

Page created by Ellen Moody
 
CONTINUE READING
UPDATE ON SARS-COV-2 VARIANTS AND THE EPIDEMIOLOGY OF COVID-19 - CDC.GOV/CORONAVIRUS
Update on SARS-CoV-2
Variants and the
Epidemiology of COVID-19
CDR Heather Scobie, PhD, MPH

Coronavirus and Other Respiratory Viruses Division (Proposed)
Centers for Disease Control and Prevention

September 1, 2022

                                                          cdc.gov/coronavirus
UPDATE ON SARS-COV-2 VARIANTS AND THE EPIDEMIOLOGY OF COVID-19 - CDC.GOV/CORONAVIRUS
SARS-CoV-2 Variants
UPDATE ON SARS-COV-2 VARIANTS AND THE EPIDEMIOLOGY OF COVID-19 - CDC.GOV/CORONAVIRUS
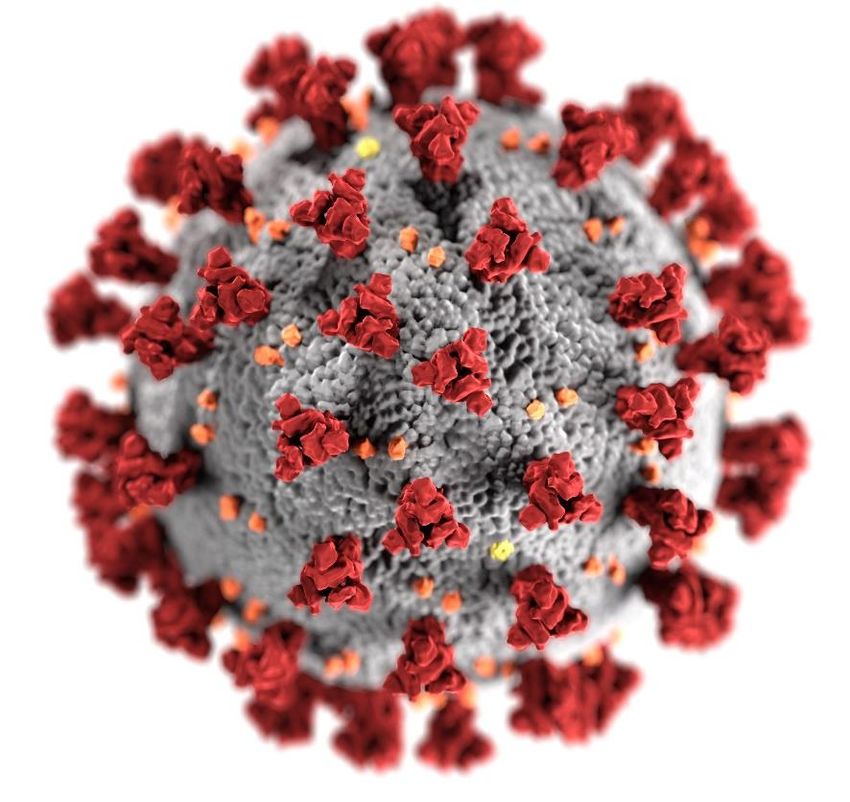
SARS-CoV-2 Omicron (B.1.1.529) variant
▪ Five main sub-lineages: BA.1 through BA.5
▪ Increased transmissibility and immune
  evasion, but decreased disease severity
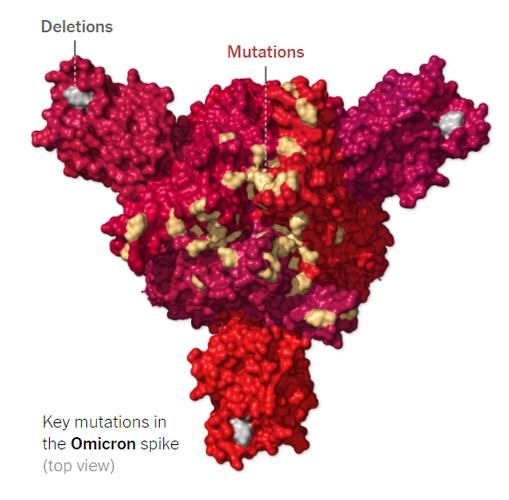
▪ 30+ mutations in spike gene (S-gene)
   – 15 in receptor binding domain
▪ Lower vaccine effectiveness
   – Reduced neutralization by sera from vaccinated or
     convalescent individuals
▪ Reduction in efficacy of some monoclonal
  antibody treatments                                                                                     Key mutations (yellow) in the
                                                                                                         Omicron spike protein (top view)
                                                                                                             Source: New York Times
https://www.cdc.gov/coronavirus/2019-ncov/variants/omicron-variant.html                                                                     3
https://www.cdc.gov/coronavirus/2019-ncov/science/science-briefs/scientific-brief-omicron-variant.html
UPDATE ON SARS-COV-2 VARIANTS AND THE EPIDEMIOLOGY OF COVID-19 - CDC.GOV/CORONAVIRUS
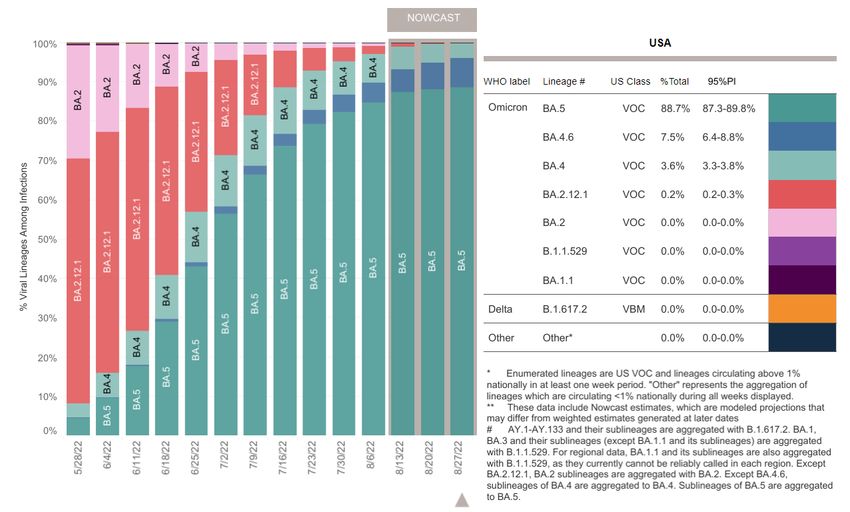
Trends in Weighted Variant Proportion Estimates & Nowcast
     United States, May 22–August 27, 2022

                                          Collection date, week ending
                                                                                                                                                                        4
PI=Prediction Interval, VOC=Variants of Concern, VBM=Variants Being Monitored. https://covid.cdc.gov/covid-data-tracker/#variant-proportions Accessed August 26, 2022
UPDATE ON SARS-COV-2 VARIANTS AND THE EPIDEMIOLOGY OF COVID-19 - CDC.GOV/CORONAVIRUS
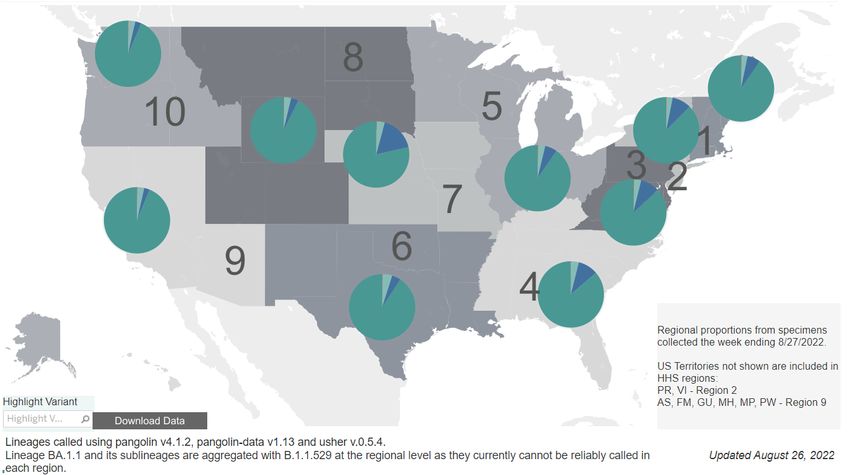
Estimated Number of Reported COVID-19 Cases by Variant
    Variant Proportions Scaled by Positive Nucleic Acid Amplification Test (NAAT) Counts

              Positive tests / Proportion of viral lineages   6M

                                                              4M

                                                              2M

                                                               0

CDC COVID-19 Lab Coordinating Unit Strain Surveillance and Emerging Variant Group. Data sources: https://covid.cdc.gov/covid-data-tracker/#variant-proportions
and https://covid.cdc.gov/covid-data-tracker/#trends_newtestresultsreported_7daytestingpositive_00
UPDATE ON SARS-COV-2 VARIANTS AND THE EPIDEMIOLOGY OF COVID-19 - CDC.GOV/CORONAVIRUS
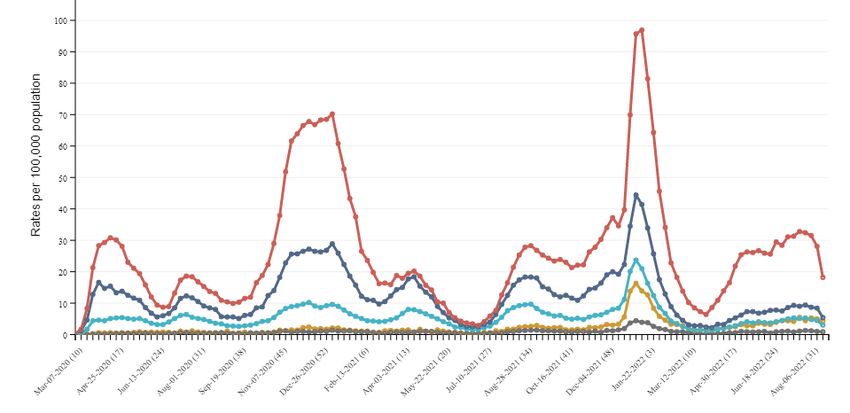
Nowcast Estimates of Variant Proportions by HHS Region
United States, August 21–27, 2022

                                                                                         Omicron
                                                                                         Sub-lineage

                                                                                              BA.5

                                                                                              B.4

                                                                                              BA.4.6

                                                                                              BA.2.12.1

HHS=Health and Human Services
https://covid.cdc.gov/covid-data-tracker/#variant-proportions Accessed August 26, 2022                 6
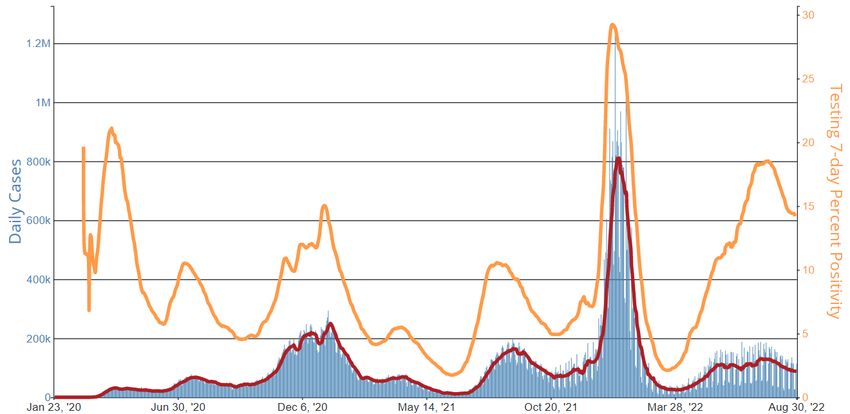
UPDATE ON SARS-COV-2 VARIANTS AND THE EPIDEMIOLOGY OF COVID-19 - CDC.GOV/CORONAVIRUS
COVID-19 Trends
UPDATE ON SARS-COV-2 VARIANTS AND THE EPIDEMIOLOGY OF COVID-19 - CDC.GOV/CORONAVIRUS
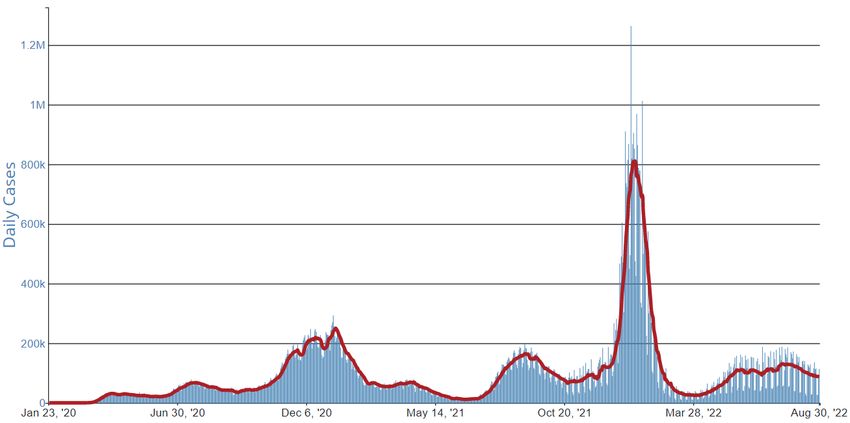
Daily Trends in Reported COVID-19 Cases, United States

                                                                                                               Omicron
                  As of August 30, 2022:
              94,268,241 reported cases

                                                                 Alpha                 Delta

CDC COVID Data Tracker. https://covid.cdc.gov/covid-data-tracker/#trends_dailycases Accessed August 31, 2022             8
UPDATE ON SARS-COV-2 VARIANTS AND THE EPIDEMIOLOGY OF COVID-19 - CDC.GOV/CORONAVIRUS
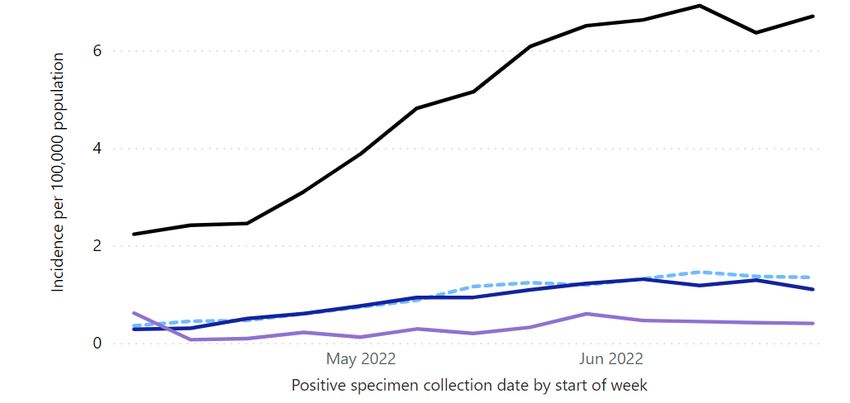
Daily Trends in Reported COVID-19 Cases and NAAT Percent
Positivity (7-day Moving Average), United States

                                             In May, trends in reported COVID-
                                             19 cases and NAAT positivity (%)
                                             become uncoupled, related to
                                             decreases in provider testing and
                                             increases in at-home testing

CDC COVID Data Tracker. https://covid.cdc.gov/covid-data-tracker/#trends_newtestresultsreported_7daytestingpositive_00 Accessed August 31, 2022   9
UPDATE ON SARS-COV-2 VARIANTS AND THE EPIDEMIOLOGY OF COVID-19 - CDC.GOV/CORONAVIRUS
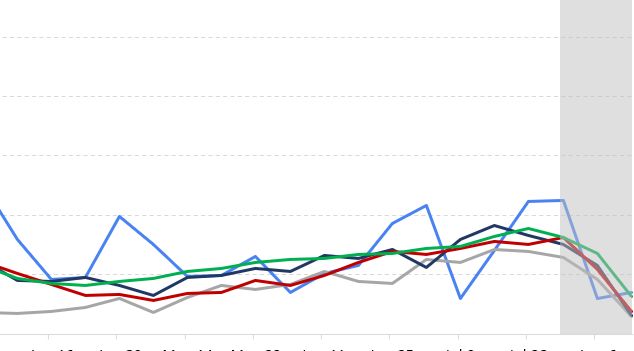
Weekly Trends in COVID-19-Associated Hospitalization Rates
by Age Group — COVID-NET, March 2020 – August 20, 2022
                                                                                                Omicron
             Age Group

                                                                                                 Since April,
                                                                                                 hospitalization
                                                                                   Delta
                                                                                                 rates in older age
                                                                                                 increased relative
                                                             Alpha                               to other age groups

Grey shaded area denotes the most recent 2 weeks where reporting is
Hospitalization Rate Ratios by Age Group
COVID-NET, June 2021 – May 31, 2022

            50-64 y
                                    2.3
                                     2.4                                       Delta (Jun 20-Dec 18, 2021)
                                    2.2
                                                                               Omicron BA.1 (Dec 19, 2021-Mar 19, 2022)
                                           3.1
            65-74 y                              4.0                           Omicron BA.2 (Mar 20-May 31, 2022)
Age Group

                                                   4.4

                                                    4.7
            75-84 y                                                 7.0
                                                                                      10.5

                                                              6.2
             85+ y                                                                    10.7
                                                                                                                       21.5

                       0        2            4            6               8      10          12   14   16   18    20   22
   Adults aged 18-49 years are the                                            Hospitalization Rate Ratio
   reference group for all periods

Havers et al. MMWR 2022; 71(34);1085–1091. https://www.cdc.gov/mmwr/volumes/71/wr/mm7134a3.htm?s_cid=mm7134a3_w               11
Characteristics of hospitalized adults ≥18 years
 COVID-NET, June 20, 2021 – May 31, 2022
                                                                          % of Total Hospitalizations
                                                                    Delta      Omicron BA.1 Omicron BA.2
                                                               Jun 20, 2021–             Dec 19, 2021–              Mar 20, 2021–
                                                                                                                                               Trends during
  Characteristic                                               Dec 18, 2021              Mar 19, 2022               May 31, 2022               BA.1 & BA.2
                                                                 (n=5,234)                 (n=1,804)                 (n=1,228)
  Age Median (years)                                                 59.9                      63.8                        70.5                ▪    Median age
  Likely COVID-19–related*                                                                                                                          increased
                                                                     95.5                      87.8                        85.4
  Risk Factors
                                                                                                                                               ▪    Underlying
  Any underlying medical condition                                   89.3                      91.7                        95.1                     conditions
  Immunosuppressive condition                                        11.0                      16.0                        19.2                     more
  Long-term care facility                                             5.7                       9.0                        14.2                     prevalent
  Outcomes
   Length of stay (days, median)                                      4.8                       3.9                         3.3                ▪    Clinical
   ICU admission                                                     24.3                      17.9                        13.2                     outcomes less
   Mechanical ventilation                                            13.5                       7.6                         5.7                     severe
   In-hospital death                                                 12.4                       7.5                         5.1
* COVID-19–related illness as a likely reason for admission is indicated by COVID-19 diagnosis or symptoms consistent with COVID-19 as the chief complaint or reason for
admission in the history of present illness. Non–COVID-19 reasons for admission included planned inpatient surgery or procedures, psychiatric admission needing acute
medical care, trauma, other, and unknown. Havers et al. MMWR 2022; 71(34);1085–1091. https://www.cdc.gov/mmwr/volumes/71/wr/mm7134a3.htm?s_cid=mm7134a3_w                  12
Age-Adjusted Rates of COVID-19-Associated Hospitalizations
 Among Persons of All Ages by Race/Ethnicity
 COVID-NET, March 7, 2020 – August 13, 2022 (3-Week Moving Average)
                                        80
                                                                                                                                         Recent
  COVID-19-associated hospitalization

                                        70                                                                                               hospitalization
    rate per 1000,000 population

                                        60                                                                                               rates highest
                                                                                                                                         among American
                                        50
                                                                                                                                         Indian/Alaskan
                                        40                                                                                               Native and
                                        30                                                                                               Black persons
                                        20

                                        10

                                         0

                                                                                 Calendar week ending date
                                             American Indian/Alaska Native   Asian/Pacific Islander   Black          Hispanic/Latino             White
Grey shaded area denotes the most recent 2 weeks where reporting is
Daily Trends in Number of COVID-19 Deaths, United States
Provisional Death Certificate Data, National Vital Statistics System

                                                                                             Omicron
          As of August 27, 2022:
               1,042,112 deaths                                                      Delta

                                                                          Alpha

https://www.cdc.gov/nchs/nvss/vsrr/covid_weekly/index.htm Accessed August 31, 2022
                                                                                                       14
Weekly Trends in COVID-19 Mortality Rates by Age Group,
  United States, March 1, 2020 – August 20, 2022
  Provisional Death Certificate Data, National Vital Statistics System

Source: National Center for Health Statistics, National Vital Statistics System. Data accessed on August 25, 2022. Date provided for "Week of Death" references week-end date.
The gray box over the most recent two weeks indicates total death data for these weeks are less than 60% complete overall and should be interpreted with caution.

 Source: https://data.cdc.gov/NCHS/Provisional-Weekly-Deaths-by-Region-Race-Age/tpcp-uiv5
Weekly Trends in Age-Adjusted COVID-19 Mortality Rates by
Race/Ethnicity, United States, March 1, 2020 – August 20, 2022
Provisional Death Certificate Data, National Vital Statistics System
                                   18
 Age Adjusted Deaths per 100,000

                                   16
                                   14
                                   12
                                   10
                                    8
                                    6
                                    4
                                    2
                                    0
                                    Mar-20     Jun-20   Sep-20    Dec-20      Mar-21    Jun-21      Sep-21         Dec-21         Mar-22          Jun-22
                                                                                  Week of Death

                                        American Indian/Alaska Native      Asian/Pacific Islander     Black         Hispanic/Latino              White
Source: National Center for Health Statistics, National Vital Statistics System. Data accessed on August 25, 2022. Date provided for "Week of Death" references week-end date.
The gray box over the most recent two weeks indicates total death data for these weeks are less than 60% complete overall and should be interpreted with caution.
https://data.cdc.gov/NCHS/Provisional-Weekly-Deaths-by-Region-Race-Age/tpcp-uiv5 (National Vital Statistics System provisional death certificate data)                           16
Weekly Trends in Age-Adjusted COVID-19 Mortality Rates by
Race/Ethnicity, United States, March 1, 2020 – August 20, 2022
Provisional Death Certificate Data, National Vital Statistics System
                                   18                                                                                                     Recent mortality rates
 Age Adjusted Deaths per 100,000

                                                                                                                                          show less evidence of
                                   16
                                                                                                                                          disparities
                                   14
                                   12
                                   10
                                    8
                                    6
                                    4
                                    2
                                    0
                                    Mar-20     Jun-20   Sep-20    Dec-20      Mar-21    Jun-21      Sep-21         Dec-21         Mar-22          Jun-22
                                                                                  Week of Death

                                        American Indian/Alaska Native      Asian/Pacific Islander     Black         Hispanic/Latino              White
Source: National Center for Health Statistics, National Vital Statistics System. Data accessed on August 25, 2022. Date provided for "Week of Death" references week-end date.
The gray box over the most recent two weeks indicates total death data for these weeks are less than 60% complete overall and should be interpreted with caution.
https://data.cdc.gov/NCHS/Provisional-Weekly-Deaths-by-Region-Race-Age/tpcp-uiv5 (National Vital Statistics System provisional death certificate data)                           17
Trends in COVID-19 by Vaccination Status
COVID-19 Vaccinations in the United States
      As of August 24, 2022

                  223.9M
                                                         72% Population
            People vaccinated
                                                         ≥5 Years of Age                     Differences in vaccination
           with a primary series
                                                                                             coverage by:
                                                                                             • Age, with lower primary series
                                                                                               coverage in children
                    108.5M
                                                         49% Population                      • Race/ethnicity, with lower booster
              People received a
                                                         ≥5 Years of Age                       coverage in most minority groups
             first booster dose*
                                                                                             • Disability status

                  23.1M
                                                        34% Population
             People received a
                                                        ≥50 Years of Age
           second booster dose*

*This includes people who received booster doses and people who received additional primary doses.
https://covid.cdc.gov/covid-data-tracker/#vaccinations_vacc-total-admin-rate-total Accessed August 24, 2022
Age-Adjusted Rates of COVID-19 Cases by Vaccination Status
Among Ages ≥5 years April 4, 2021 – July 23, 2022 (31 U.S. Jurisdictions)
                                                                               Omicron

                                         Delta
              Alpha

   In July 2022, unvaccinated people ages ≥5 years had 2.4X higher risk of testing positive for
   COVID-19, compared to those with at least a primary series
CDC COVID Data Tracker. https://covid.cdc.gov/covid-data-tracker/#rates-by-vaccine-status Accessed August 24, 2022   20
Age-Adjusted Rates of COVID-19-Associated Hospitalization by
Vaccination Status and Receipt of Booster Dose in Adults Ages ≥18 Years
COVID-NET, January 2021–June 2022      Omicron

                                                     Delta                                                          In June 2022,
                                                                                                                    unvaccinated adults
                                                                                                                    ages ≥18 years had
                                                                                                                    4.6X higher
                                                                                                                    COVID-19-associated
                                                                                                                    hospitalization rates
                           Alpha                                                                                    compared to those
                                                                                                                    vaccinated with at least
                                                                                                                    one booster dose

CDC COVID Data Tracker. https://covid.cdc.gov/covid-data-tracker/#covidnet-hospitalizations-vaccination Accessed August 3, 2022
Age-Adjusted Rates of COVID-19-Associated Deaths by Vaccination Status
    and Receipt of Booster Dose* Among Ages ≥5 years
    September 19, 2021 – July 2, 2022 (29 U.S. Jurisdictions)

                                                                        Omicron
                                                                                                                      In June 2022,
                                                                                                                      unvaccinated people
                           Delta                                                                                      ages ≥5 years had
                                                                                                                      8X higher
                                                                                                                      COVID-19-associated
                                                                                                                      death rates compared
                                                                                                                      to those with at least
                                                                                                                      one booster dose

                                                                                                                      This was a decrease
                                                                                                                      from ~20X during
                                                                                                                      January-March 2022

*This includes people who received booster doses and people who received additional doses. Vertical lines denote changes in booster dose recommendations.
CDC COVID Data Tracker. https://covid.cdc.gov/covid-data-tracker/#rates-by-vaccine-status Accessed August 24, 2022
                                                                                                                                                            22
Death Rates by Vaccination Status and Receipt of 1st and 2nd Booster
      Doses Among People Ages ≥50 Years April 3–July 2, 2022 (25 U.S. Jurisdictions)

                                                                                                   In June 2022, people ages
                                                                                                   50 years and older with
                                                                                                    ≥2 booster doses had
                                                                                                   14 times lower risk of dying
                                                                                                   from COVID-19, compared
                                                                                                   to unvaccinated people and
                                                                                                   3 times lower risk of dying
                                                                                                   from COVID-19 than people
                                                                                                   with one booster dose

*Includes either a booster or additional dose.
https://covid.cdc.gov/covid-data-tracker/#rates-by-vaccinbooine-status. Accessed August 24, 2022
Risk of Severe COVID-19 Illness
▪ Unvaccinated people at higher risk of severe illness compared with vaccinated people
▪ Most (75%) vaccinated people with severe COVID-19 illness have multiple risk factors:
  – Older age (most ≥65 years, but with risk increasing with age)
  – Underlying medical conditions (with risk increasing with number of underlying
    conditions)
      › Immunosuppression
      › Diabetes mellitus
      › Chronic kidney disease
      › Chronic lung disease
      › Chronic cardiovascular disease
      › Chronic neurologic disease
 ▪ Antiviral drugs can help reduce risk of severe illness in people at higher risk, regardless
   of vaccination status
Yek et al. MMWR 2022;71:19–25. https://www.cdc.gov/mmwr/volumes/71/wr/mm7101a4.htm; Taylor et al. MMWR 2022;71:466-473:
http://dx.doi.org/10.15585/mmwr.mm7112e2 and unpublished COVID-NET data, as described here; Malden et al. MMWR 2022; 71(25);830-833:
https://www.cdc.gov/mmwr/volumes/71/wr/mm7125e2.htm ; Gold et al. MMWR 2022; 71(25);825-829:
https://www.cdc.gov/mmwr/volumes/71/wr/mm7125e1.htm ; Najjar-Debbiny et al. CID 2022;, ciac443, https://doi.org/10.1093/cid/ciac443
Dryden-Peterson et al. medRxiv 2022.06.14.22276393; https://doi.org/10.1101/2022.06.14.22276393
Summary
▪ CDC continues to monitor emerging variants, like the sub-lineages of Omicron,
  including prevalence and impact on disease incidence, severity, and vaccine
  effectiveness over time
▪ Racial and ethnic minority groups have been disproportionately affected by
  COVID-associated hospitalization and mortality; these inequities have decreased
  over time but have not been eliminated
▪ Trend of increasing severe illness, including hospitalization and death, in people
  of older age and with underlying health conditions
▪ Currently approved vaccines offer protection against severe illness and death
  from COVID-19 — important to stay up to date with vaccination, including all
  boosters in eligible populations
▪ Therapeutics and multiple prevention measures should be used to protect
  people at higher risk of severe COVID-19 illness, regardless of vaccination status

                                                                                  25
Acknowledgements
▪ Amelia Johnson            ▪ Aron Hall
▪ Lauren Linde              ▪ Rebecca Kondor
▪ Akilah Ali                ▪ Phillip Shirk
▪ Justice King              ▪ Clint Paden
▪ Meagan Stephenson         ▪ Natalie Thornburg
▪ Steve Evener              ▪ Summer Galloway
▪ Betsy Gunnels             ▪ Dave Wentworth
▪ Benjamin Silk             ▪ Taraesa Toney
▪ Chris Taylor              ▪ Andrea Yunyou
▪ Fiona Havers              ▪ State and local health departments: AL, AR,
▪ Ruth Link-Gelles            AZ, CA, CO, CT, DC, FL, GA, ID, IN, IO, KS, LA,
                              MA, MD, MI, MN, NC, NE, NJ, NM, NY, NY
▪ Sara Oliver                 City, OH, Philadelphia, RI, Seattle/King
▪ Evelyn Twentyman            County, SD, TN, TX, UT, WA, WI, WV
▪ Katherine Fleming-Dutra
For more information, contact CDC
1-800-CDC-INFO (232-4636)
TTY: 1-888-232-6348 www.cdc.gov

The findings and conclusions in this report are those of the authors and do not necessarily
represent the official position of the Centers for Disease Control and Prevention.
You can also read